Tableau vs QlikView – 14 Ways To Choose Better BI Tool For Your Business
Job-ready Online Courses: Click, Learn, Succeed, Start Now!
This article is a comparative analysis of the two big names in the world of business intelligence, Tableau and QlikView. Every organization wants the best BI tool to harness the most out of the important data that they deal with almost daily. Here, we will learn the Tableau vs QlikView.
So, are you ready to explore the difference between Tableau vs QlikView?
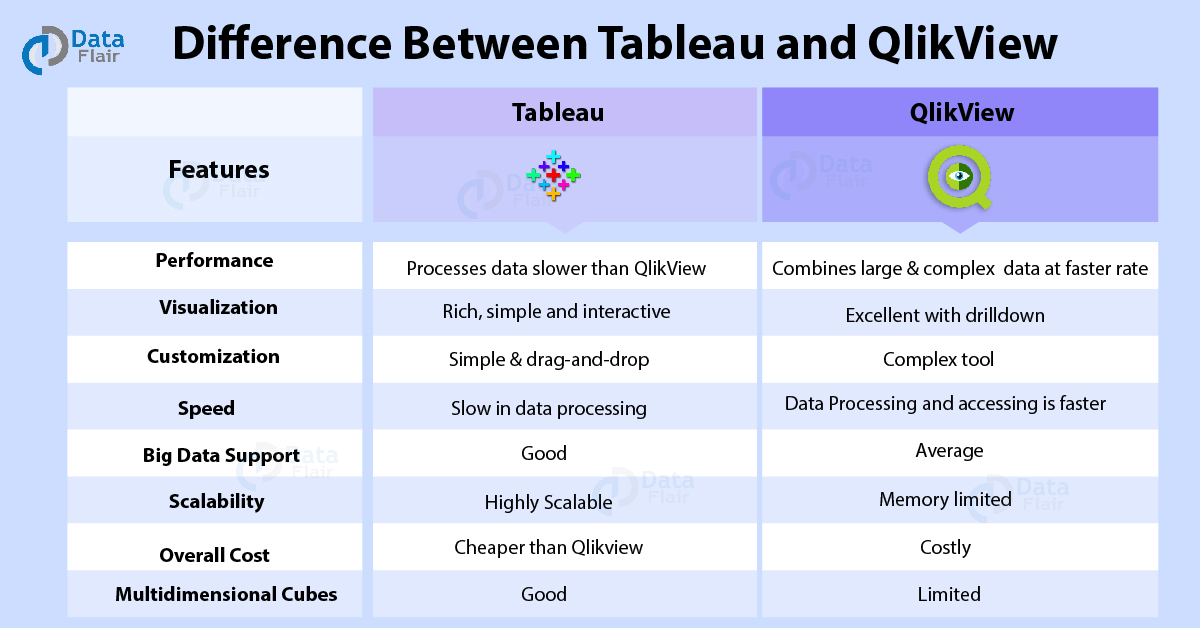
Tableau Vs QlikView
In your quest to coming down to five most efficient data analytics and business intelligence tools, we are sure QlikView and Tableau must have managed to gain a spot. With the whopping amounts of big data being generated every second, having an efficient BI tool is the need of the hour for organizations of every domain and sector.
QlikView and Tableau are both data analytics and visualization tools and share some common features with each other. But, both are different functions, let’s explore major factors of Tableau vs QlikView:
Similarities of Tableau and QlikView
Before we start, Tableau vs QlikView we will study their similarities:
- Both Tableau and QlikView provide a wide range of visualizations and high-end analytics capabilities to the users.
- Both have an active and widespread user community.
- Can integrate data from multiple data sources with ease.c
- Both Tableau and QlikView can be deployed on-premise as well as on the cloud.
- Tableau and QlikView, both the tools provide mobile compatibility.
- Both the tools support big data but Tableau’s support is slightly above average than QlikView.
- Both the software offers great scalability as they have successfully handled as much data as organizations have produced so far. However, QlikView faces RAM limitations in some cases.
Difference Between Tableau and QlikView
Now there are a lot of points upon which a line of difference can be drawn. So, let us discuss Tableau vs QlikView’s paths really starts to diverge.
- Performance
- Interface
- Suitability
- Ease of Use
- Pricing
- Storage
- Connectivity/integration
- Deployment
- Visualization
- Customization
- Security
- Speed
- Insight Generation
- Potential and Scope
i. Performance
QlikView: Is faster in data processing than Tableau. It conveniently combines large and complex data sets at faster rates.
Tableau: As it used the cubing technique to process and manage data, it is slower than QlikView.
ii. Interface
QlikView: QlikView’s interface can be a bit overwhelming at first for a new user as there are a lot of tools and options on the workspace. Although, they are all useful tools once a user gains expertise over the software.
Tableau: Tableau offers a rich, user-friendly, and interactive user-interface. It has a simple drag-and-drop interface. It seems easier-to-use than QlikView as it does not have many tools and items on the workspace.
iii. Suitability
QlikView: It is most suitable and recommended as a departmental and enterprise-centric BI solution.
Tableau: It is suitable for data visualization practices such as dashboarding and rapid visualizations. You can read about Tableau Dashboard here.
iv. Ease of use
QlikView: QlikView is a user-friendly tool which has a data search feature. The search feature of QlikView makes looking for the data set that you want from the entire database easy. The associative engine makes sorting useful information just by typing keywords in the text. However, due to the complex UI cluttered with a lot of items on the menu, tool designing becomes a little difficult.
Tableau: Tableau winds over QlikView by giving a flexible, interactive and simple graphical user interface. The menu does not have many items. With a simple drag-and-drop method, you can work on the tool. It does not have a very efficient search feature like QlikView.
v. Pricing
QlikView: Different QlikView services have varying costs and pricing. The QlikView is capital intensive as it requires investment in R&D.
- QlikView personal edition is free. But it restricts users from sharing documents.
- User licenses costs range from $1350 to $15,000.
- Server license costs about $35,000 per server.
- Server for PDF distribution service costs $21,000 per server.
- The price to purchase the SAP NetWeaver connector is $22,500.
Tableau: The desktop version is free which is called Public. It enables data downloading. The private versions costs between $999 to $1,999. The prices depend upon the extent of data access the user wants. Also, the Tableau server services cost about $1000 per service.
If you have a doubt in Tableau vs QlikView, feel free to share with us.
vi. Storage
QlikView: QlikView stores data in-memory (RAM). It works best on a 64-bit in-memory database. Data accessing and processing is much faster than QlikView.
Tableau: Tableau does not store the data it is going to use in-memory, it rather fetches it from the data source using the cubing technique. This makes QlikView faster than Tableau.
Do you know how QlikView backup and restore works?
vii. Connectivity/ Integration
QlikView: It can connect and fetch data from a wide range of external data sources. When compared to Tableau, QlikView has a bigger partner network thus, data integration is better in QlikView.
- Amazon EC2, Vectorwise, and Redshift
- Big data sources like Cloudera Hadoop and Impala, CSV, DatStax, Epicor Scala, EMC Green Plum, Hortonworks Hadoop.
- IBM DB2, IBM Netezza, Infor Lawson, Informatica Powercenter, MicroStrategy, HP Vertica.
- MS SQL Server, My SQL, ODBC, Par Accel, Sage 500, Salesforce, SAP, SAP Hana, Teradata, and many more.
- It can connect with the R language using API integration.
Tableau: It can integrate with a broader range of data sources including,
- Spreadsheets (Excel files), CSV files etc.
- SQL databases, MS SQL Server, MySQL, PostgreSQL
- Salesforce, Cloudera Hadoop, Firebird, Google Analytics, Google BigQuery, Hortonworks Hadoop
- HP Vertica, OData, Oracle, Pivotal Greenplum, Teradata, and Windows Azure Marketplace.
- Tableau can also establish a connection with the R language using tools.
viii. Deployment
QlikView: QlikView is an easily deployable tool. It does not require a technical team to set up and configure the software on your device. Installation is a few minutes long guided process. Also, it can be deployed on a 32-bit or 64-bit device.
Tableau: It is much easier to deploy than QlikView because it does not require multilevel layering.
ix. Visualization
QlikView: In this battle of Tableau vs QlikView. QlikView is loaded with visualization tools and objects such as QlikView charts, tables, texts, images, boxplots, waterfall charts etc. Along with this, QlikView provides gauge charts and 3D visualization forms for charts. The customization and formatting of visualization objects are good in QlikView. Although, for geospatial visualizations, external tools are needed. Data interactivity, visual drill down, mobile clients, UI interactivity (MDI support) is better in QlikView than Tableau.
Tableau: Tableau offers one of the best visualizations of all the BI tool. The visualizations are eye-pleasing, easily customizable and formattable. It has an inbuilt extension to support geospatial or geographic visualization and so, creating and displaying maps is much easier than QlikView. However, it does not support 3D charts and gauge charts. Features like dashboard support, web clients, visual controls are better in Tableau than QlikView.
x. Customization
QlikView: QlikView is quite a complex tool when it comes to developing and customizing elements in it. The data visuals can be formatted and customized, but for that, you need to be well-versed with certain technical aspects like knowing specific languages etc. QlikView does not provide much flexibility when it comes to its graphs, charts, reports, and dashboards.
Tableau: Tableau beats QlikView in this one without a doubt because customization in Tableau is like no other BI tool. It offers a high degree of customization where charts and graphs can be formatted to the slightest detail. Also, creating calculated fields, changing axes, etc. are very easy because you just need a basic understanding of programming in general, to get through. Tableau makes data storytelling an extremely easy-to-use feature for the users.
xi. Security
QlikView: QlikView has a Windows NTFS File security system which monitors direct access of documents by the QlikView Desktop users. Along with this, security and user authentication are taken care in QlikView at many levels such as scripts, documents, section access. The access to the QlikView Management Console is also restricted to only the authenticated users.
Tableau: Security in Tableau is handled by the Tableau server. The main domains where security is a prominent concern are the data sources, user authentication etc. Software only connects to safe and trustworthy data sources.
xii. Speed
QlikView: Data processing and accessing is faster because of QlikView stores data in-memory. QlikView has a personal data warehouse.
Tableau: Unlike QlikView, Tableau does not have a data warehouse and uses data cubes due to which data accessing and processing is a slow process.
xiii. Insight generation
QlikView: Insight generation is easy and possible by the virtue of associative engine and capabilities in QlikView. It enables quicker and better data discovery. Thus, the user gets exactly the data set they were looking for and draw proper insights from it to represent it in the form of reports and visualizations.
Tableau: Insight generation in Tableau is by the virtue of a solid data storytelling capability. Best guided and discovered user insights are displayed in the form of presentations, reports, and stories to the business users who make informed decisions for the betterment of the enterprise.
xiv. Potential and scope
QlikView: Qlik in response to the growing demand for an easier to use a tool, launched Qlik Sense into the market. However, we cannot see Qlik Sense as a replacement of QlikView as they are fundamentally different tools.
Qlik Sense aims at serving all kinds of users in an organization due to its sheer simplicity and interactive capabilities. QlikView will keep being an efficient tool for its target audience as it is an efficient and unique tool in its own ways. Qlik continuously works on the development of QlikView.
Tableau: Tableau, being one of the most popular BI tools presently, is much likely to retain its popularity in the future as well. Every year, the tableau is releasing two new versions of it with keeping it in sync with the current BI trends and demands. Here, we have new features with the new versions such as settings alerts for outliers, a new set of data connectors, better APIs and visuals etc.
However, Tableau will always stand out as a unique tool for its sheer simplicity and flexibility as a tool and the capabilities provided such as forecasting and trending analysis.
So, this is the end of the Tableau Vs QlikView battle. Hope, you liked our explanation.
Summary – Tableau Vs QlikView
In conclusion, there is definitely no clear winner in this competition of Tableau vs QlikView. Now, let us explain why. Both tools are useful and efficient in their own ways. So, it entirely depends on the needs and requirements of the organization (the customers). It is only according to what an organization needs, can one say which tool is best suited.
Thus, if your purpose is to have a tool for both data discovery, app development, and data visualization, then QlikView is the tool for you. But if you require an easy-to-use data visualization tool with attractive graphics and UI with drag and drop functionality, then Tableau is the way to go.
QlikView is a suitable tool if yours is a big organization, you need a multifaceted software with extended capabilities to deal with large data sets. While Tableau is perfect when you need a simple drag-and-drop visualization tool offering great scalability.
So, we hope the comparison Tableau Vs QlikView drawn by us helped you in selecting the tool of your choice. If you have any query feel free to ask in the comment box. You may also like to read our article which is better BI Tool?QlikView Vs QlikSense.
You give me 15 seconds I promise you best tutorials
Please share your happy experience on Google


