Add Data Layer to Map – Tableau Custom Map Layer
Placement-ready Online Courses: Your Passport to Excellence - Start Now
In this tutorial, we are going to study How to add data layer to map in Tableau, how to Create Custom Map Data Layer and it stepwise description. So, let us start Custom Map Data Layer in Tableau.
What is Map Layer in Tableau?
Tableau Map layers can change the way maps look/Style. There are map layers that change the style of the map to use either a light, normal, or dark background. There are also data layers that overlay additional information, such as place names or population, on top of the existing maps in Tableau.
Let’s Know About Tableau Heat Map in detail
How to Add Data Layer to Map in Tableau?
These are the following Steps to customize map layer in tableau:
i. Right-click on the Location field under Dimensions
ii. Go to Geographic Role and select State/Province:

Step. 2 Adding Data Layer to Map
iii. Double-click Location. Latitude (generated) is automatically placed in Rows and Longitude (generated) is automatically placed in Columns. The Location pill is also automatically placed in the Details property.
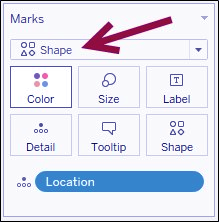
iv. Under the Marks card, click on the drop-down and change the mark to Shape:
Step. 4 Adding Data Layer to Map
v. From Measures, drag the calculated field Percentage to Shape the Marks card.
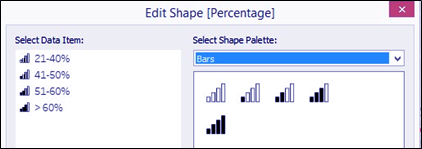
vi. Click on the top-right drop-down arrow of the Shape legend and assign the following shapes from the Bars palette. To assign, click on a value on the left Select Data Item column, and then click on the appropriate icon you want to assign from the right column.
Step. 6 Adding Data Layer to Map
vii. In this recipe, no shaded bars are assigned to 21-40%, and four shaded bars is assigned to > 60%.
viii. Click OK when done.
ix. Click on Size in the Marks card and move the slider to the right to make the icons on the map a little bit bigger.
x. From Measures, drag the calculated field Percentage to Color in the Marks card.
xi. From Measures, drag the field Percentage of households with pets to Label in the Marks card.
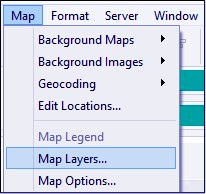
xii. Go to the Map menu and select Map Layers:
xiii. In the Map Layers sidebar that appears, do the following:
- Under Map Layers, check Coastline and State/Province Borders
- Under Data Layer, select Housing Units Growth % 2016-2021. Data Layer, use the color palette Orange-Blue Diverging

xiv. Close the Map Layers sidebar when done.
Conclusion
Hence, in this tutorial we learned about how to add data layer to map in Tableau, how to create data layers in the map, a stepwise procedure to create them. Furthermore, if you have any query feel free to ask in a comment section.
You give me 15 seconds I promise you best tutorials
Please share your happy experience on Google


