Tableau Constant Line – Adding Constant Line in Tableau
Placement-ready Online Courses: Your Passport to Excellence - Start Now
In our last tutorial, we saw Tableau Parameter Tutorial. Here, in this tutorial, we are going to learn about Constant Line in Tableau and its different types with examples. So, let us start!!
Tableau Constant Line
This is simply a line we add to a graph that has a value that doesn’t change. This value is typically hardcoded (or set) and is not determined by other values in the graph. For example, if we wanted to show the value of pi (3.1415927 – depending on the precision you want to show), we can use a constant line in tableau.
Let’s Discuss How to Create Sparklines Chart
Creating Constant Line in Tableau
These are the following steps to edit Constant line in tableau:
i. Click on the drop-down in the Marks card and change the mark to Circle.
ii. From Measures, drag Salary/Winnings $ to Columns.
iii. From Measures, drag Endorsements $ to Rows
iv. From Dimensions, drag Sport to Color.
v. From Dimensions, drag Athlete to Detail.
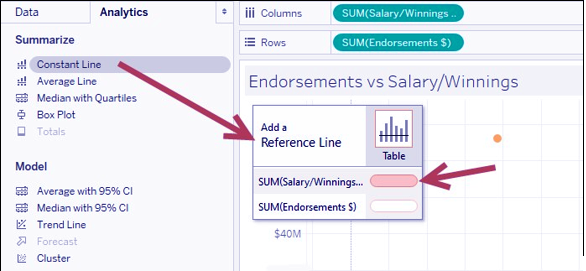
vi. On the sidebar, click on the Analytics tab to activate it.
vii. Under Summarize, drag Constant Line from the Analytics tab and drop it on the SUM(Salary/Winnings $) placeholder:
Read about Tableau Trend Line and how to create it in detail
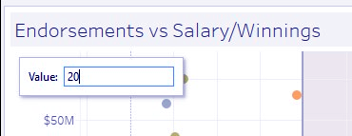
viii. Enter the value 20:
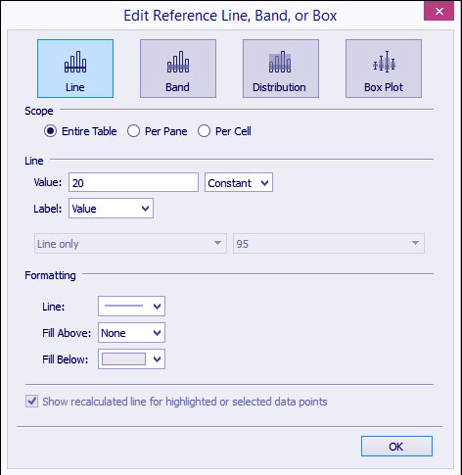
ix. Right-click on the constant line that was added and select Edit.
x. Set the Fill Above: color to None and the Fill Below: color to a light gray color:
xi. Right-click on the constant line again and select Format.
xii. On the Format sidebar, under the Constant Line Label section, select alignment. Set the Vertical alignment to Top.
Let’s Create a Story Line in Tableau
xiii. From the Analytics tab, drag the Constant Line again, this time placing it on SUM(Endorsements $) placeholder.
xiv. Set the constant value to 40.
xv. Right-click on the new constant line and select Edit.
xvi. Under Formatting, set the Fill Above color to a light gray color and the Fill Below color to None.
xvii. Right-click on the constant line again and select Format.
xviii. On the Format sidebar, under the Reference Line Label section, select Alignment.
Set the Vertical alignment to Bottom.
Conclusion
In this tutorial, we learned about adding a constant line in Tableau, its functions and appropriate uses. Hope you liked the tutorial.
You give me 15 seconds I promise you best tutorials
Please share your happy experience on Google


how can you make that value be a decimal – i.e. “1.3”
good afternoon sir/madam ,
firstly thank you that you are teaching the this content which is valuable outside , for free . It is really helpful . but comparing to remaining topics this topic is bit tough and also there aren’t any visuals of tableau in this particular topic . hope you consider this and continue to teach us .
Thank you