Data Blending in Tableau – Learn to combine relevant data from distinct data sources
We offer you a brighter future with industry-ready online courses - Start Now!!
In this tutorial, we will learn about the basics of data blending in Tableau. We will see how is it different from joins in Tableau and lastly how to blend data from two different data sources. So let’s start the interesting learning journey without any delay further.
Data Blending in Tableau?
In Tableau, the data blending features allow us to bring data from two different data sources together in a single view or a single Tableau worksheet.
It is different from creating joins because blending only combines relevant data from distinct data sources, whereas joins work on row-level and often duplicate data that is repeating in several rows.
In data blending, there are two data sources; a primary data source and a secondary data source. The additional relevant data of the secondary data source is taken and displayed with the main data of the primary data source.
We can make graphs and charts using the data from both data sources at the same time in a sheet.
Before moving further, get yourself acquainted with how to extract data in Tableau?
Primary and Secondary Data Sources in Tableau
To understand and perform data blending in Tableau, we first need to acquaint ourselves with primary and secondary data sources. For data blending, the primary data source is the main table whereas secondary data source is the additional table.
There should be at least one secondary data source to perform blending in a Tableau sheet. The data from the primary data source is the main data based on which Tableau defines graphs and charts.
However, only those data values that are relevant, matching, or corresponding to the values of primary data sources are taken from secondary data sources leaving everything else at the source.
For instance, in our H&M sales data, if in the primary data source we have regions like North, West, Central. But, the secondary data source has North, South, West, and East.
Then, upon data blending, the final graph cannot show data related to the South and East regions because it is not in the primary data source. So, you should always select your primary and secondary data sources wisely, depending upon the fields and values you wish to show in a chart. You can select a data source as primary by simply using its fields first in a chart.
Check out different types of Tableau data sources with DataFlair.
Defining Link Relationships for Data Blending in Tableau
We can define relationships or create links between data fields from a blended primary and secondary data source. Ideally, Tableau creates links between similar fields automatically, but you can define more relationships with the help of the Edit Relationships option.
To create a link between two fields, you must have common dimensions in both data sources. Such common dimensions are known as Linking fields. Once you have linking fields in both your primary and secondary data sources, you can easily create a link.
Here are some important points you should keep in mind while establishing a link between two linking fields.
a. All the links are shown in the secondary data source pane in a sheet. Here, you will find an orange link (chain) icon in front of the linked fields and a grey broken link icon for the potential linking fields.
b. You can create a link between two fields only if they contain similar data. For instance, if Table 1 has the Regions field and Table 2 has Zones field with the same field values, that is, North, South, East, West, you can manually establish a link between these two fields or common dimensions rather than renaming one of them.
c. You just need to click on a broken link icon to activate an inactive linking field.
d. If your primary and secondary data sources have more than one field in common or more than one potential linking field, then multiple links can be established between them in a single Tableau worksheet at a time.
How to Blend Data in Tableau?
Let us understand data blending in Tableau with the help of an example. We have two data sets: H&M store 2018 sales and H&M store 2019 sales. Now, the number of fields in both these data sets is the same but data is different.
For instance, in the table “H&M 2018” the field named Region stores all the regions data. Whereas in the “H&M 2019” table, the field having the same 5 regions is called Zone. With the help of data blending, we can equate these two fields as both of them contain similar regions like north, south, central, east and west.
Hence, data blending helps in establishing relationships between two relevant data sources which makes data analysis more meaningful and insightful. We can compare two data sets more efficiently by blending them in a single Tableau worksheet.
So, before we start learning about blending data, let us first show you our two sets of sample data of H&M sales.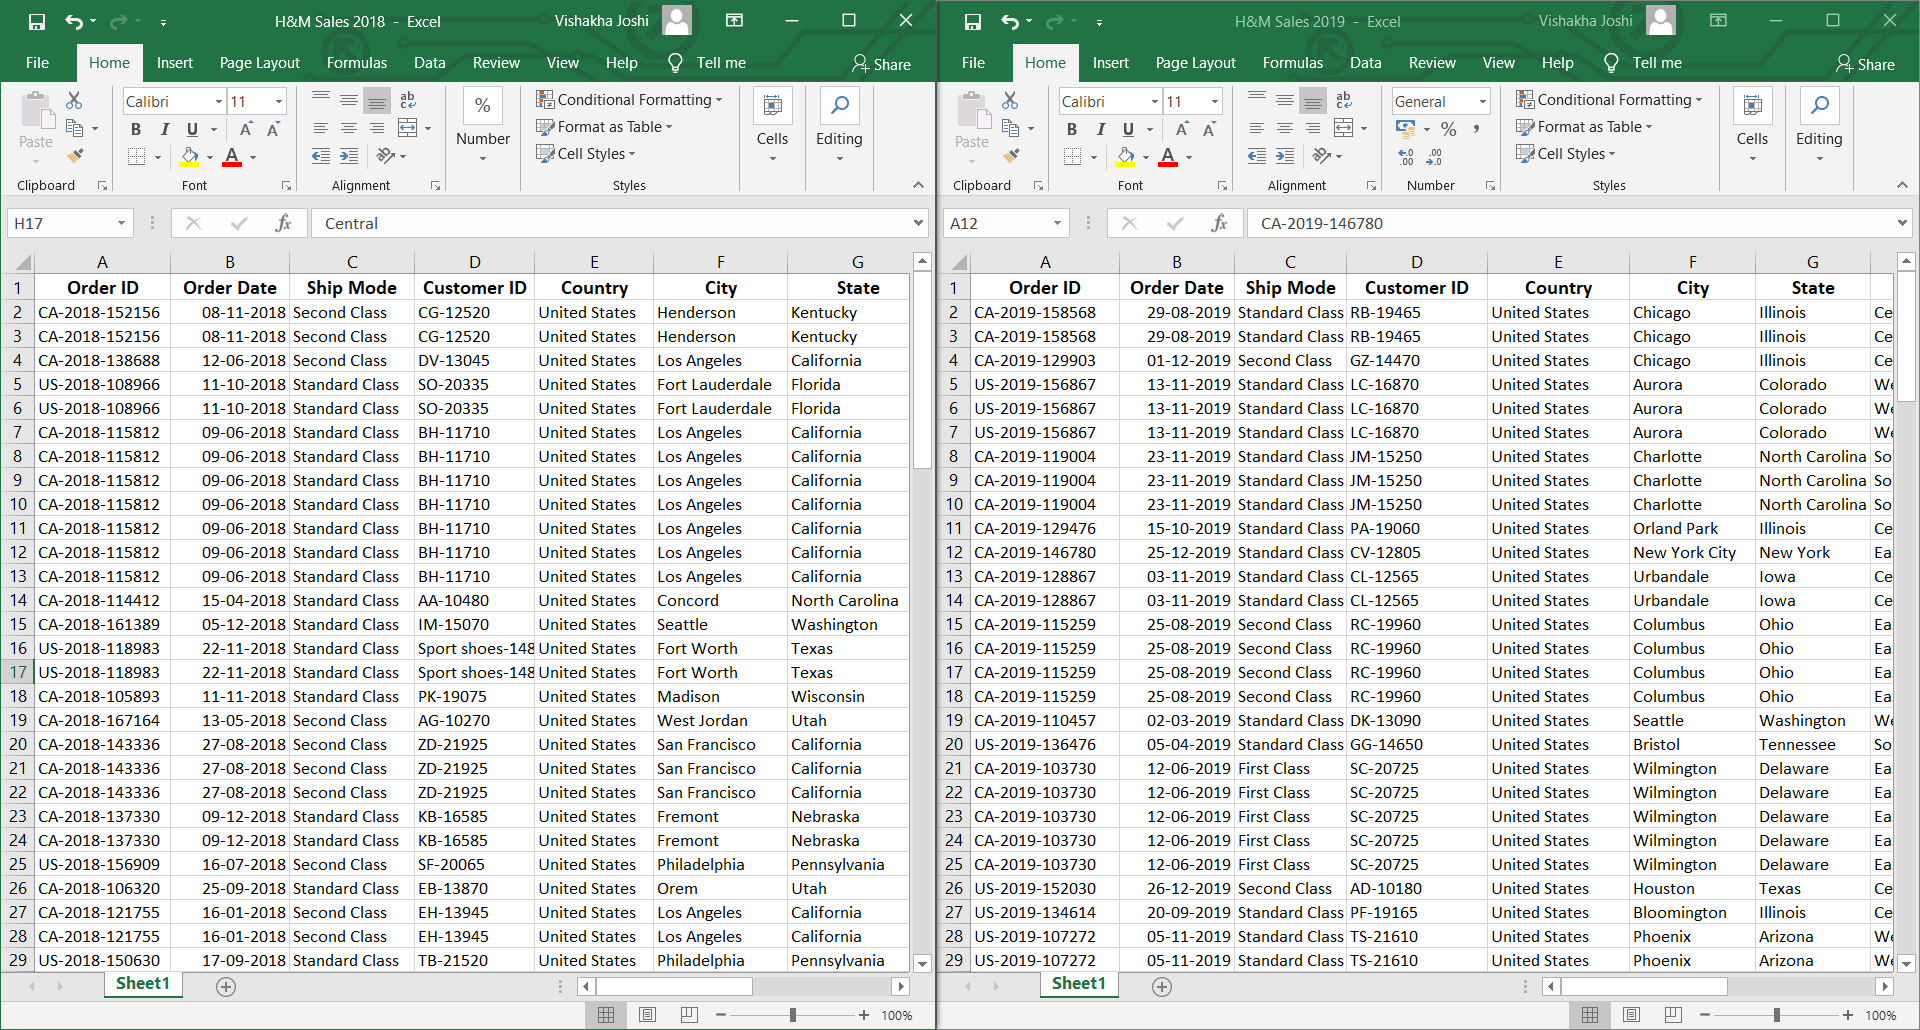
We make separate connections to both the data sets; “H&M Sales 2018” and “H&M sales 2019”.
Now, to see the existing relationship between these two data sets and to make new relationships, we go to Data tab and then select the Edit Relationship option.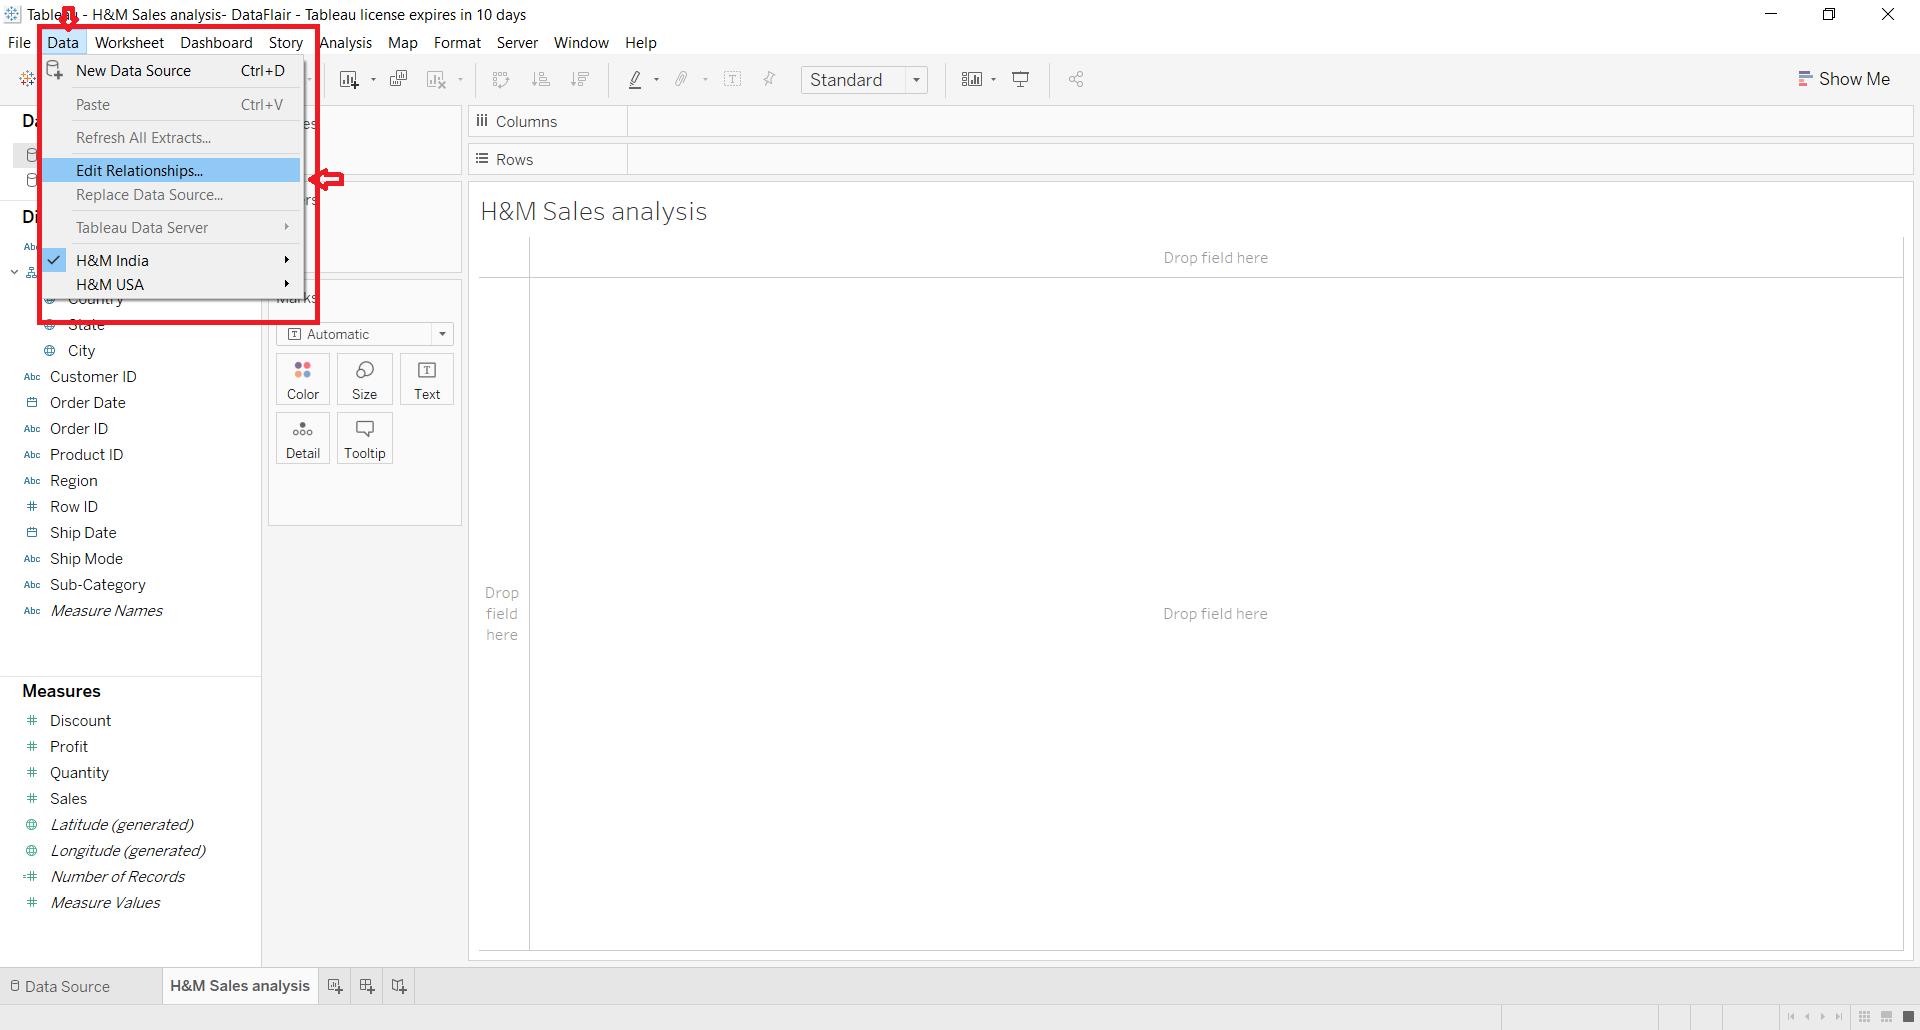
A relationship dialog will open which shows the primary data source, secondary data source and a list of already existing or automatically detected relationships between the fields of the two tables.
You can change the primary and secondary data source from the drop-down list as per your liking. Also, we can change the Automatic option to Custom to make a new relationship.
Now, we will create a relation between the fields Region and Zone from the two tables to state that the constituent data in them is similar (not identical). To do this, we select the Custom option and click on Add.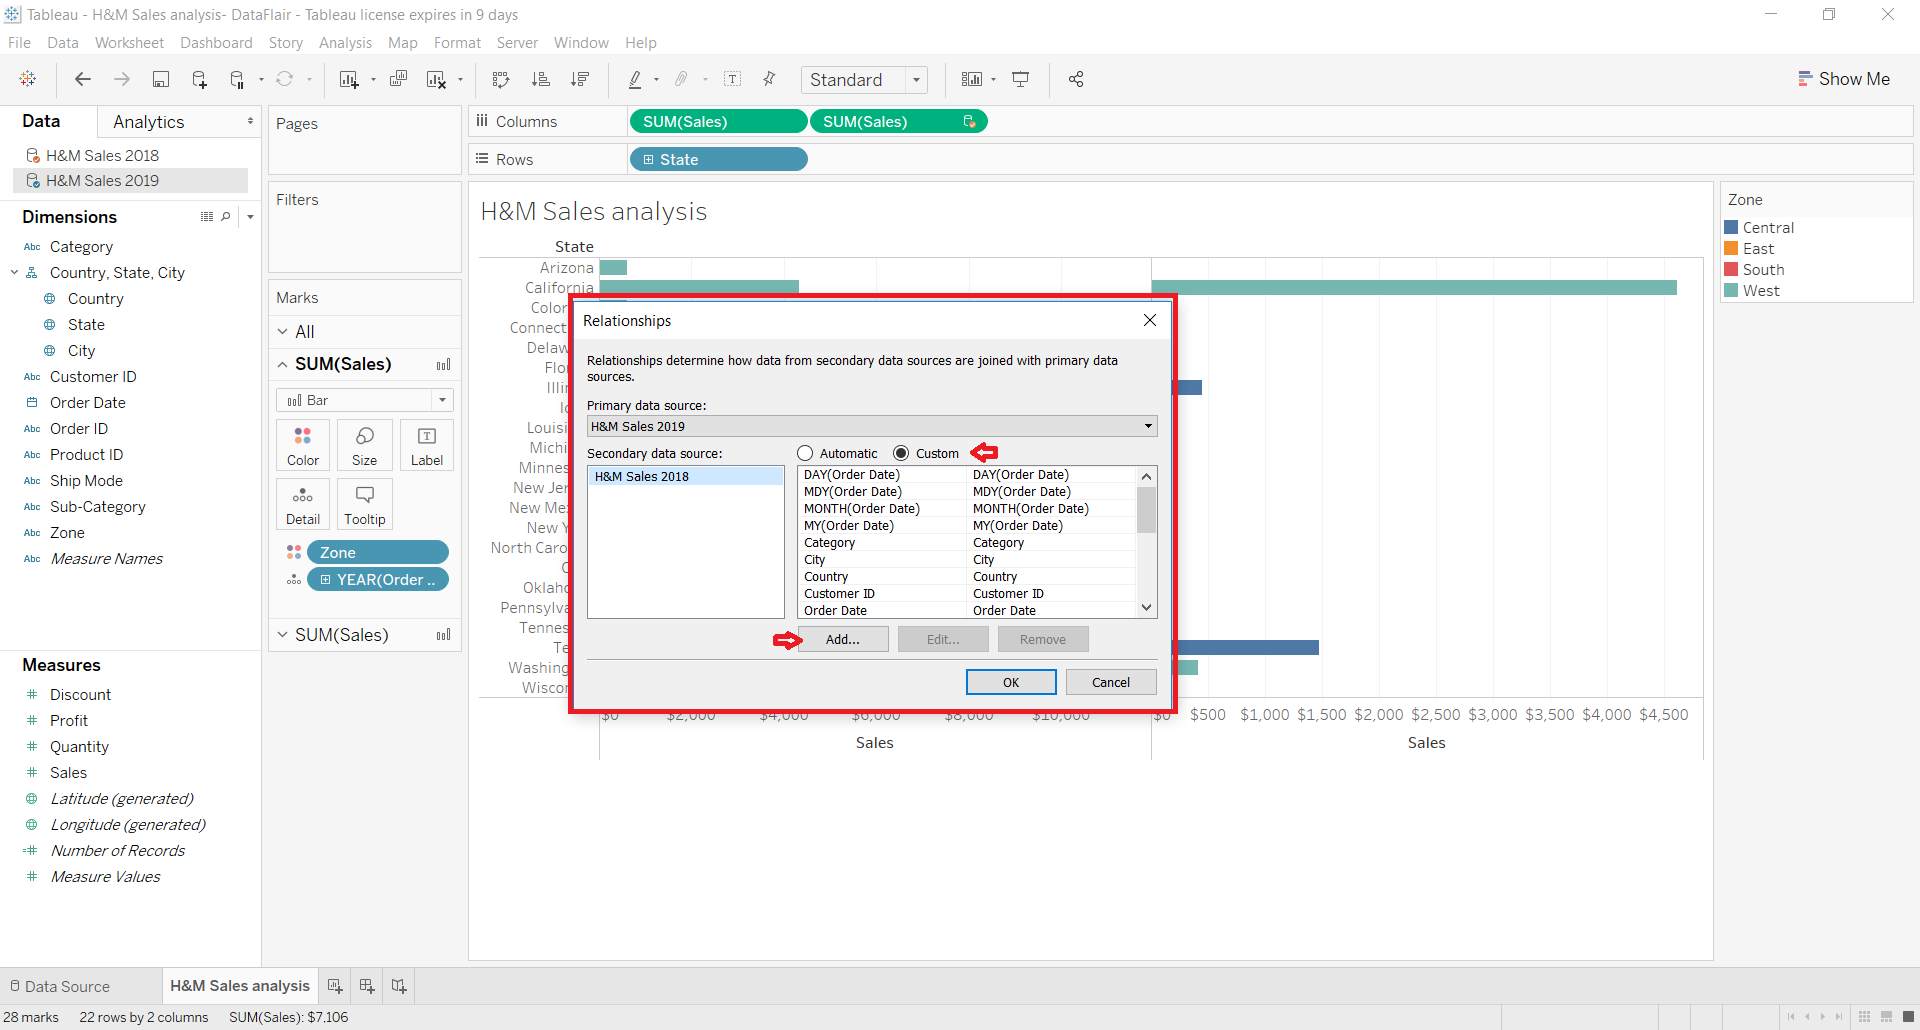
Then a list of fields from both the tables will open. We select Zone and Region from here. Click on OK.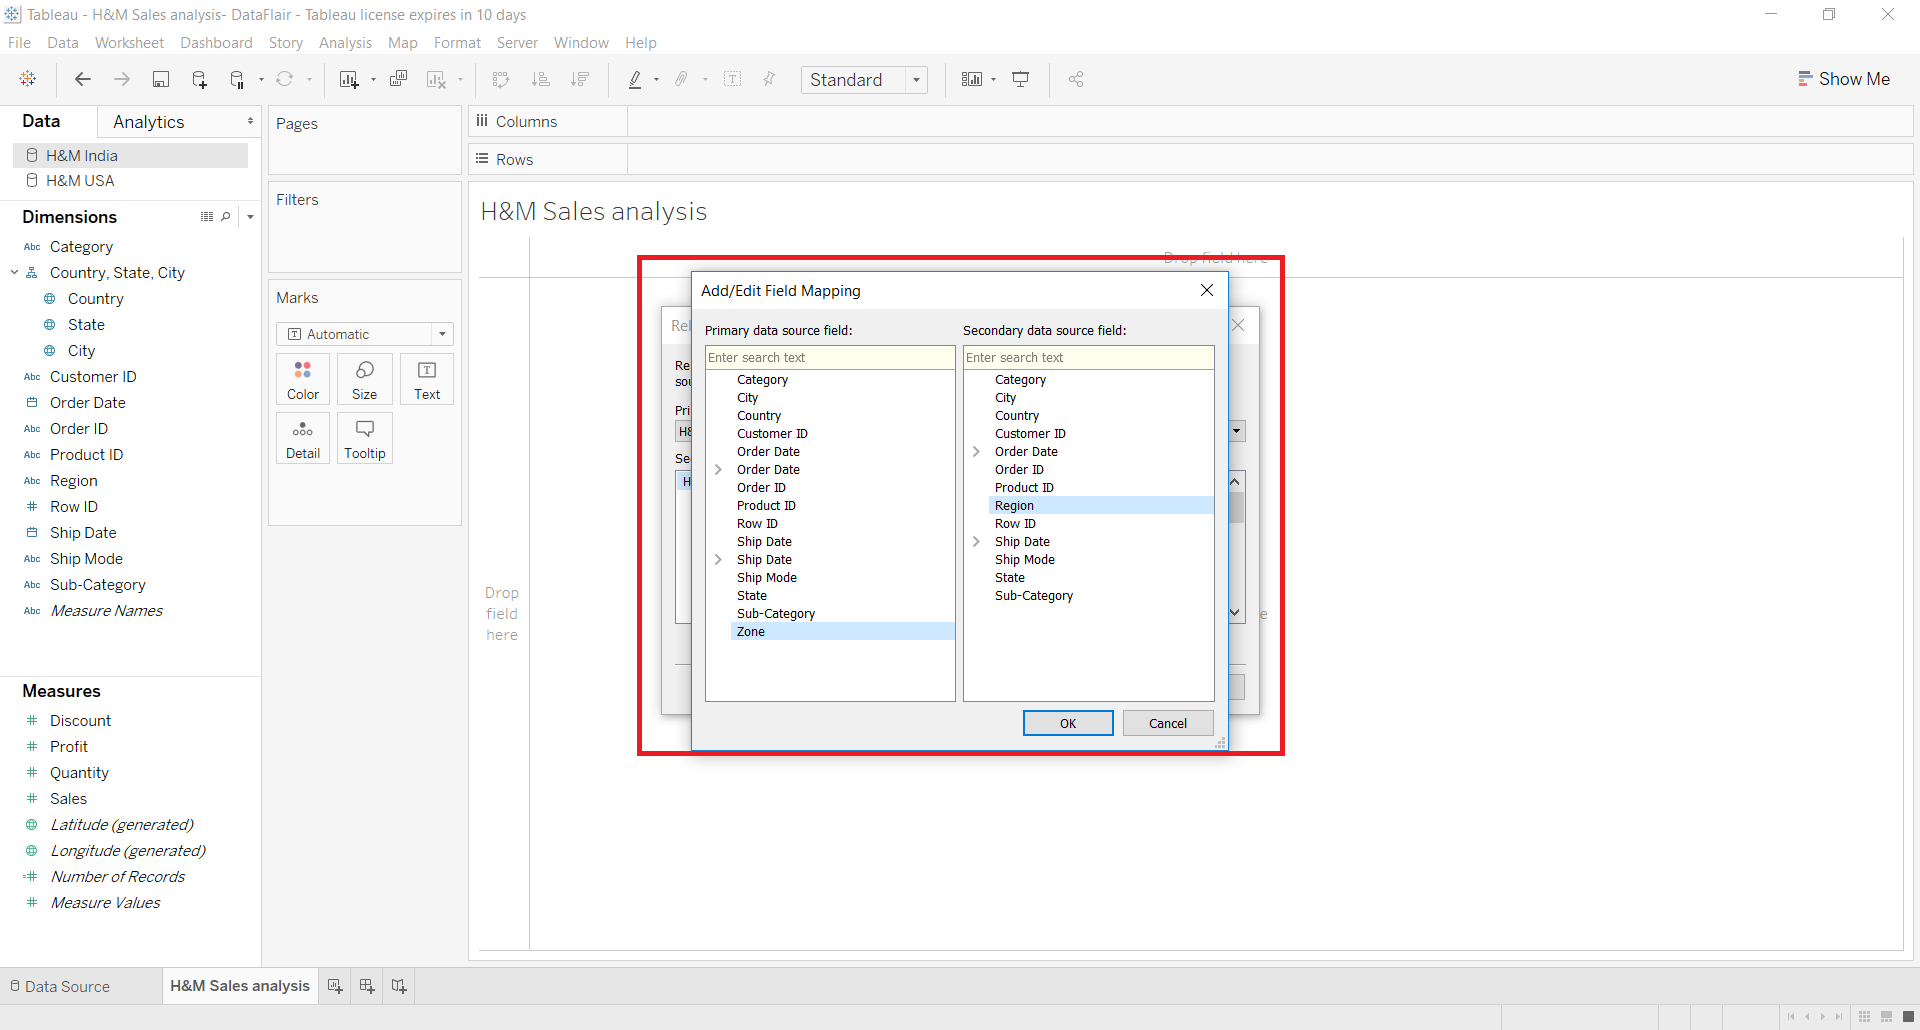
This creates a new relationship between Zone and Region fields. Click on OK to confirm. Please note that this relationship is applied only on the current worksheet and not on other worksheets of a Tableau workbook.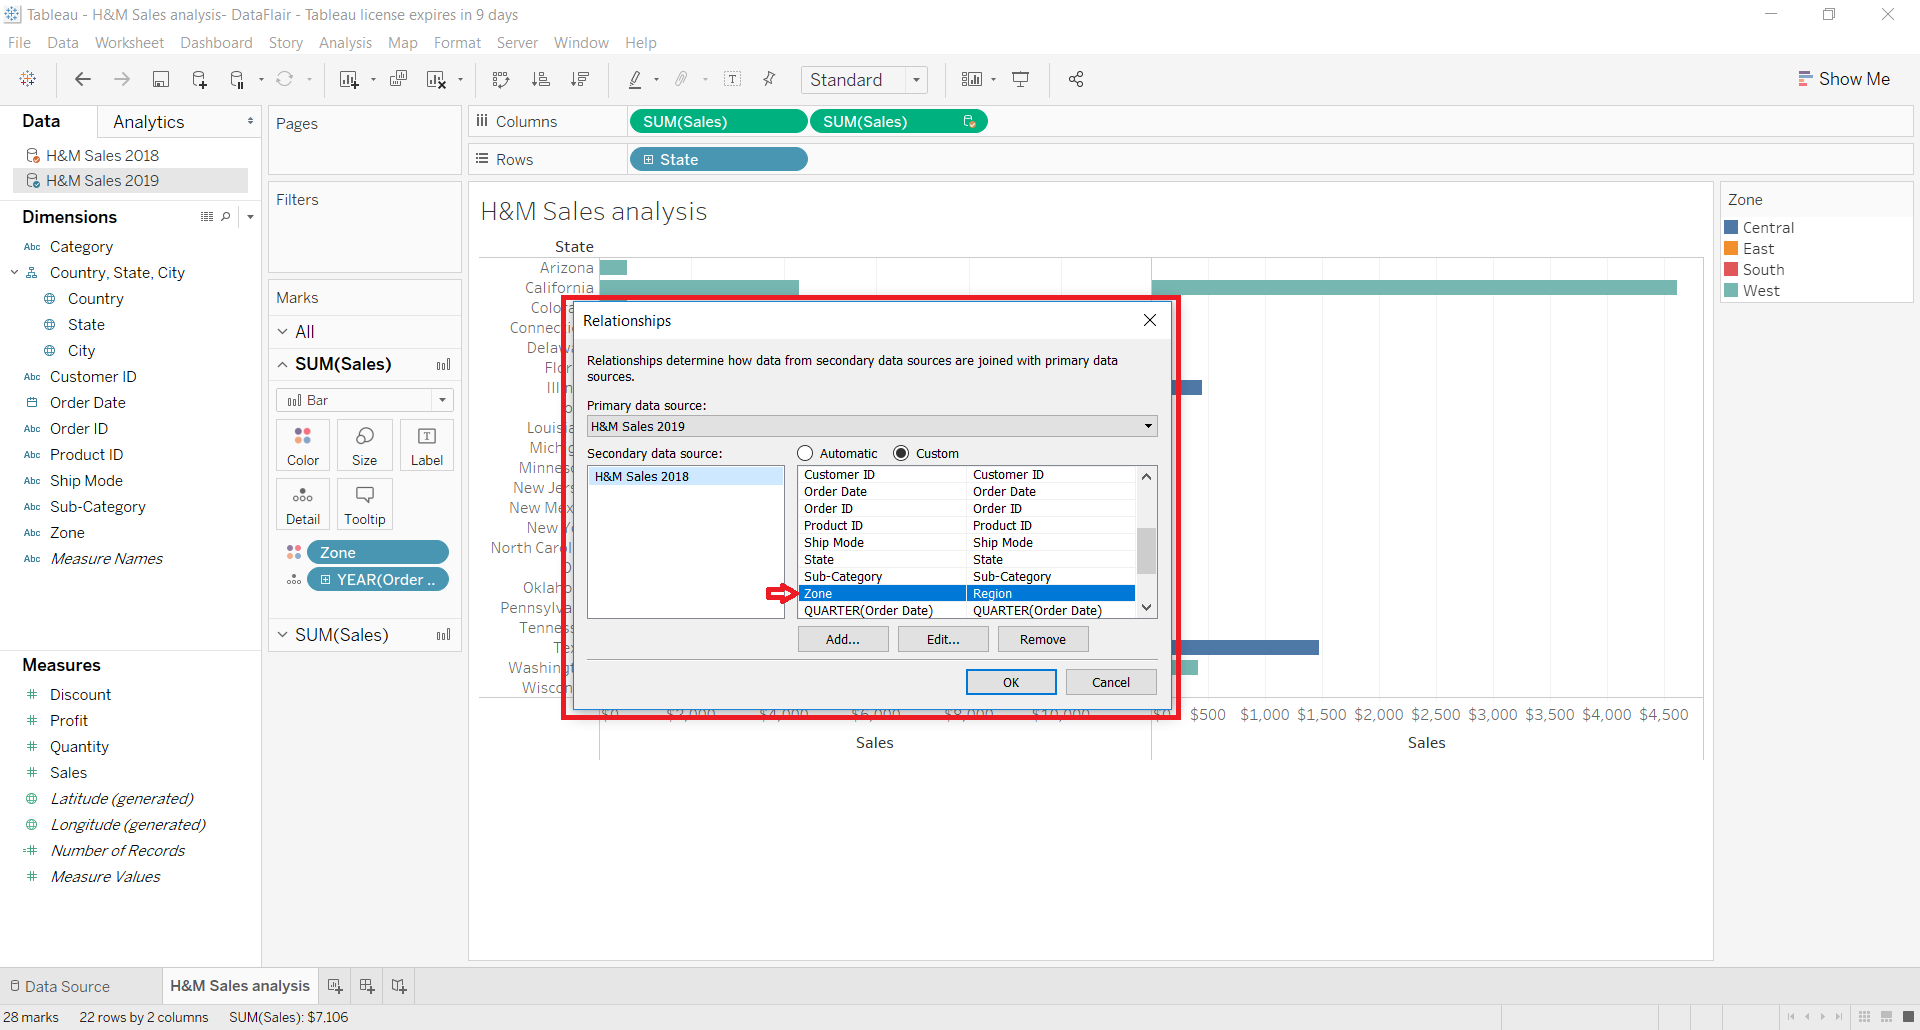
On our worksheet, we have our two data sources which have blue and orange tick marks in front of their names indicating primary (blue) and secondary (orange) data source.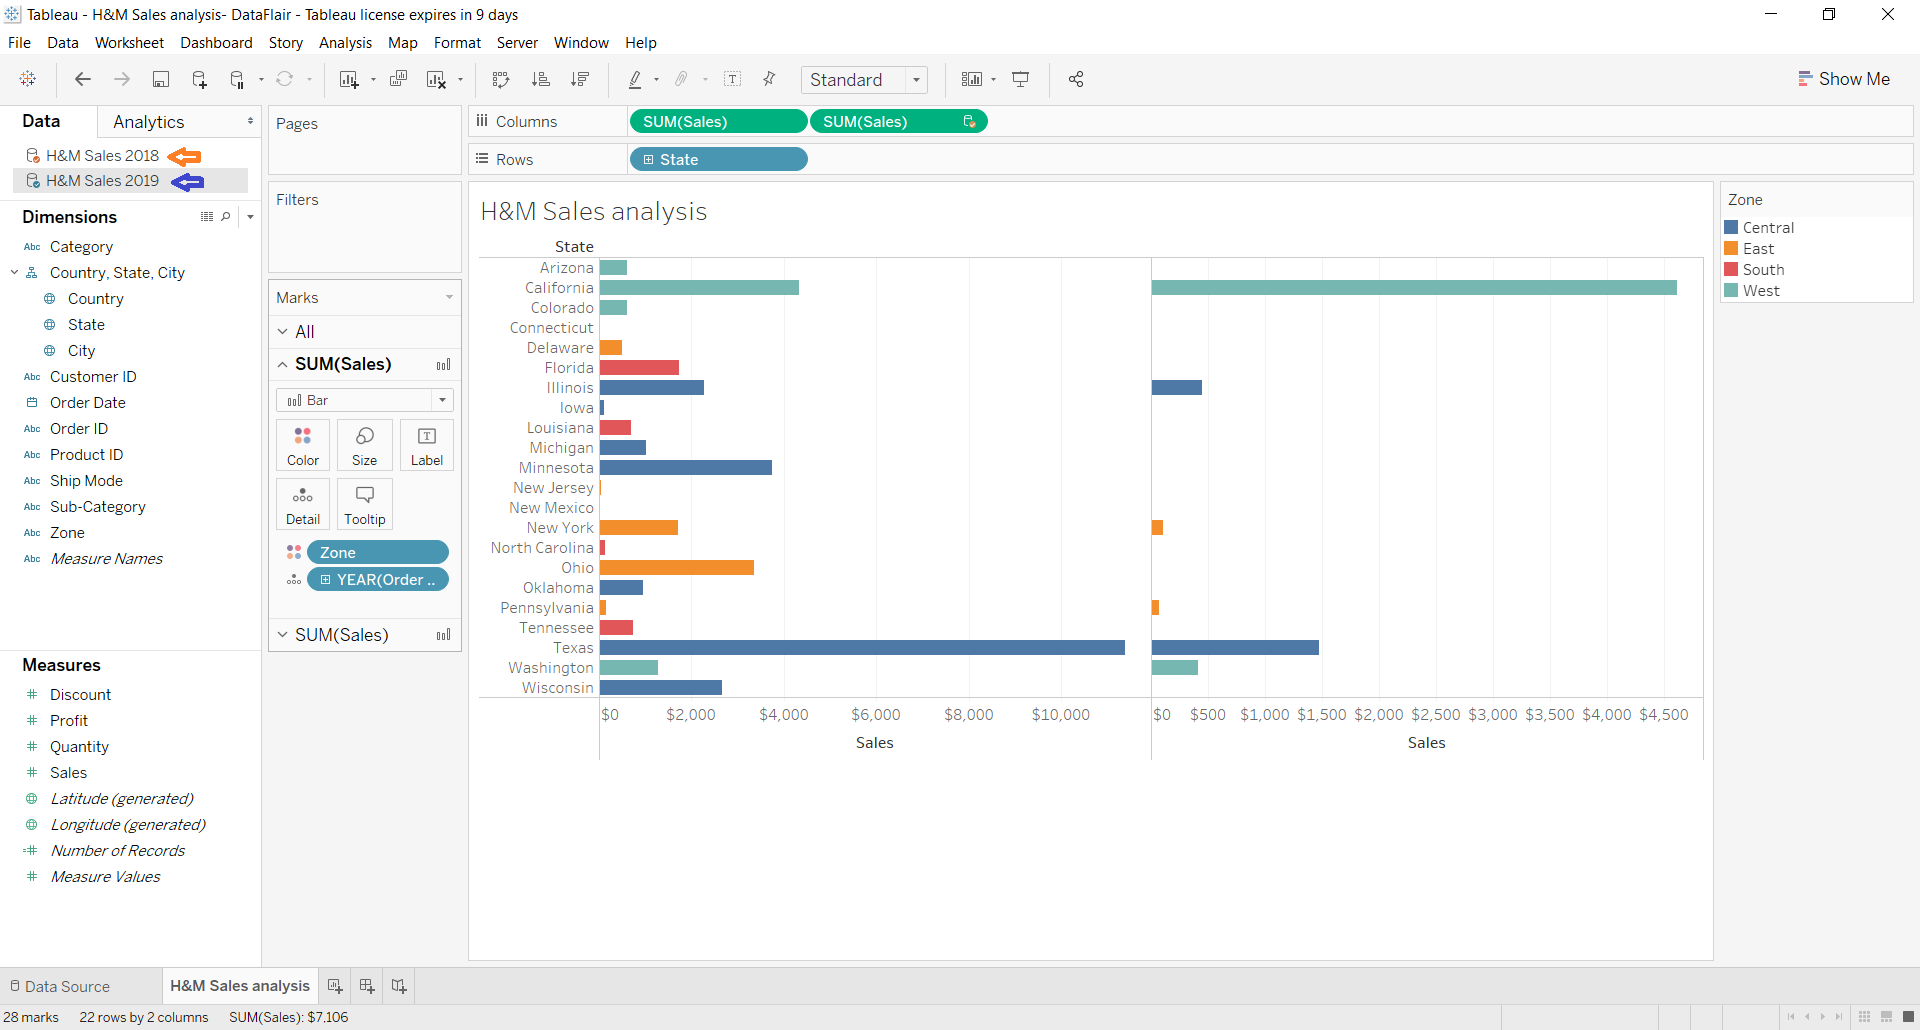
Now, we are ready to use data from these two data sets and start our analysis. You will find a link icon in front of the fields that are linked between both the tables. This means that you can use these fields from the primary data set as a common field because they are linked.
As you can see in the screenshot below, we made a bar graph for total sales in H&M stores in the years 2018 and 2019 (in USA). We were able to get region-wise and state-wise sales data for both the years in one graph because of data blending. Here, we were able to use the Zone field from 2019 sales dataset as a common field between both the tables to provide information on regions.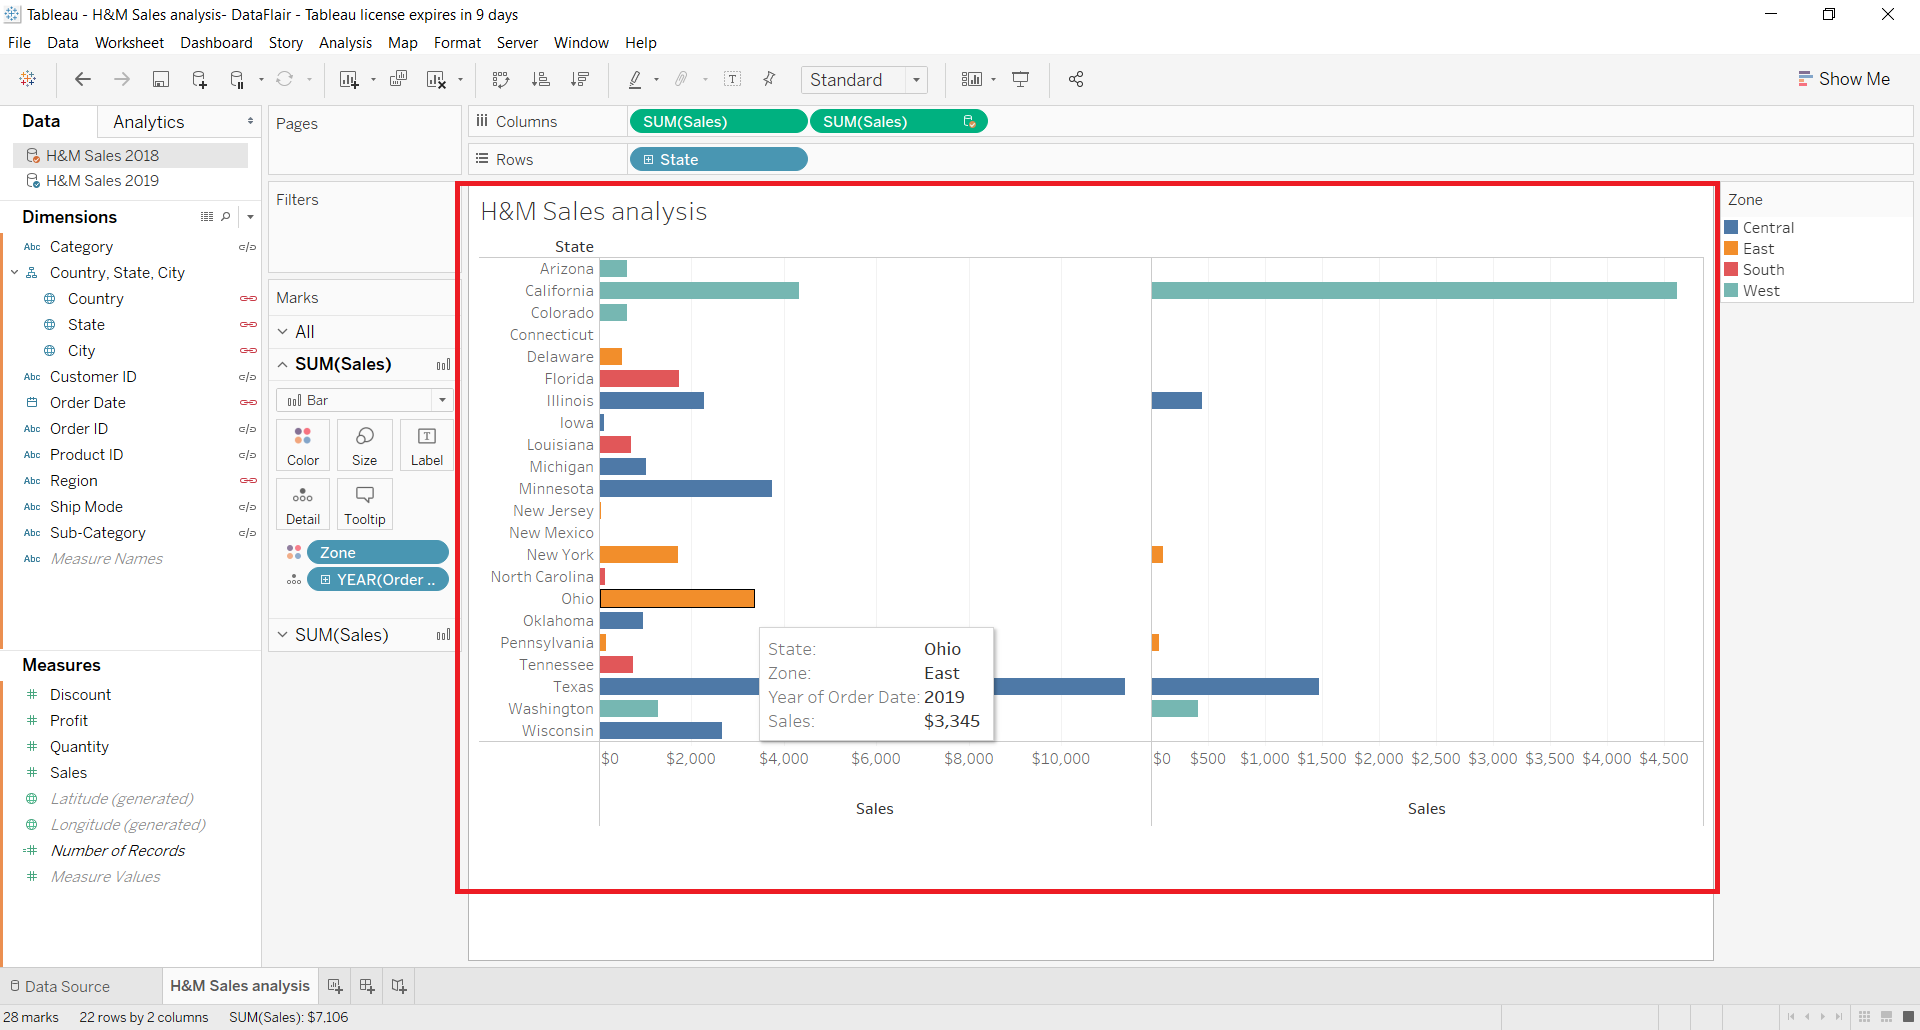
Difference between Data Blending and Join in Tableau
Both data blending and join creates a left join between two data tables. But the main point of difference is when the aggregation takes place. When a join is created, the data is combined first and then aggregated.
Whereas, in blending, data from primary and secondary data sources are queried independently, aggregated, combined and then used for visualization.
Left Join in Tableau
The left join keeps the data of the left table as it is and takes only the matching values from the right table. If in the right table, there is more than one corresponding value for a single value in the left table, then the resultant table will have row entry for every value entry in both the tables.
Also left join first combines the two tables that are joining and then aggregates the data in them.
Have a clearer understanding of left joins by the example shown below.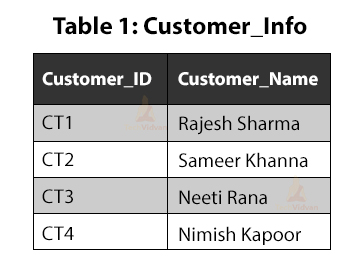
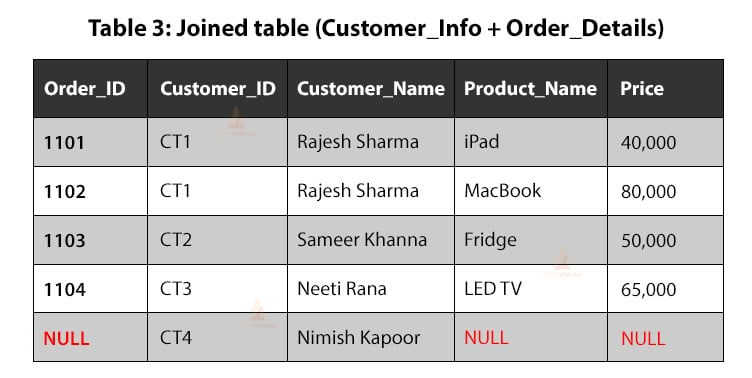
As we can see, in the final table, data values corresponding only to customer IDs CT1 to CT4 are present in the final table. These values were present in the left table and that is why any value that does not correspond to these four customer ID values will not be in the table or have null on those places.
Data Blending in Tableau
The main difference between joining two data tables and blending two data tables is the step at which aggregation of data happens. Like in joining, the tables are first combined and then the data is aggregated, resulting in some duplicating values.
Whereas, in blending, the tables are separate at the database. Then it aggregates the data and sends it to Tableau where it forms a combined table with no duplicated data. It can often happen that the secondary table has more than one corresponding value in its rows to the primary table.
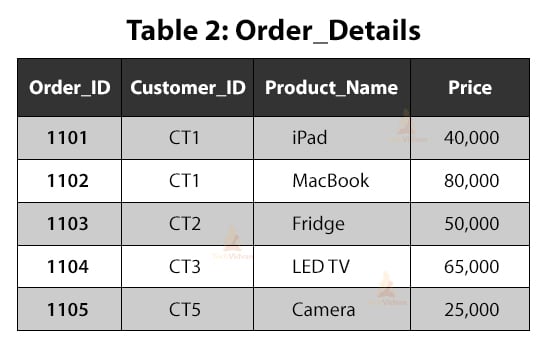
Table 1 is the primary table and Rajesh Sharma has bought two items, that is, iPad and Macbook. In this case, Tableau will show an asterisk (*) in its place ( in product_name column).
If you have more than one numeric value corresponding to primary data fields, then it sums or aggregates the values before displaying them in a table. Like, you can see for the customer Rajesh Sharma, the total price of two items; 40,000 and 80,000 sums up to be 1,20,000.
Also, it will show Null in places where the primary table does not find corresponding values in the secondary table.
When to Blend Data in Tableau?
Data blending feature in Tableau is particularly useful in the following cases;
1. When you cannot use cross-database joins in some specific database that do not support it. For example, Oracle Essbase, Google Analytics (an extract only connection), etc.
Here, you can import or connect to separate data sources in Tableau and then combine them using data blending. This lets you use a combination of data from distinct data sources on a single Tableau worksheet.
2. When your data values exist at different levels of data or have different granularity.
3. When you are using larger data sets. Instead of going with Joins, you can blend the data because Joins combine the data beforehand and then aggregate it for the view which affects the performance when the database is large.
On the contrary, when we blend data, it aggregates the data first and then combines it when required. It saves a lot of computational power in case of large data sets.
Limitations of Data Blending in Tableau
1. We cannot publish a blended data source as a single data source on the server. Instead, we need to publish the two data sources separately on the same server and then blend the published sources.
2. Make your cube data source as the primary data source. (If you are using a cube data source to blend with other sources).
3. It is a must to always aggregate data in calculations from secondary data sources.
4. You might face issues while using non-additive aggregates like MEDIAN, COUNTD, etc when blending data.
Summary
This concludes our lesson on data blending in Tableau. Here, we learned about the basic nature of data blending and how does it work. Also, we had a step by step learning session for applying data blending in a Tableau worksheet.
Lastly, we ventured to answer the question “How is data blending and joins different from each other”. We hope this tutorial helped you in learning Tableau a step further. Stay with us as we bring more interesting tutorials on Tableau.
Time to jump into DataFlair’s types of Tableau Filters article.
Do not forget to share feedback in the comment section.
Did we exceed your expectations?
If Yes, share your valuable feedback on Google


Can you please provide links to the data sets that you have used in your demostrations
Hey Paven,
The data set used in this Tableau Data Blending are taken from Tableau community, you check it here – https://community.tableau.com/servlet/JiveServlet/download/186894-11703/Sample%20-%20Coffee%20Chain.mdb
Hope, it helps you!
This information in relay helpful.. You have given two example of data blending using two table where as data are same. But i failed to understated why 2nd table show as asterisk and the sum(40k+80k). where as first table work like how left join work . I think we have use the same method to to do the data blending for the 2nd example, then why it is show pls explain
Hello Dipankar,
We would, first of all, ask you to go through the article once again as everything is already explained there. Now, coming to your query, in the first instance where a normal left join is happening, the two tables are first combined and then their values are aggregated. In this case, repeating values from the two tables will occur multiple times. Like, for the customer Rajesh Sharma, we have two rows for two different products iPad and MacBook. Whereas, when data blending occurs between two tables, the values from the two tables are first aggregated and then combined. This will cause similar values to aggregate first i.e. the two values for Rajesh Sharma will get aggregated first resulting in a sum showing a total purchase of 1,20,000. Now when these tables will combine, values won’t repeat and there is going to be only one row for the customer Rajesh Sharma. Due to this, there is an asterisk in place of product type as Tableau won’t know which product to enter of the two.
Hope this helps.
It seems that data link that provided earlier expired.
Can you please provide links to the data sets that you have used in your demonstrations again
How to include CT5 in the final table obtained using data blending?
I have the same questions, Did you get any answer Anil?