Tableau Area Chart – A Guide to Create your First Area Chart
Job-ready Online Courses: Dive into Knowledge. Learn More!
In Tableau area chart tutorial, we are going to learn all about an area chart and its use in Tableau. Here, we will start by learning some basics about an area chart and then go into a stepwise process of learning how to create an area chart in Tableau. So, open a blank worksheet on your Tableau software and create your very first area chart with us.
Before reading further I recommend you to explore the steps for creating a tableau bar chart.
What is Tableau Area Chart?
Area charts in Tableau show relationships between different aspects or dimensions in a data set. This relationship is shown as the proportion of totals or percentage of certain data values. The comparison between different dimensions and values can be made by analyzing the area under each line and how does it vary with time.
There are two types of area charts in Tableau; Continuous Area Chart and Discrete Area Chart. A continuous area chart does not have individual values and hence is always measured. On the other hand, in a discrete area chart, individual values of a category are taken and hence are always counted.
Before we start creating the area chart, make sure you have the basic requirements in your data source as given below.
- Mark type – Area
- Columns shelf – Dimension
- Rows shelf – Measure
- Color – Dimension
- Detail – Dimension (optional)
How to Create a Tableau Area Chart?
Let us learn here how to create an area chart in Tableau Desktop. Open Tableau Desktop in your system and follow the steps given below to create a Tableau area chart. Make sure that you have already set a connection with your preferred data source.
Step 1: Open Visualization Pane in Tableau
Open a new sheet in a Tableau workbook. Here, on the left side, you’ll find a list of the dimensions and measures from the connected data source. At the right-most side, we have a visualization pane. You can hide or show this pane by clicking on the Show Me option. In this pane, you’ll find two options for area charts that is Area charts (Continuous) and Area charts (Discrete).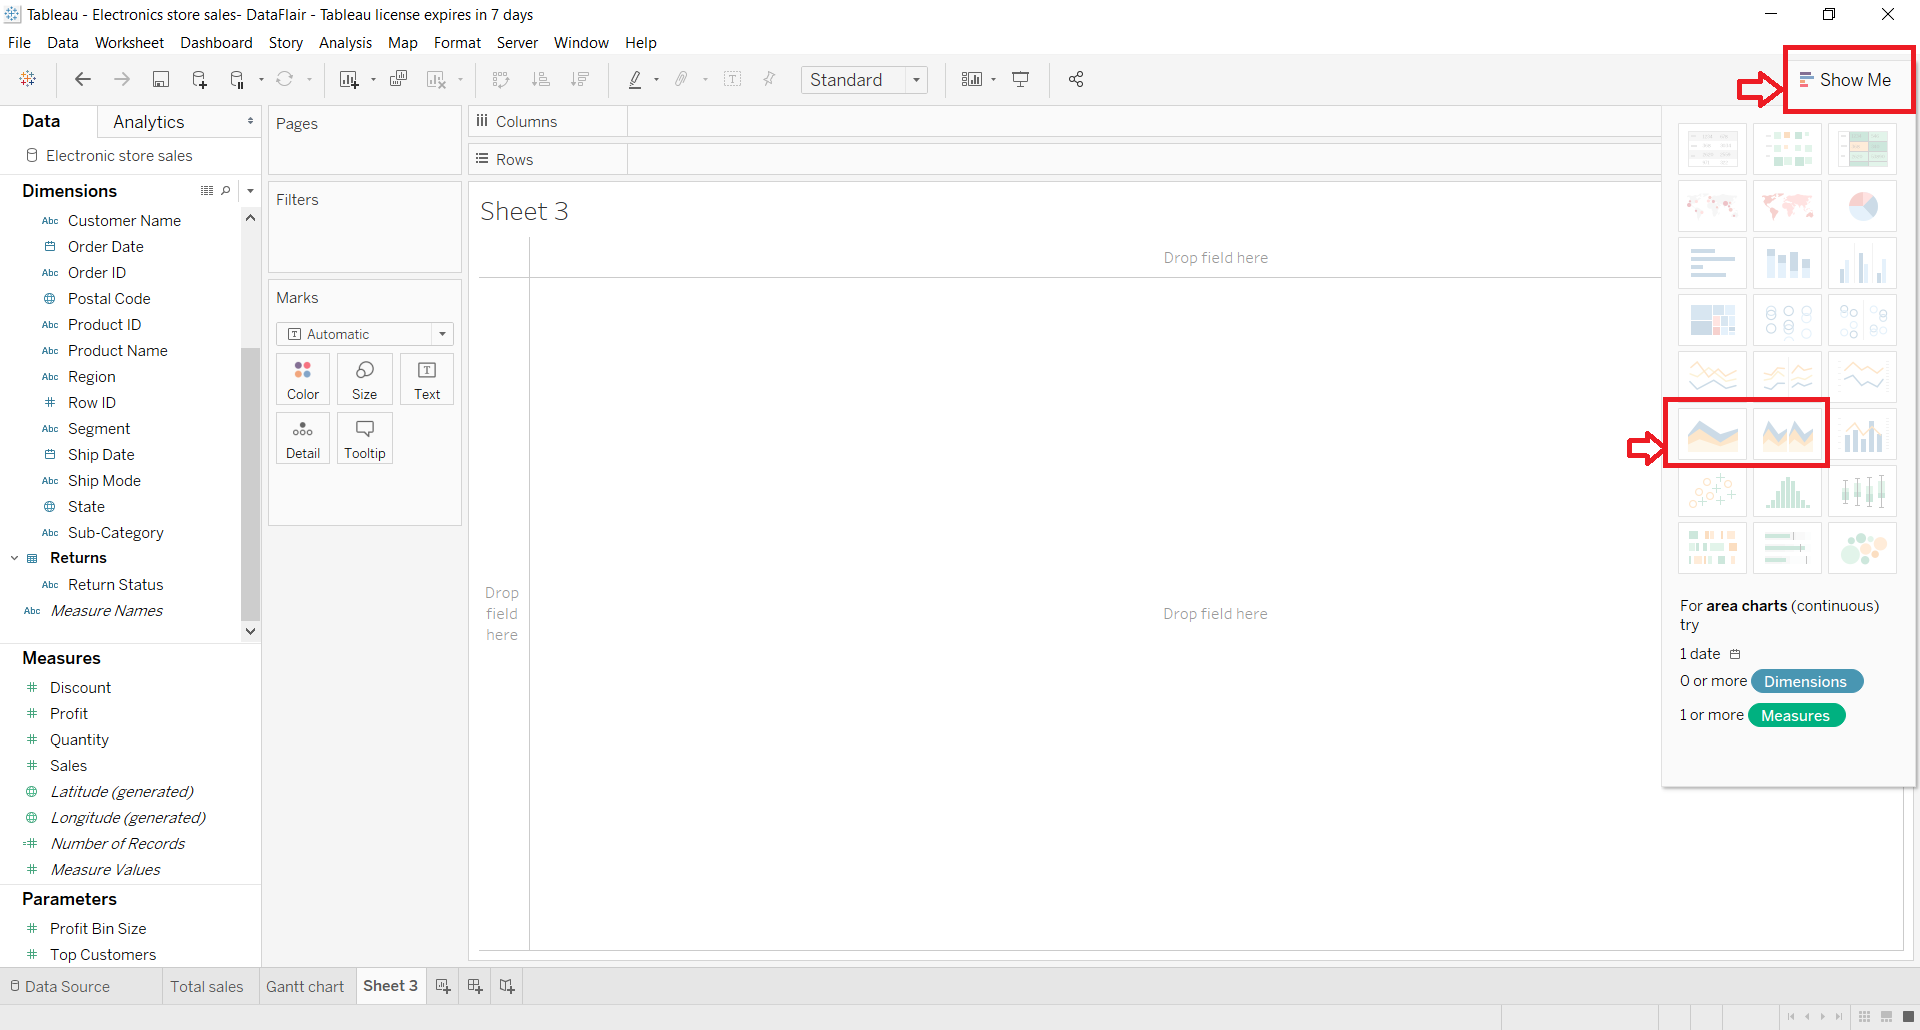
Step 2: Select Area Chart in Visualization Pane
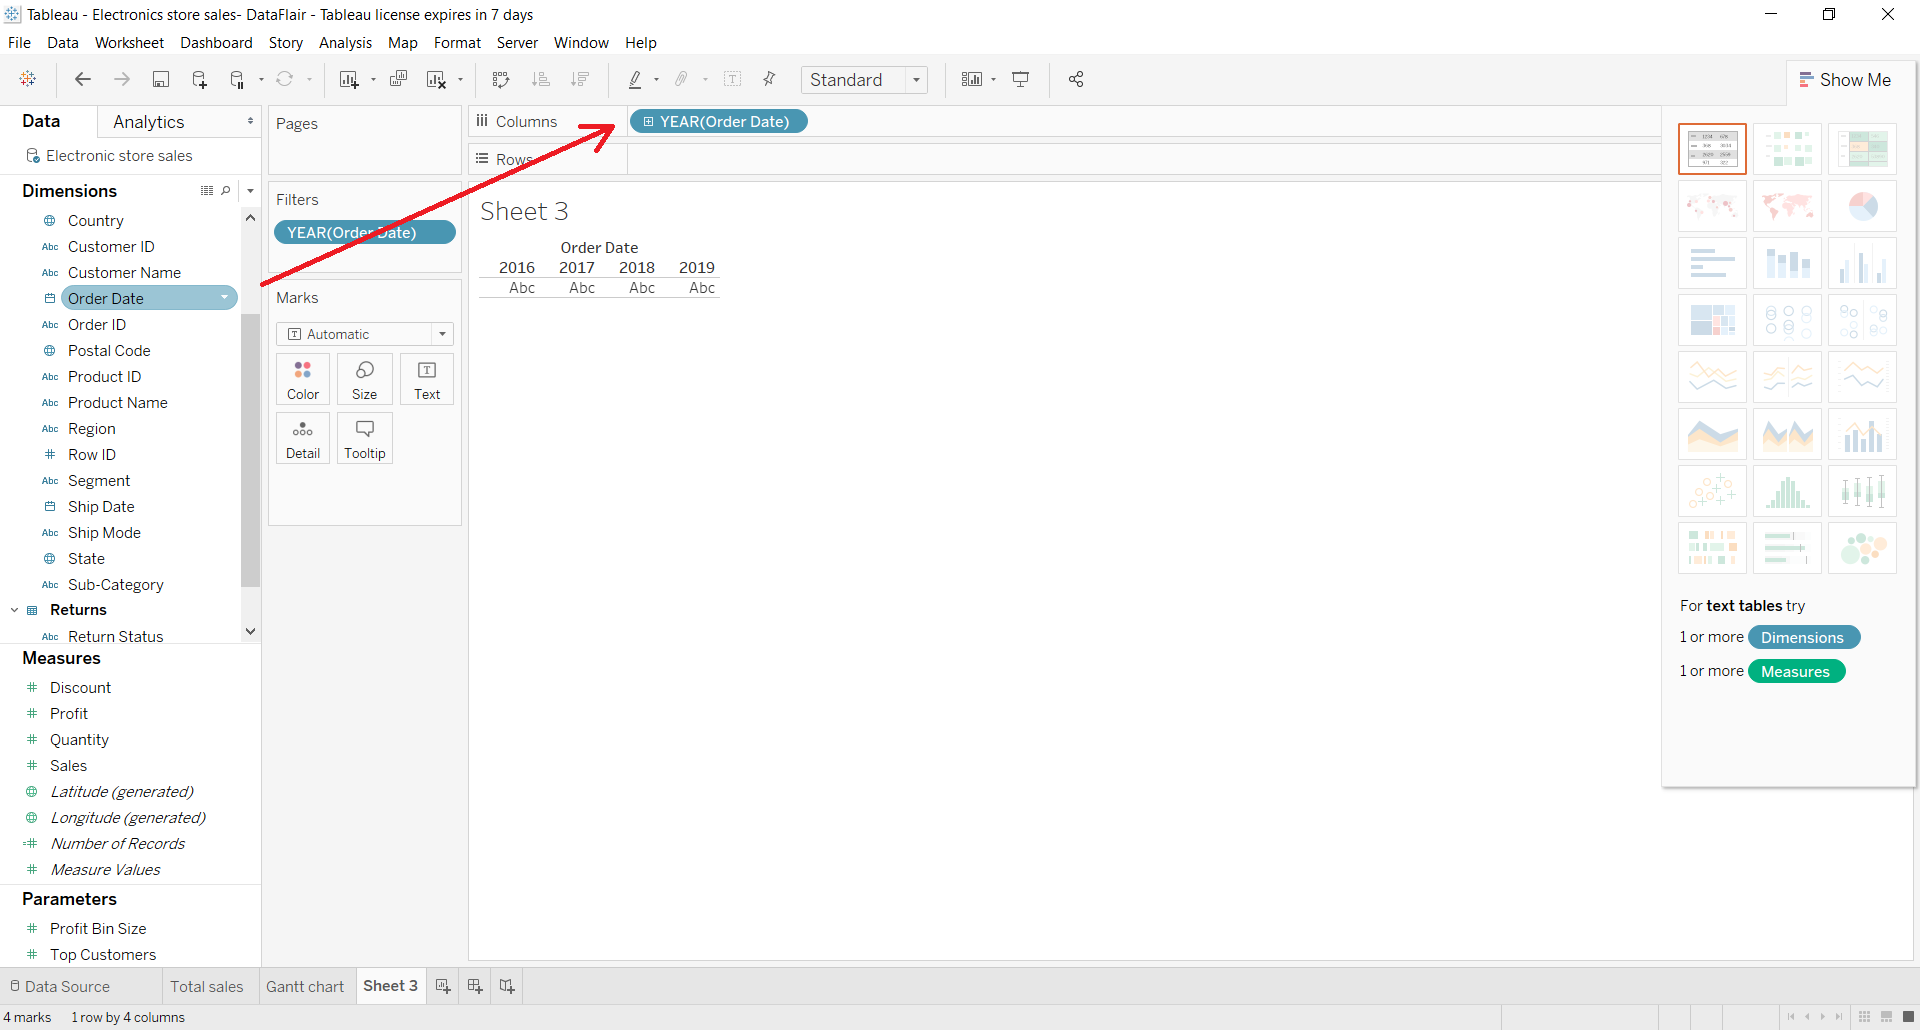
As we know, Tableau recommends using a date field for making an area chart. So, we start by dragging a date dimension to the Columns section. Go to the visualization pane and select Area charts (Continuous) option in case it is not selected.
Step 3: Add Measure
Next, we’ll drag and add one measure (Sales) to the Rows section.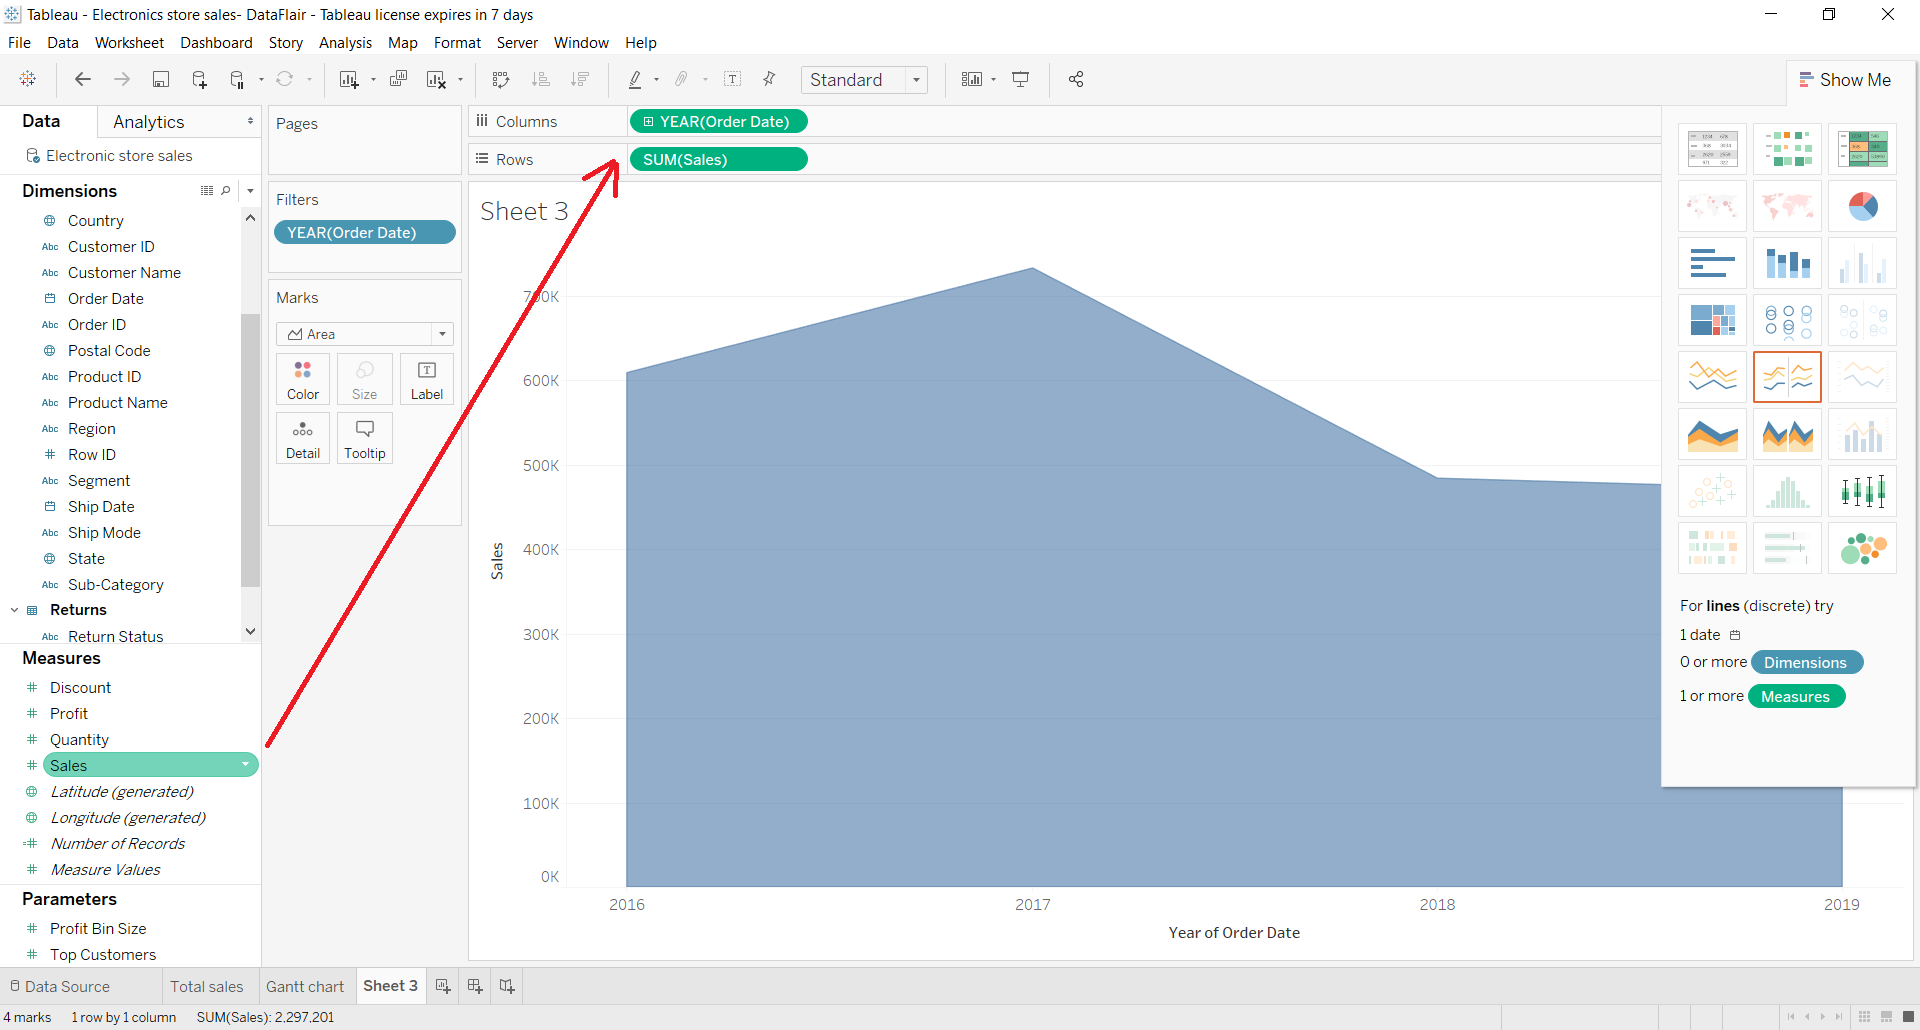
Step 4: Add Dimensions to the Colors Box
Now, we’ll add one more dimension (Category) to the Colors box of the Marks pane. This will add category-wise colors into the chart and represent each category with distinct colors.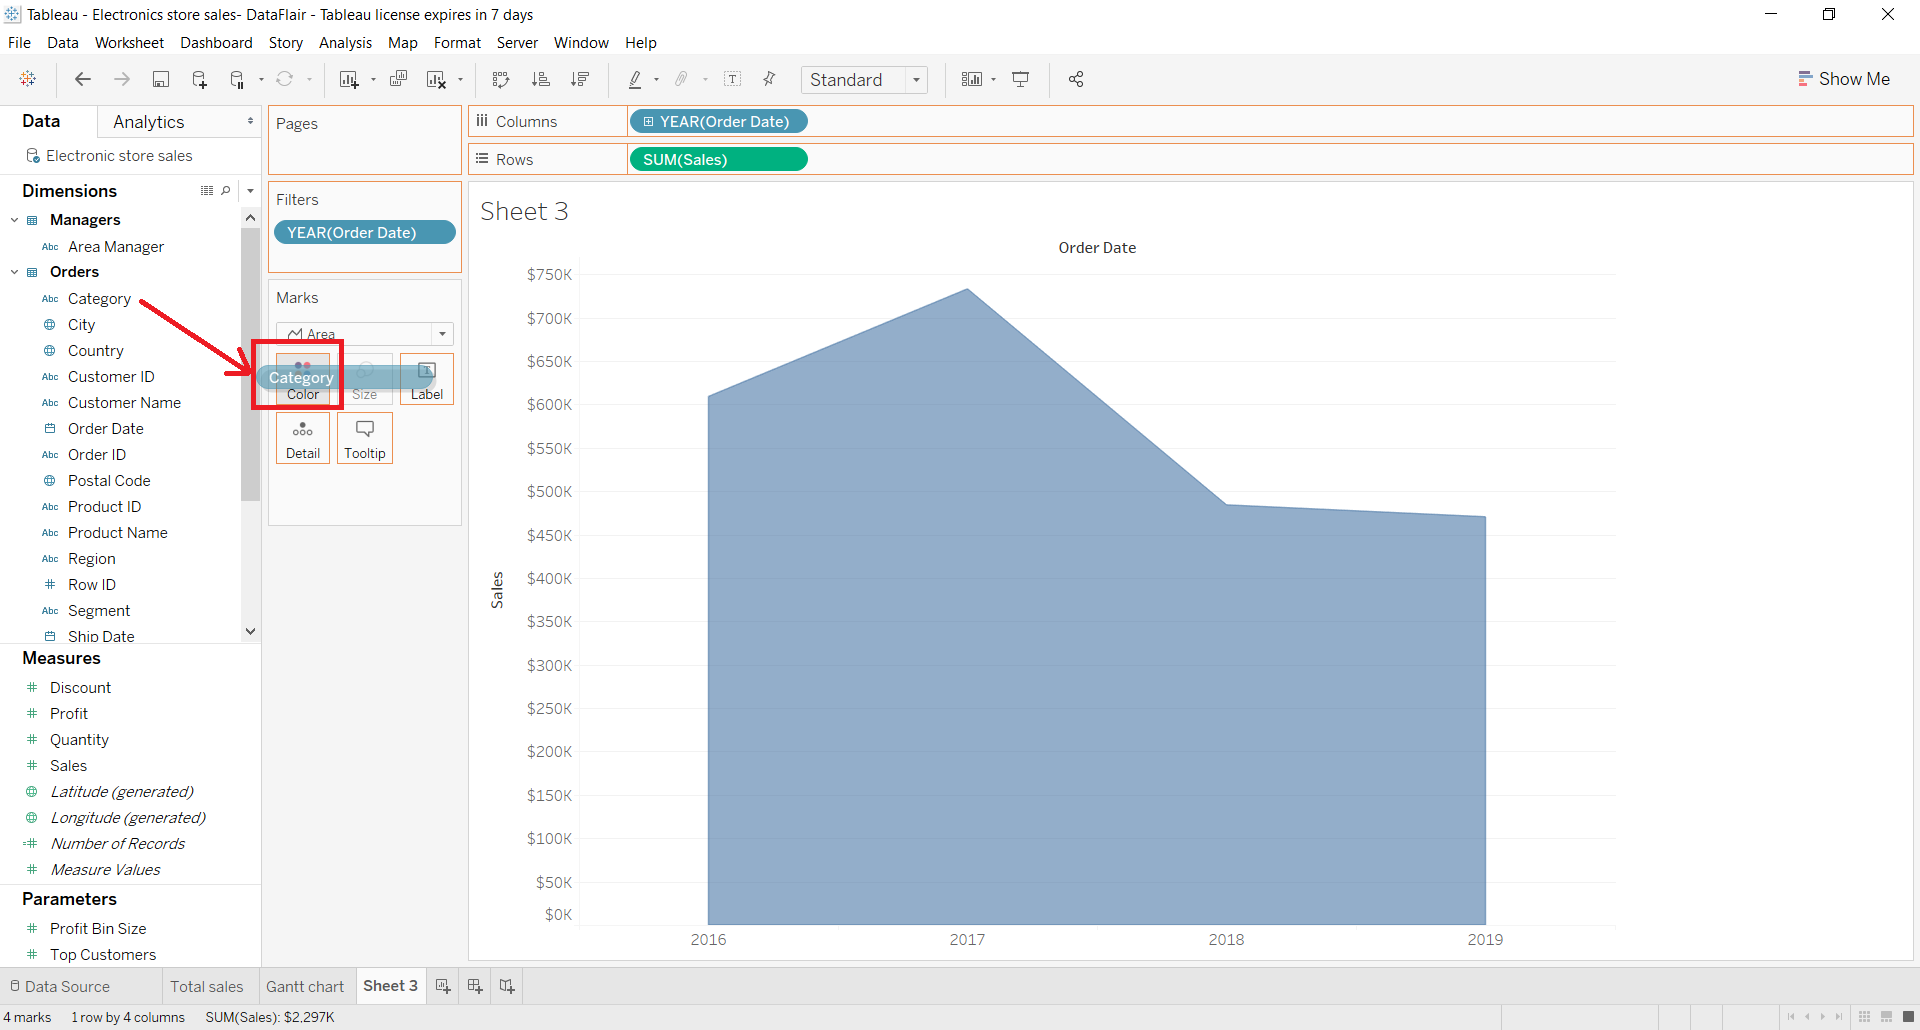
Step 5: Basic Area Chart Creation
This creates a basic area chart where the chart is divided into three color zones of three categories which are Cameras, Laptops, and Mobile Phones. The x-axis or column axis shows four years that is 2016 to 2019. Whereas, the y-axis or row axis shows the scale for total sales.
This area chart shows the total sales for three categories of products indicated by blue (Cameras), yellow (Laptops) and red (Mobile Phones) over a period of four years.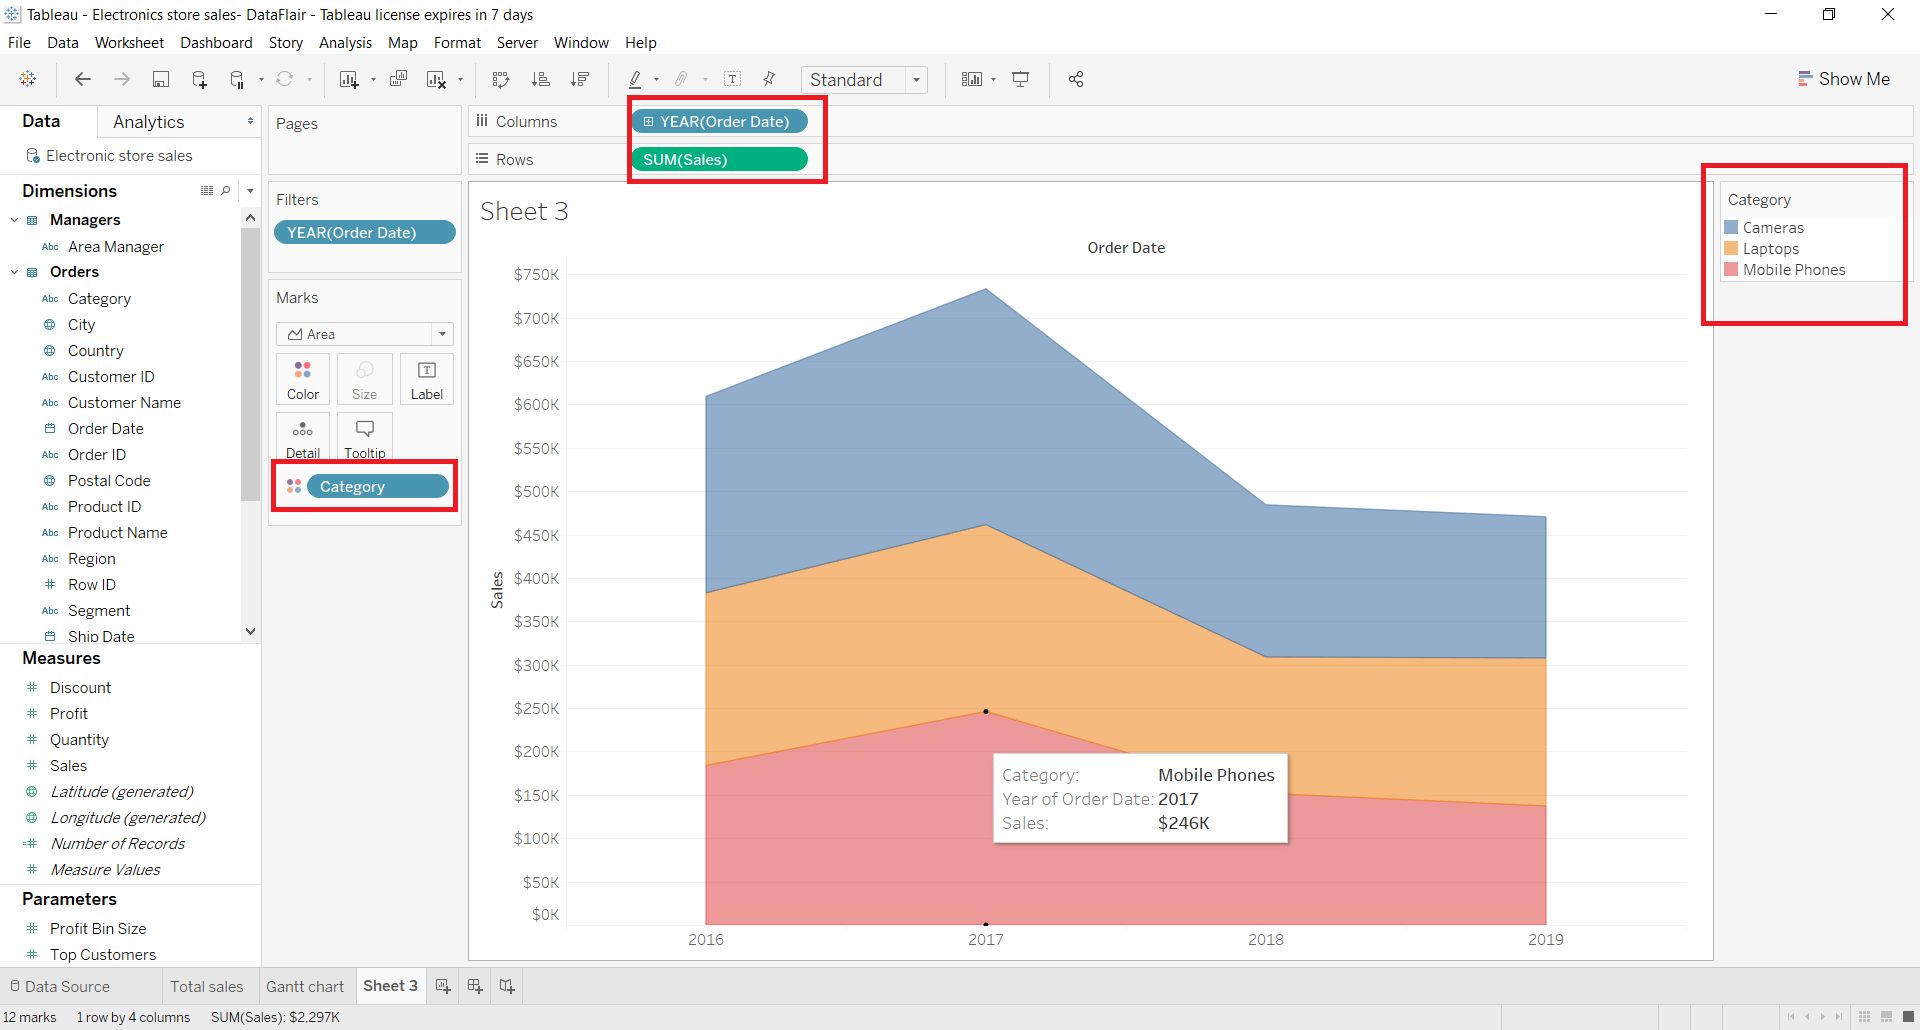
Step 6: Make Basic Area Chart more Detailed One
We can also make this simple area chart in Tableau a more detailed one by adding another dimension (Sub-category) into the Details box in Marks pane. This will add thin lines of sub-category items like OnePlus, iPhone, Samsung, etc. in the category of Mobile Phones to give a detailed visual representation of sales data. Hover your cursor on the area segments to read the details pertaining to it.
Step 7: View Discrete Area Chart
Now, let us also have a look at how does the other type of area chart that is, the discrete area chart. For this, we go to the visualization pane again and select the Area charts (discrete) option.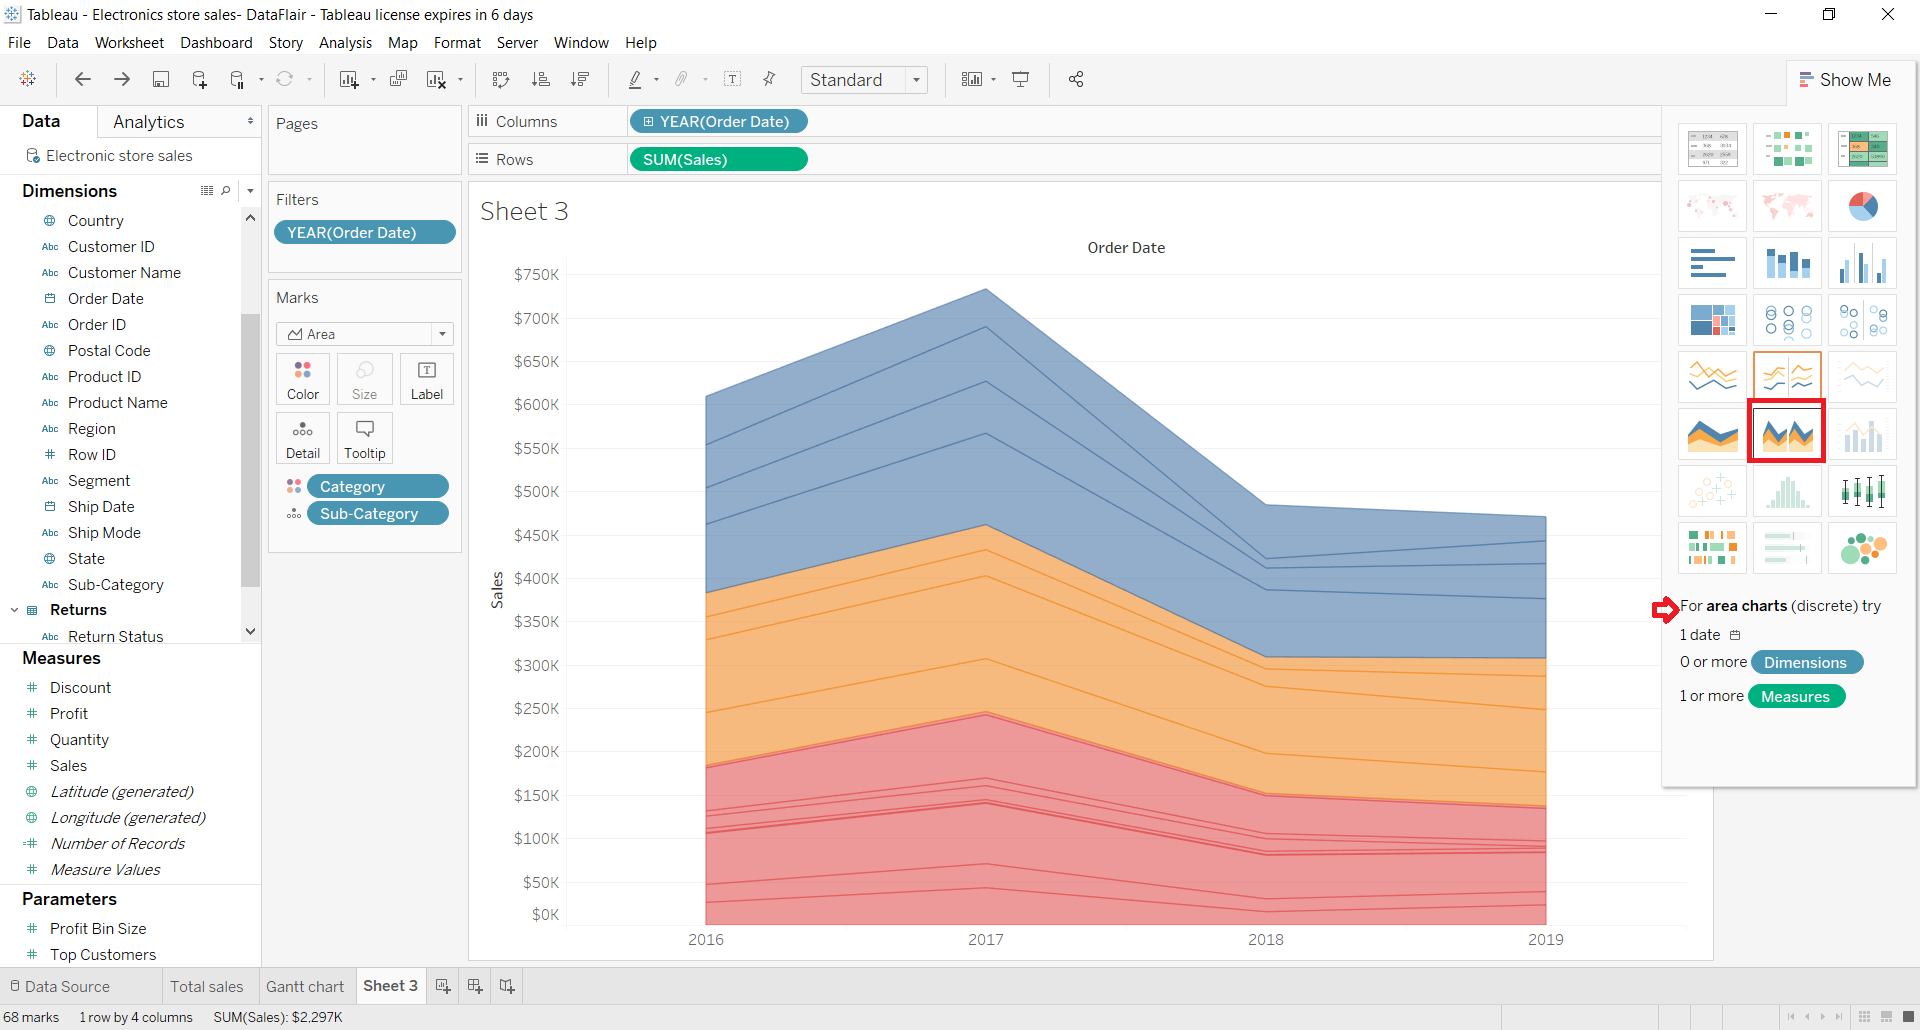
Step 8: Conversion of Continuous Area Chart into Discrete Area Chart
This will instantly change out the continuous type area chart into a discrete type. As you can see in the screenshot attached below, the discrete area chart divides the chart space into three sections and show separate charts for the three categories.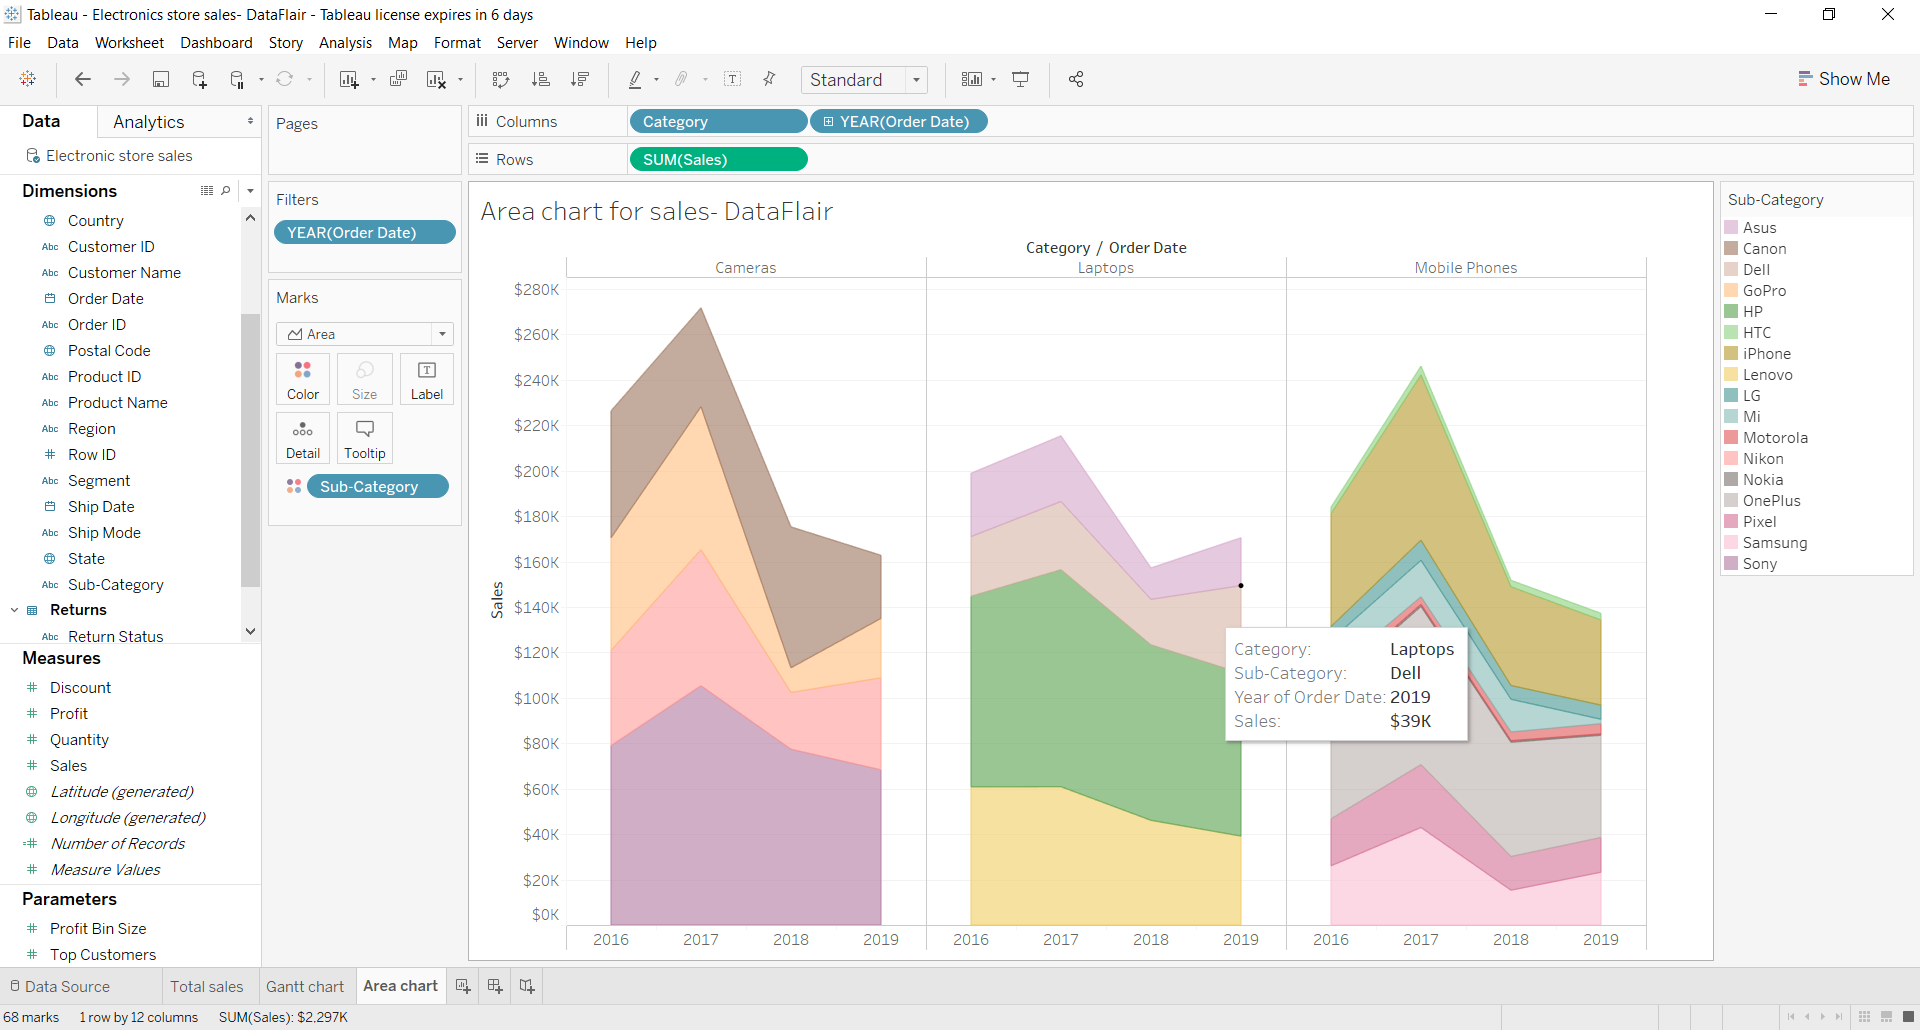
Summary
In this tutorial, we learned the process of creating a Tableau area chart. We hope understand the process in easy manner.
Check out the steps of creating a stacked bar chart in tableau with examples.
Do share your rating on Google if you liked the article.
Happy Learning😃
Your opinion matters
Please write your valuable feedback about DataFlair on Google


