Tableau Bins – Create Bins in Tableau with just 3 Steps!
Job-ready Online Courses: Click for Success - Start Now!
Our next topic in the DataFlair’s Tableau tutorial series is Tableau Bins. Here, we provide you with the basic concept of Tableau bins and how can we create and use them for our analysis in Tableau. Bins are a really useful tool in many data analysis scenarios while working in Tableau. So, let’s begin our tutorial by understanding the basic definition of Tableau Bins!
What are Bins in Tableau?
Tableau bins are containers of equal size that store data values corresponding to or fitting in bin size. Also, we can say that bins group a set of data into groups of equal interval or size making it a systematic distribution of data.
In Tableau, data from any discrete field can be taken to create bins. Although, Tableau users mostly use measure fields to create numeric bins. Bins are very useful in data analysis as they provide a systematic data range that helps us organize information better and discover patterns easily.
Please note that we cannot use bins in calculations and we can only create bins from relational databases. Also, when we create bins from measure fields, Tableau saves it as a new field because the bin contains data values in a different form than the original measure field.
For instance, if we want to plot a graph showing sales against a range of ages from 15 to 80. Using the bin functionality, we can create bins for age groups and analyze sales for each age group. Bins are most useful while creating histograms in Tableau.
How to Create Bins in Tableau?
Follow the steps given below to create bins in your Tableau worksheet:
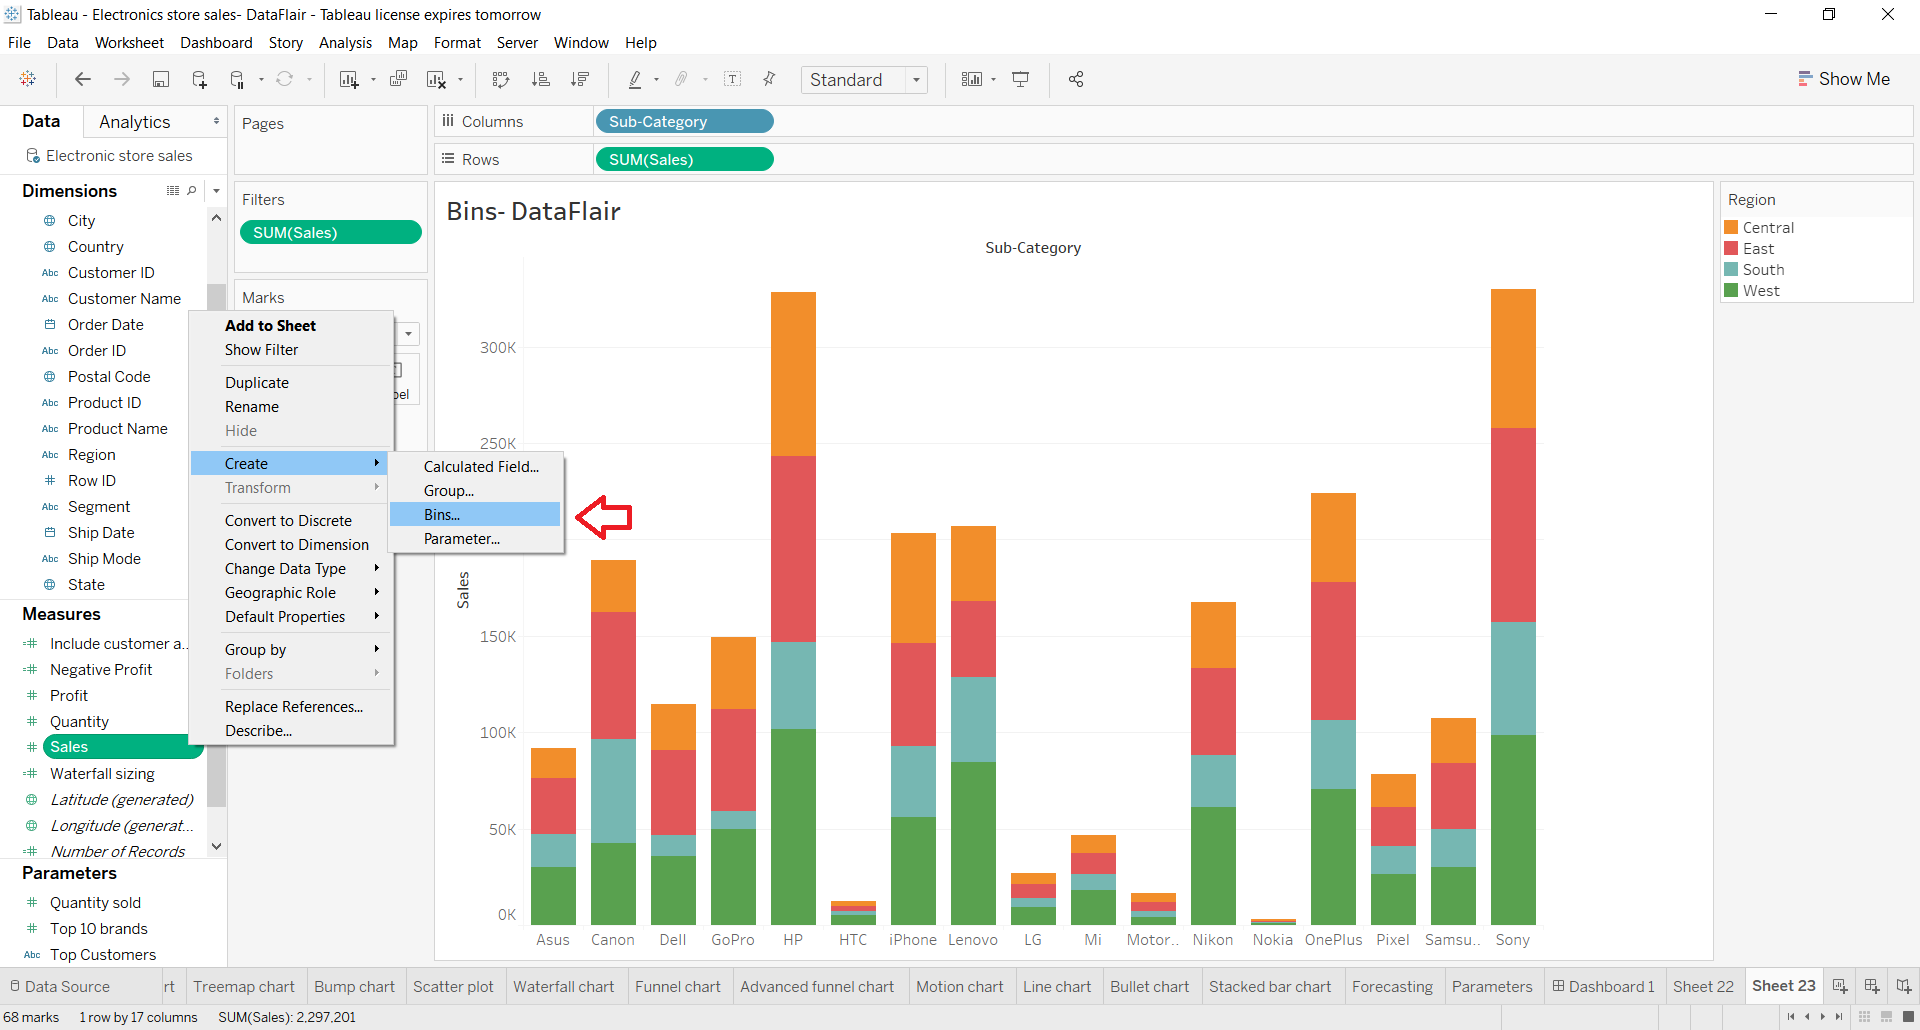
Step 1: To create a bin on a Tableau worksheet, right-click on the field name (measure or dimension) from where we’ll use data for the bin. Then, select Create and click on Bins…
As you can see in the screenshot below, we are creating a bin for our measure field Sales.
This will open a Create bins dialog box from where we can enter details and configure our bin. We will learn more about this in Step 2.
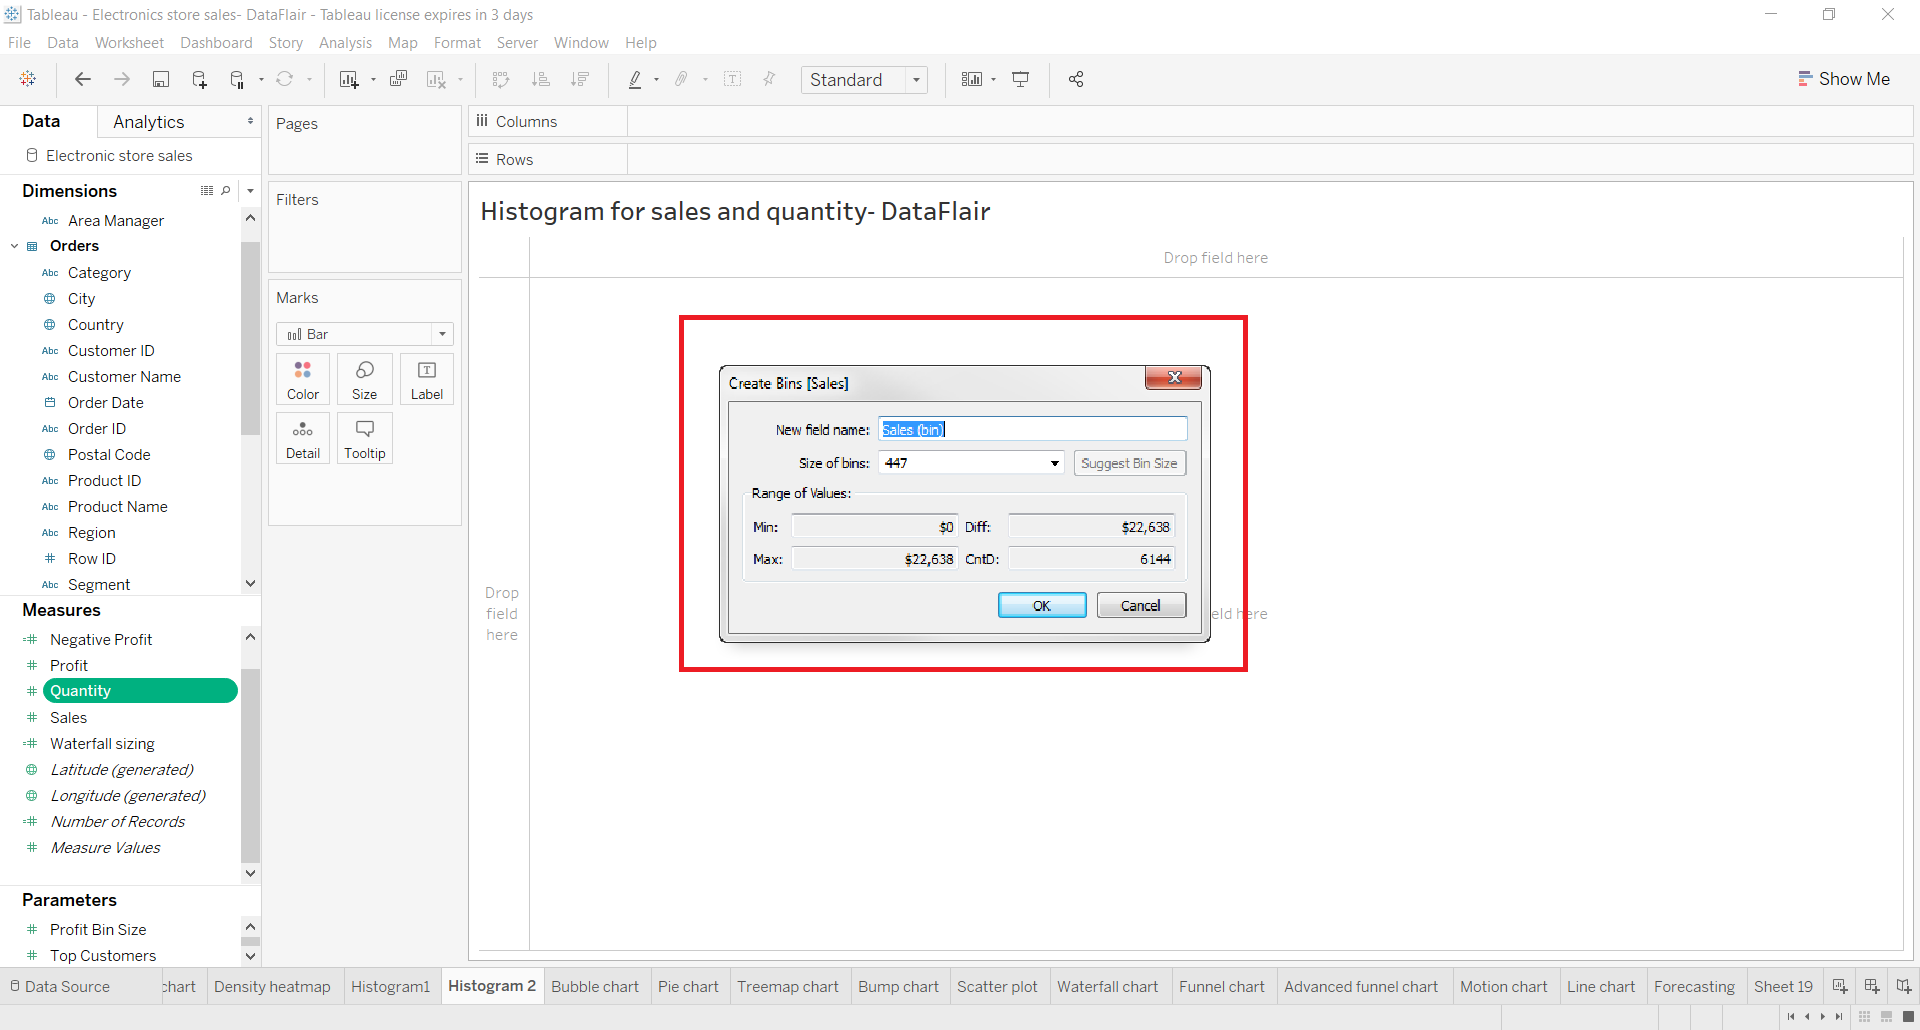
Step 2: From the Create Bins dialog box, we can set different parameters for the bin we wish to create. In the beginning, we are asked to enter a name for the new (bin) field. Next, we get to set the size of the bin. You can also click on the “Suggest Bin Size” button to get a bin size suggestion from Tableau for your selected data set.
In addition to this, we can set parameters to set a Range of Values such as Minimum value, Maximum value, Difference, and CntD. Click on OK once you enter all the required parameters for a bin.
Get to Know – How to Create Parameters in Tableau
Step 3: As you can see, the bin that we just created with the name Sales (bin) is present under the Data pane in the list of fields. We can use this bin field in visualization by simply dragging and dropping it on the Columns or Rows section.
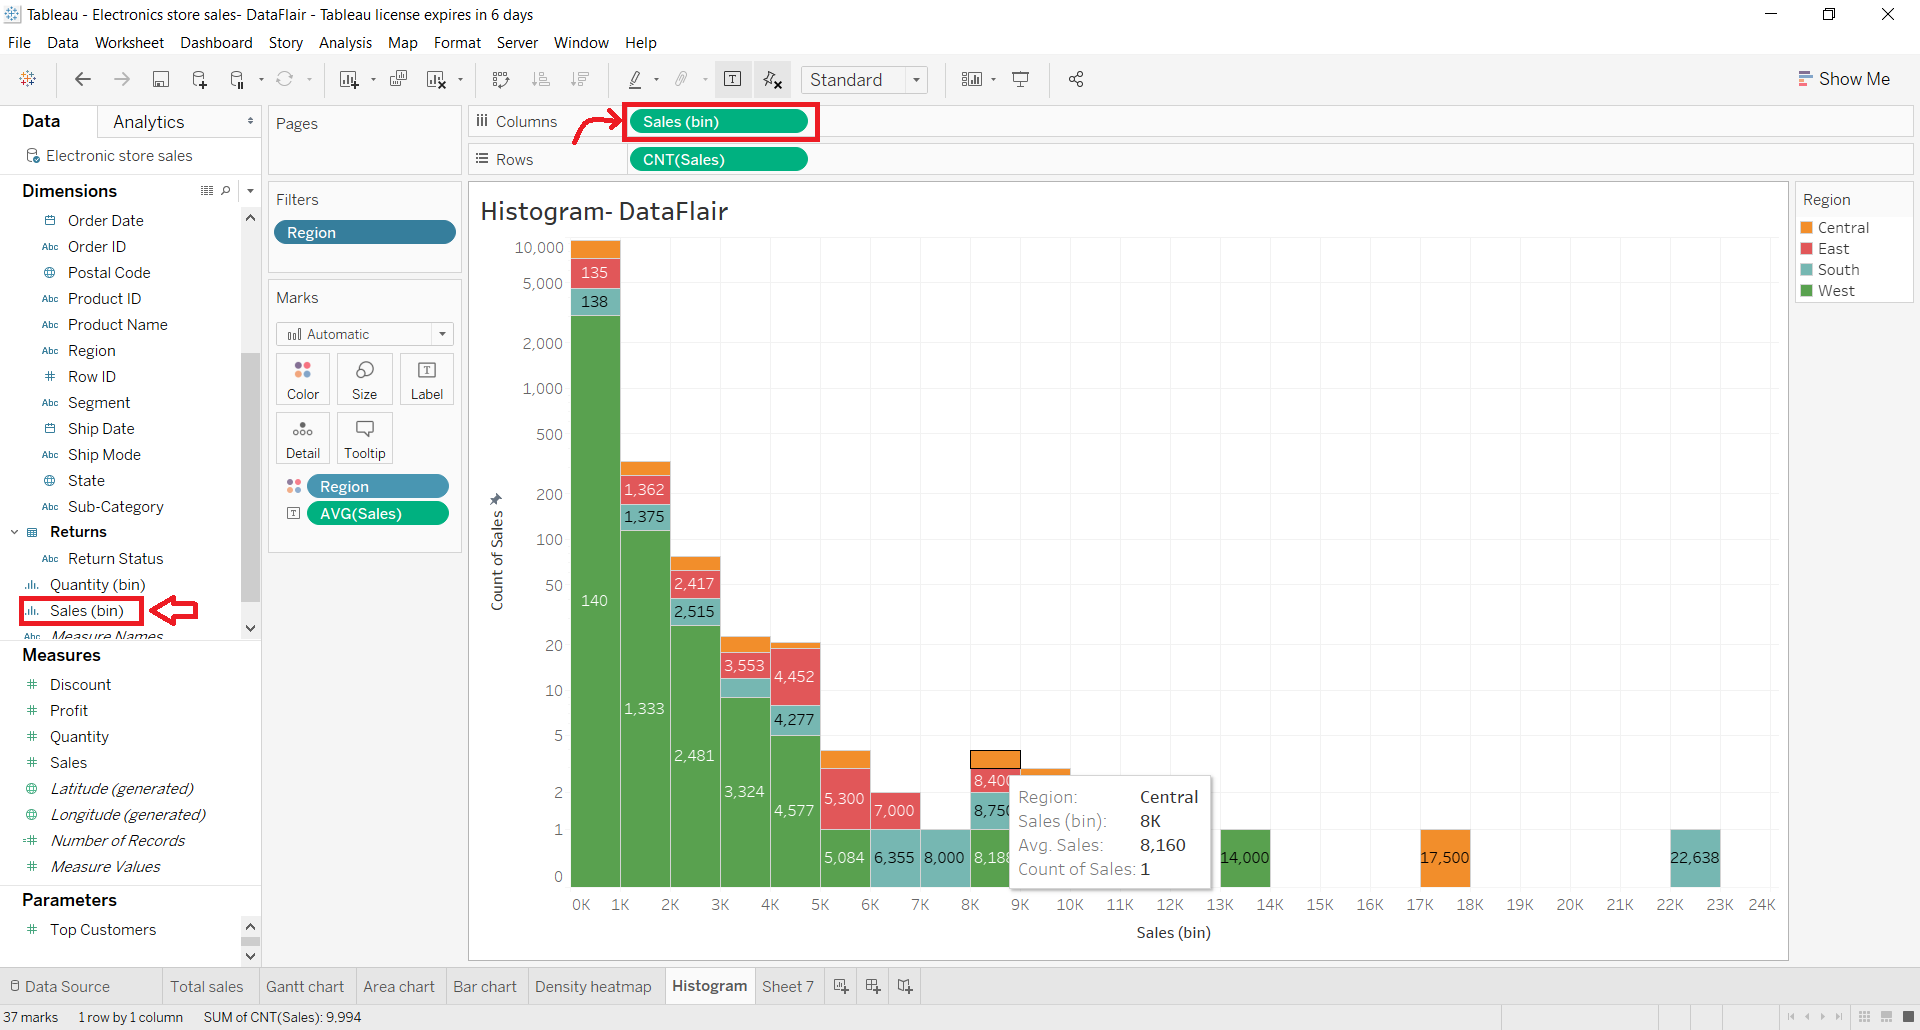
As we can see in the screenshot above, the histogram has a bin field on the x-axis. The histogram is such that it drops values of sales per region in bins of size 1000 or 1K. That means, all the sales values that fall under 0 to 1000 range will occupy the 0K to 1K bin. Those values that fall between greater than 1K to 2K range fall in the next bin and so on. In this way, the entire sales data is segregated or distributed in a range.
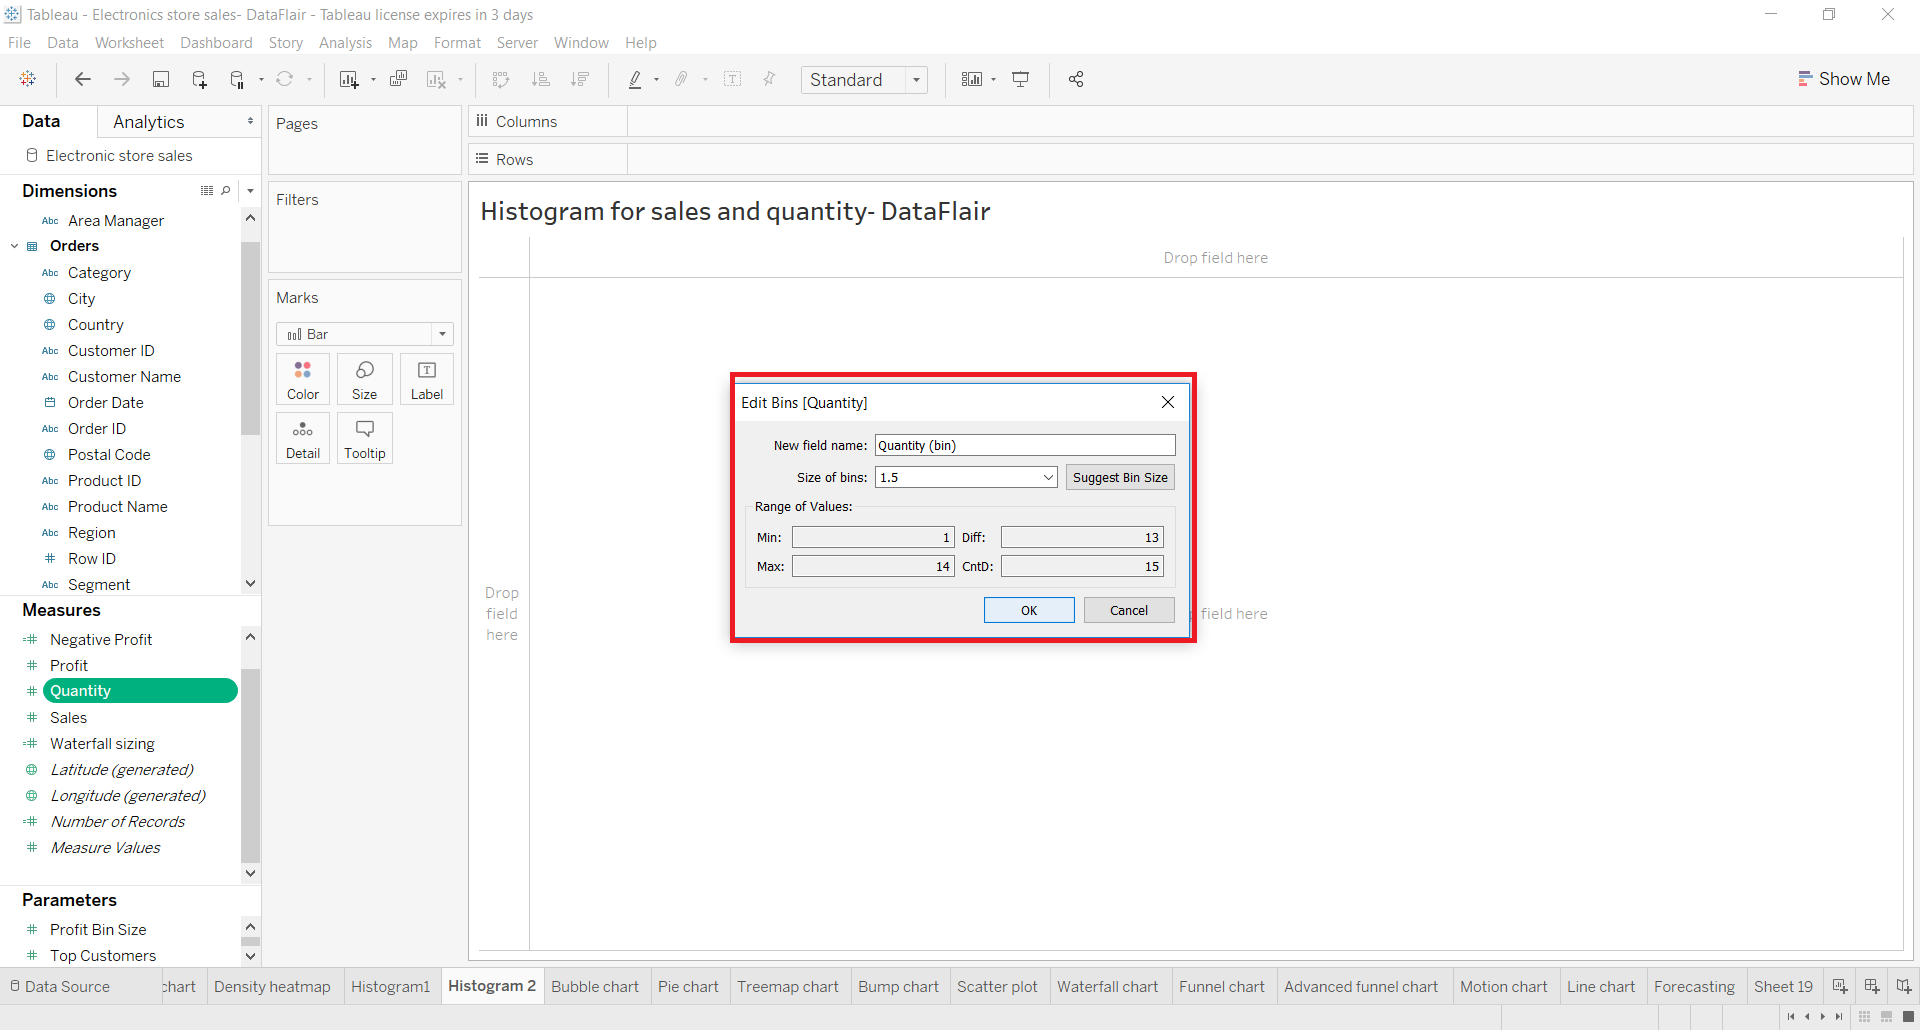
We can also edit an already existing Tableau bin by right-clicking on the bin name and selecting the Edit option. You can change any bin parameter from this dialog box as per your requirement.
Summary
This concludes our tutorial on Tableau bins. We hope you were able to learn about bins and how to create them in an easy way here. If you have any queries or suggestions about this topic or anything else related to Tableau, please feel free to leave your comments in the comment section below.
If you are Happy with DataFlair, do not forget to make us happy with your positive feedback on Google


