Tableau Web Map Service – Create Map with WMS Background
Job-ready Online Courses: Dive into Knowledge. Learn More!
In this Tableau tutorial, we are going to study Tableau web map service. Moreover, we will see how to study Tableau WMS and work with Web Mapping Service. At last, we will study the various ways to create Map with WMS background and with path lines.
So, let us start Tableau Web Map Service.
Tableau Web Map Service
Another way to change the appearance of maps is to connect to a service called Web Map Service, which serves map tiles, and use those instead of the default maps the come with Tableau. That’s why we call it Tableau Web Map Service or Tableau WMS.
Let’s know How Add Data Layer to Map in Tableau
Create Map with WMS Background
Following steps are showing how to create a map with Tableau Web Map Service Background. Let’s discuss them one by one:
i. From Dimensions in the sidebar, drag DBA to the Filters shelf and filter the values to only show MCDONALD’S.
ii. In the Dimensions section, double-click on Zipcode. This will show the Tableau default map in the view.
iii. From Dimensions, drag DBA to Details in the Marks This will update the map with circles representing locations of the McDonald’s restaurants.
iv. Click on the Map menu, and select Map Services…:
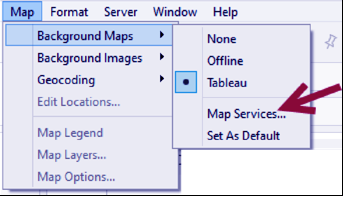
Step-4 Create Tableau Web Map Service with WMS Background
Read about Show Me How – Tableau TreeMap
v. In the Map Services window that appears, select Add and then WMS Servers…:
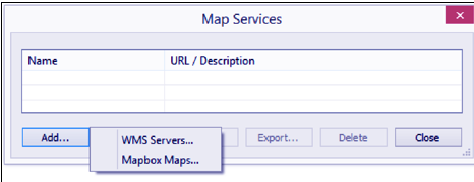
Step-5 Create Map with Tableau WMS Background
vi. In the Add WMS Server Connection window, type the following in the URL field: http://ows.terrestris.de/osm-gray/service?:
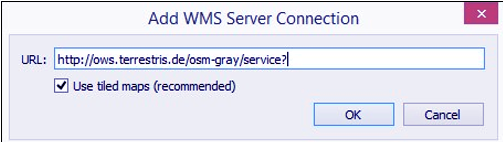
Step-6 Create Map with Tableau WMS Background
vii. Close the Map Services window when done.
viii. From Measures, drag Cuisine Average Grade to Color.
Let’s Explore How to Create Tableau Heat Map
How to Create Map with Path Lines?
Here, we will learn to make a map with path lines.
i. Double-click on Latitude and Longitude under Measures. Make sure you double-click on the data source fields, not the Tableau-generated fields. By default, AVG(Longitude) and AVG(Latitude) should be the aggregations that are used for these fields:
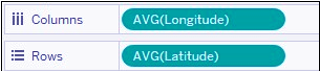
Step-1 Create Tableau Map service with Path Lines
ii. Use Ctrl + drag with the Latitude pill in the Rows shelf to the Rows shelf to copy it:
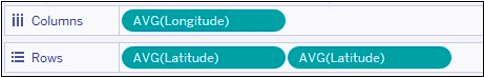
Step-2 Create Tableau Map service with Path Lines
iii. Click on the first AVG(Latitude) pill to activate the first Marks card.
Let’s revise Tableau Trend Line – Create Trend Line
iv. Change the mark of the first AVG(Latitude) on Marks card to Line.
v. Drag the ID field from Dimensions to Path of the first Marks card.
vi. Select the second AVG(Latitude) on Marks card and change the mark type to Shape.
vii. From Dimensions, drag Team Name to Shape in the second AVG(Latitude) on Marks card.
viii. Click on Shape and assign the icons to the correct team:
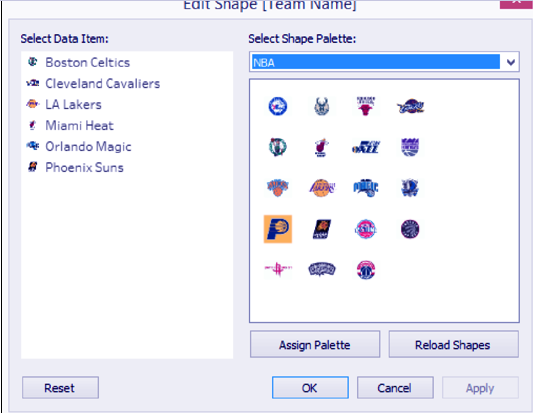
Step-2 Create Mapping service with Path Lines
ix. Adjust the size of the team icons. Click on the Size property in the Marks card and slide a little bit to the right to increase the size of the team icons.
Do You How Data in Tableau Export to PowerPoint and Word
x. While the second Marks card is still selected, drag the following dimension fields to Label: ID, Team Name, From-To, and # Years Label.
xi. Adjust the label formatting to look similar to the following screenshot:
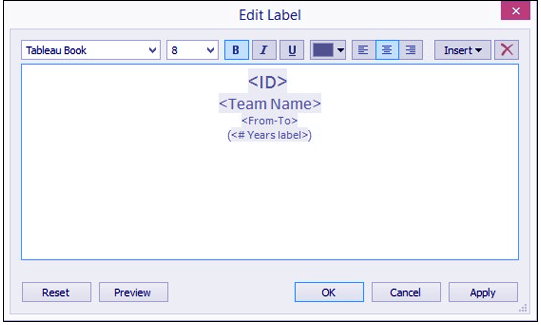
Step- 11 Create Map with Path Lines
xii. Right-click on the second AVG(Latitude) pill in the Rows shelf and click on Dual Axis.
This was all about Tableau Web Map Service Tutorial. Hope you like our explanation of Creating Map with WMS Background & Path Lines.
Read about Clustering in Tableau & Visualizing Forecasting in Tableau
Conclusion
Hence, in this tutorial, we studied What is Tableau Web Map Service and how to work with Tableau map service. In conclusion, we discuss two steps to create web mapping service in tableau: WMS background and path lines. Furthermore, if you have any query feel free to ask in a comment section.
If you are Happy with DataFlair, do not forget to make us happy with your positive feedback on Google


