Tableau Funnel Chart – Creating Stepped & Advanced Funnel Chart
Expert-led Online Courses: Elevate Your Skills, Get ready for Future - Enroll Now!
In this tutorial, we will learn to create yet another important visualization used frequently in Tableau that is a funnel chart. We will begin with understanding the basics of a funnel chart and then go through a stepwise procedure of creating a funnel chart in Tableau. Here, we will learn to make two different types of funnel charts, first is a simple stepped funnel chart and the second one is an advanced chart also known as a smooth funnel chart.
Before reading further, also check what is the Gantt Chart in Tableau.
What is a Funnel chart?
Funnel charts are important visualization in business intelligence as they offer a way to represent linear workflows. We can make a stepped or smooth funnel chart to visually represent and understand the progression or workflow of a process. Also, we can get a systematic view of our data values through a funnel chart.
How to Create a Tableau Funnel Chart?
Follow the steps given below to create a funnel chart in Tableau. Make sure you have a dataset uploaded in your Tableau software.
Step 1: Add Measures to the Row1s Section
To begin with, we add one measure that is Sales to the Rows section. We select the aggregation type as SUM.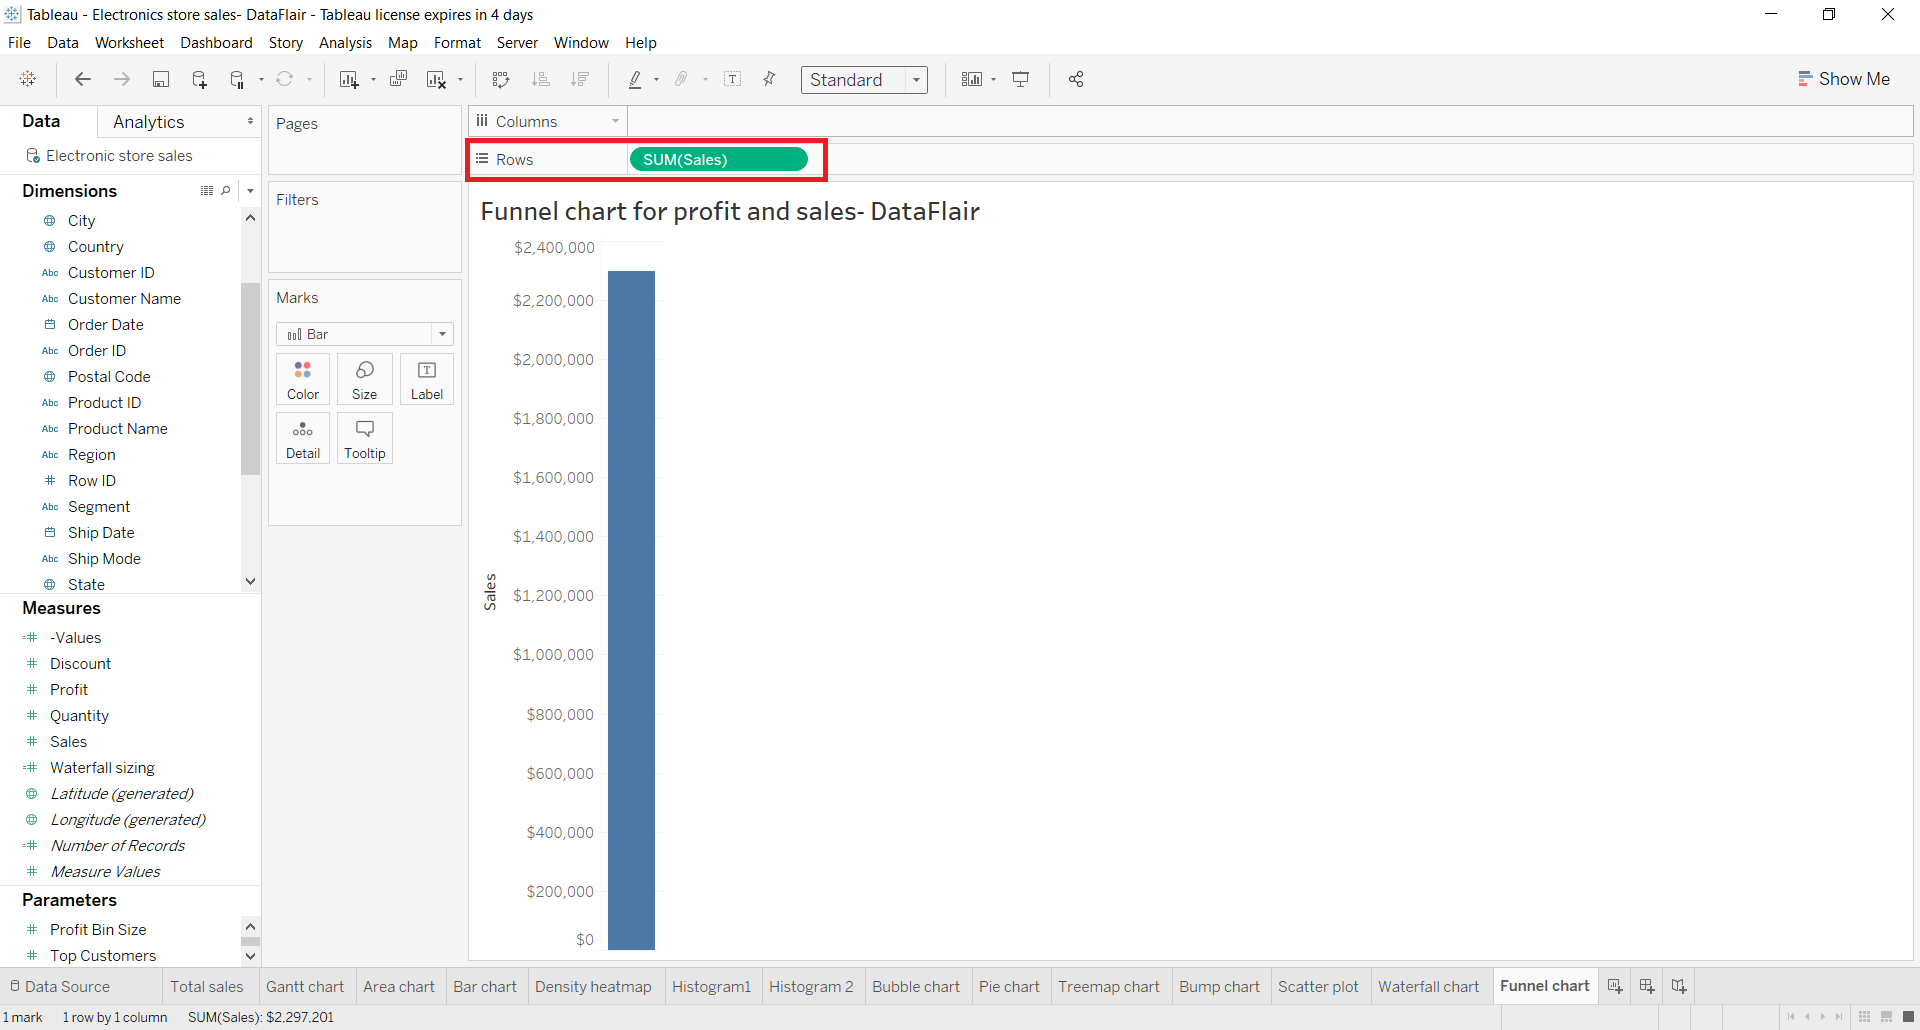
Step 2: Select Dimensions in the Marks Section
Next, we select a dimension (Region) from the list of Dimensions at the left and drag it onto the Colors card in the Marks section. This will divide our vertical bar into four different colors each of which represents a region.
Then, we add SUM(Sales) into the Size box present in the Marks section. Also, we select the icon for the “Sort Region descending by Sales” option. It will arrange the segments on the bar in a descending manner.
Step 3: Convert Standard View to Entire View
By default, the view type is set to Standard, we change it to Entire View so that our chart covers the full view and looks more like a funnel in shape.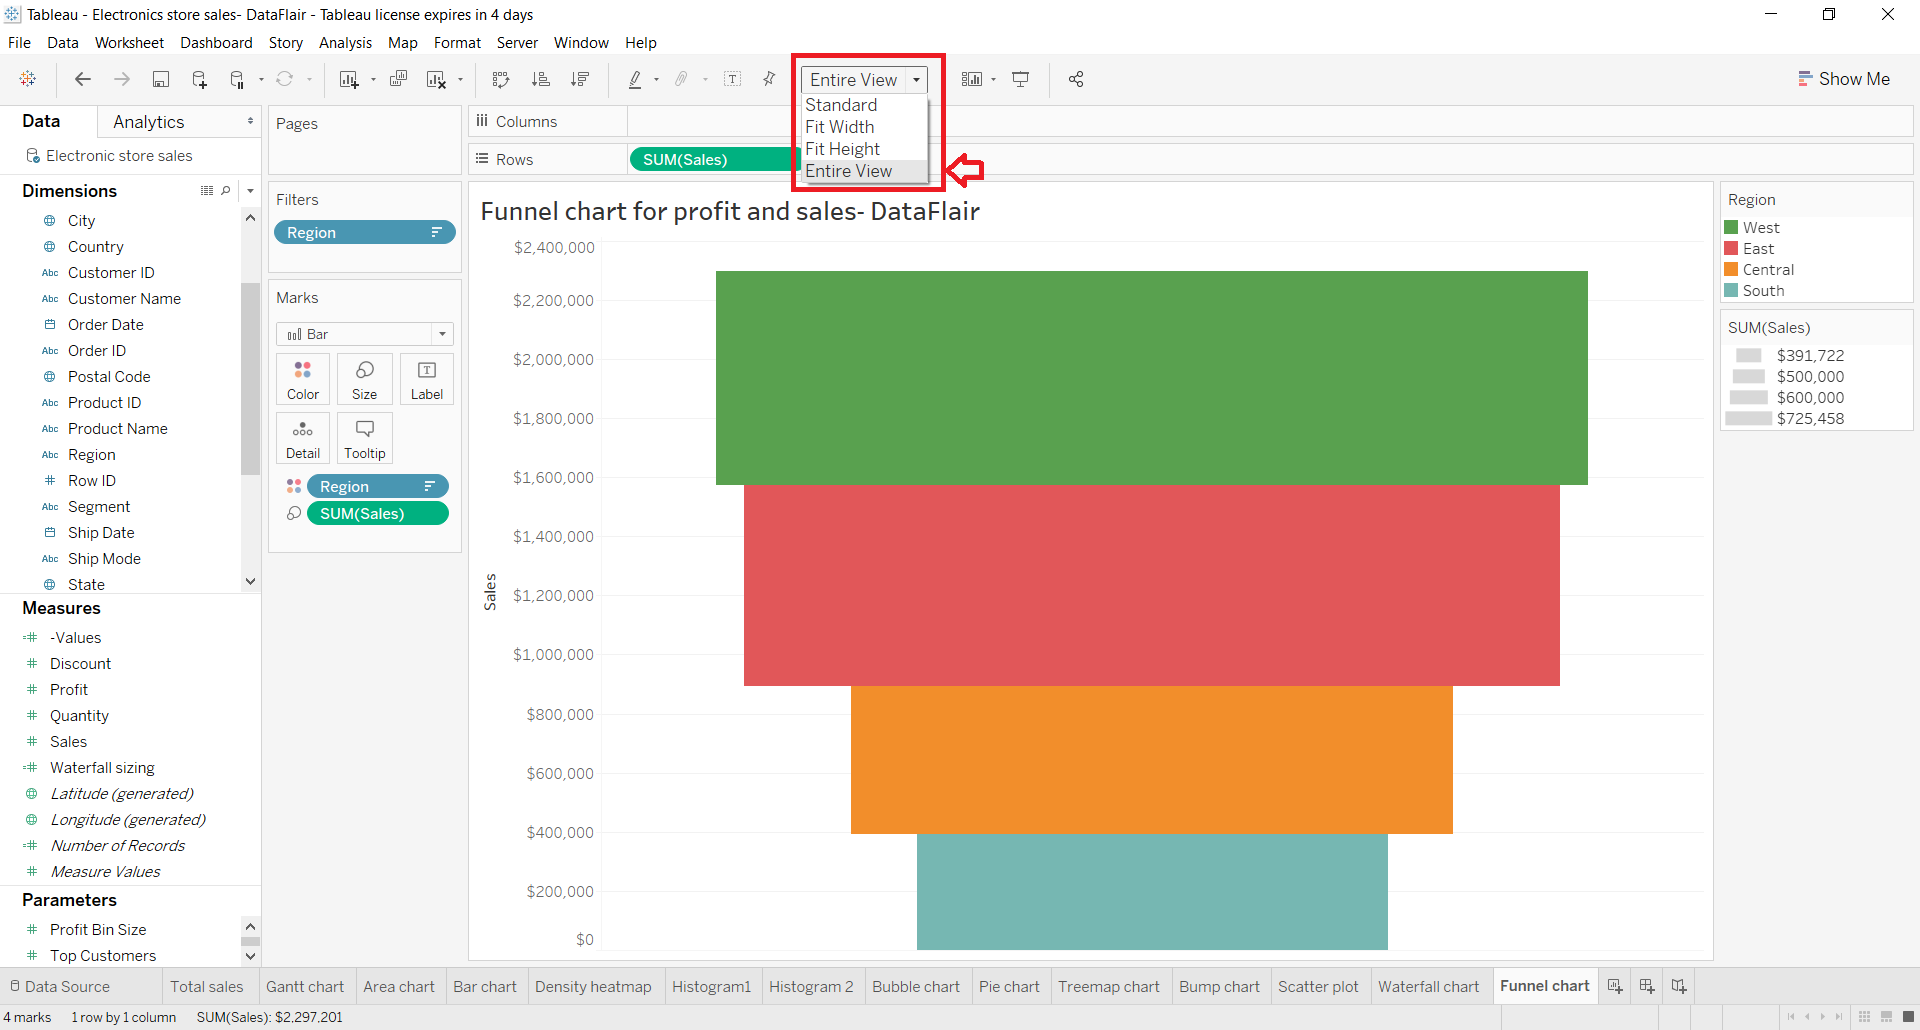
Step 4: Add Labels in the Marks Section
Next, we add the fields Region and SUM(Sales) into the Label box present in the Marks section.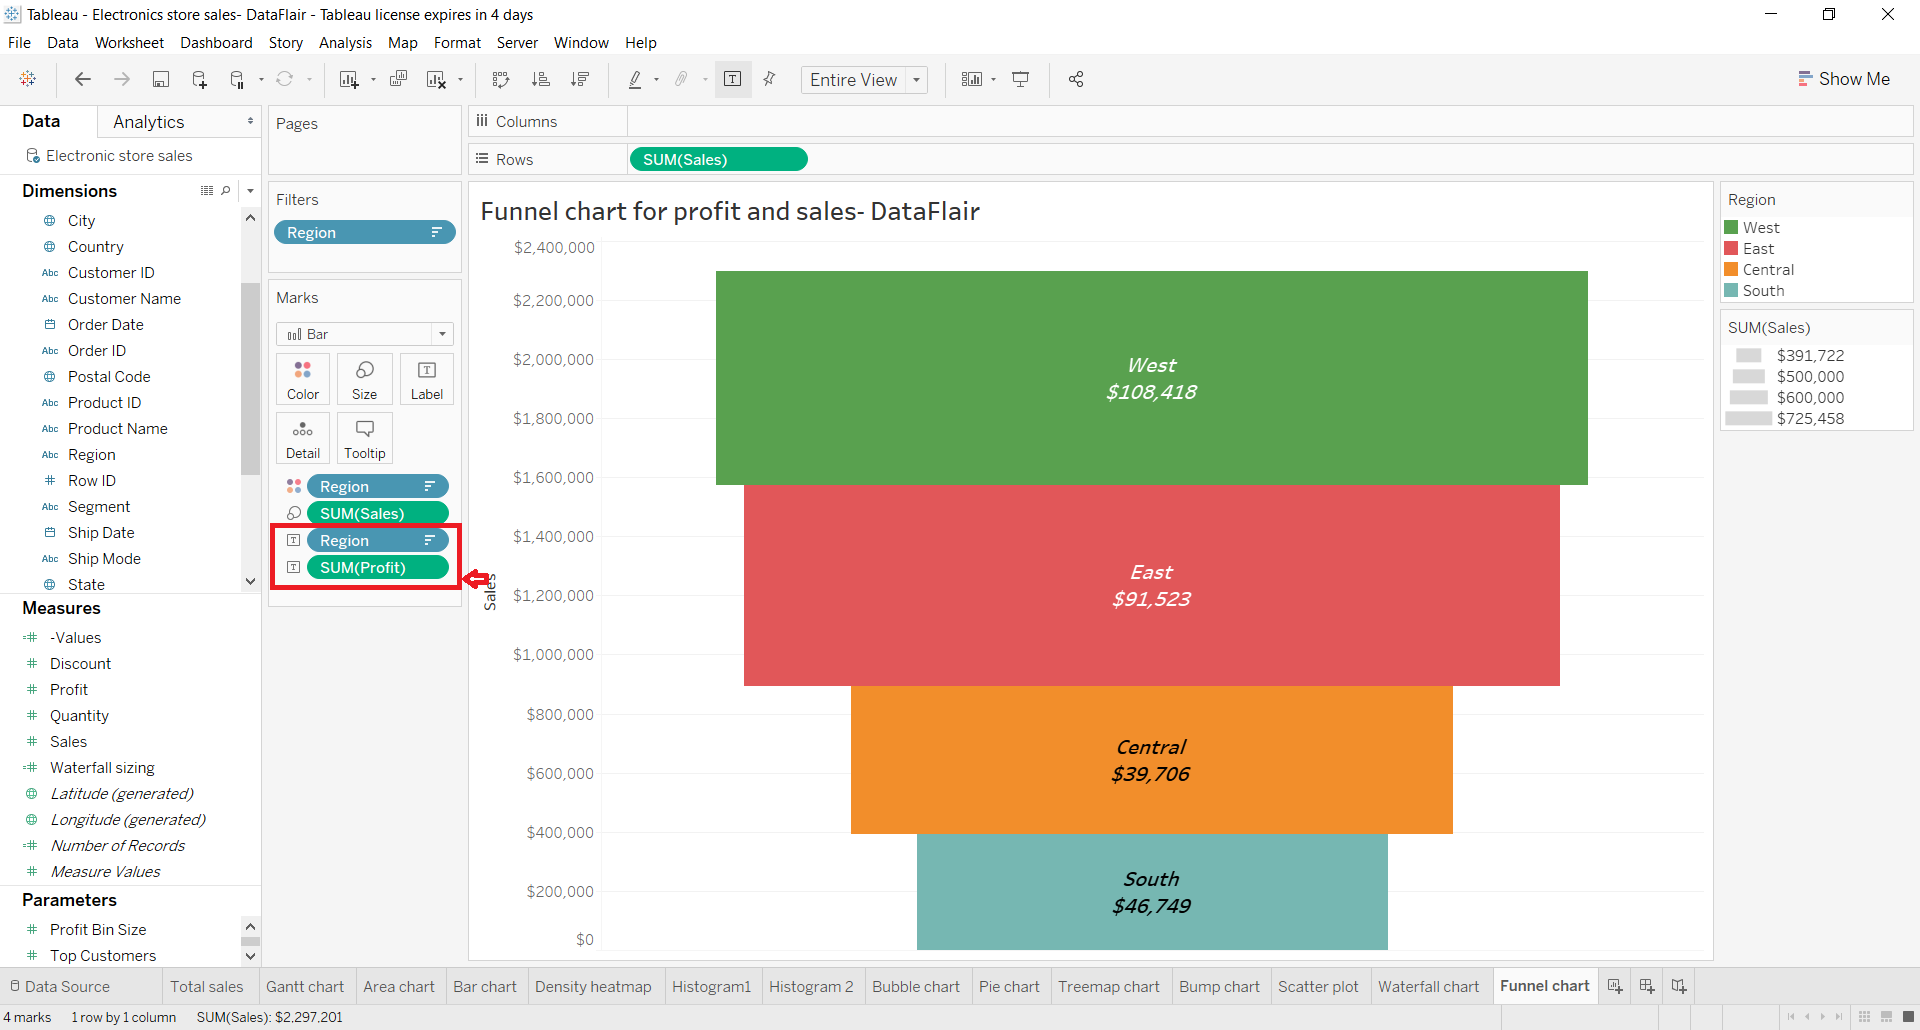
Step 5: Final Funnel Chart
This adds text labels showing the region and total sales for each region block in our funnel chart.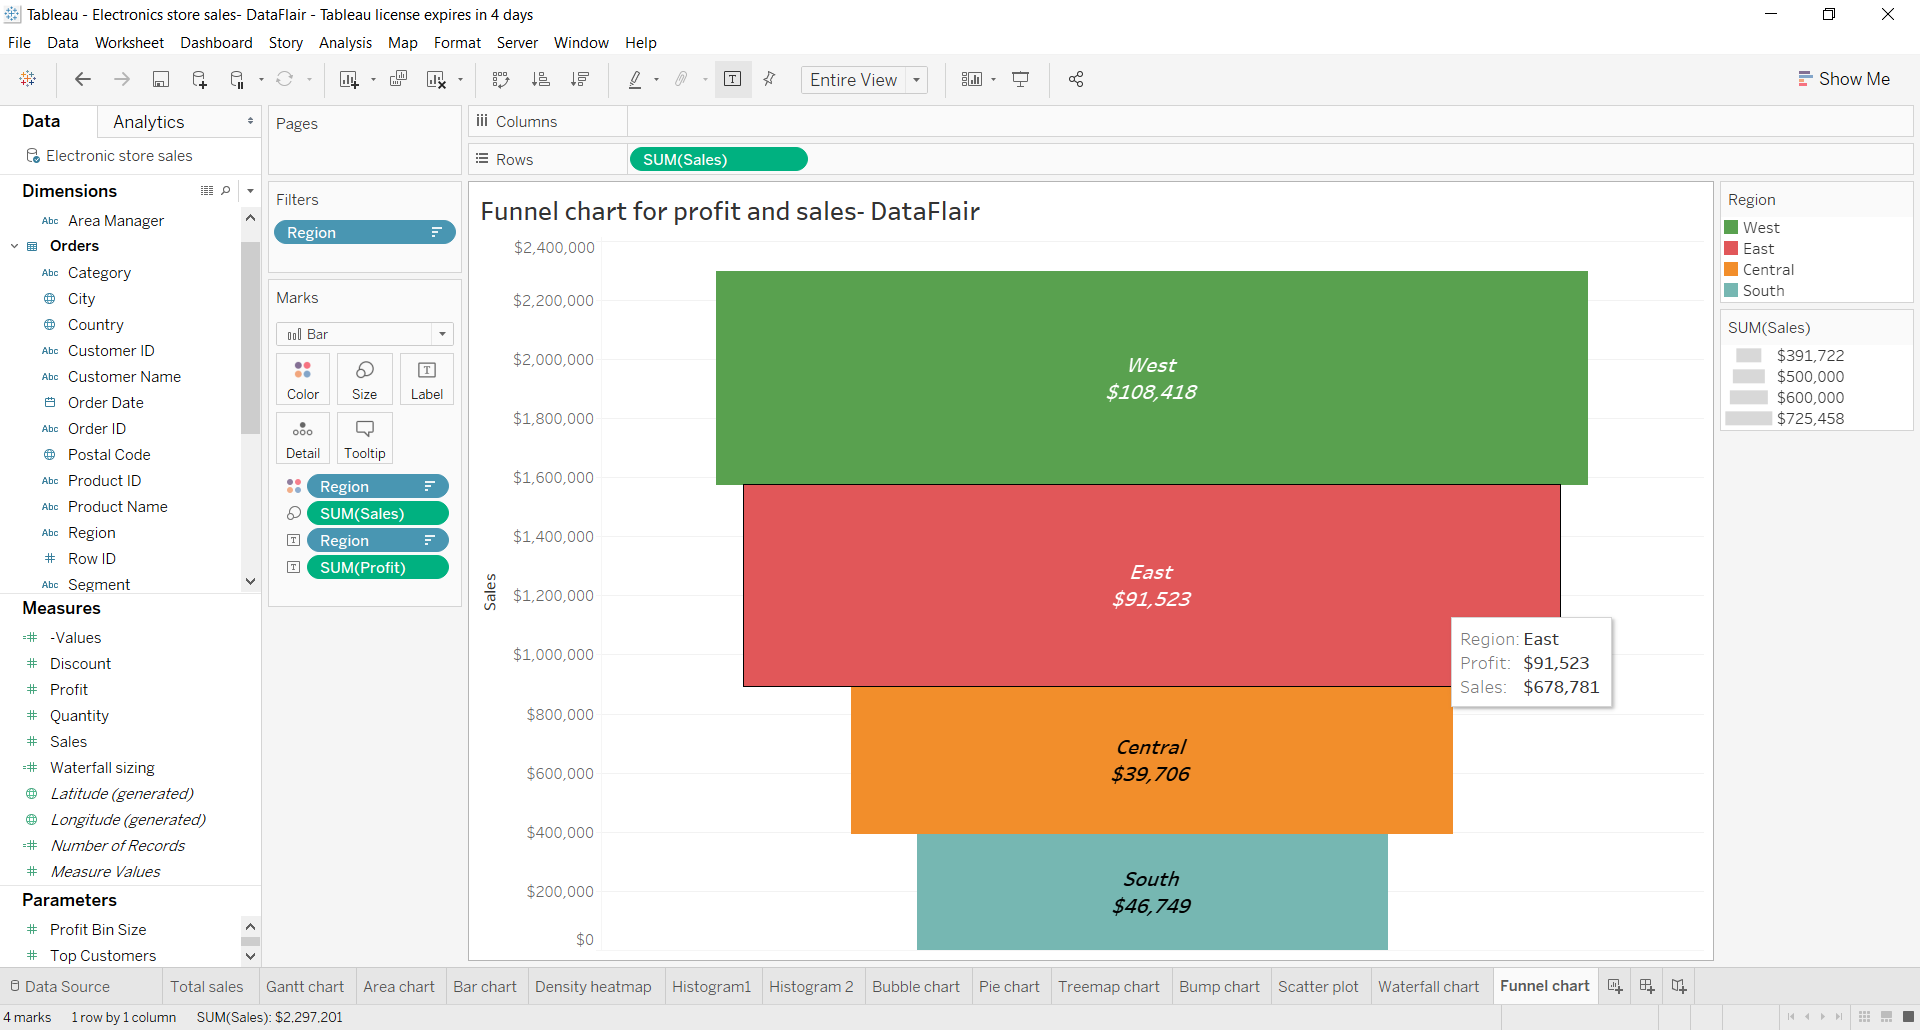
This final funnel chart of ours is showing the total sales of electronic items in four different regions. The chart shows total sales in descending order from top to bottom. Thus, this is a simple or stepped funnel chart.
So, this was all about creating the simple Tableau funnel chart. Also with this, you should explore Bump Chart in Tableau.
How to Create an Advanced Funnel Chart?
In this section, we will go through the steps to create an advanced Tableau funnel chart.
Step 1: Add Rows and Columns in Ship Mode Dimension
In the first step, we take a dimension; Ship Mode and a measure; SUM(Sales) and put them into Columns and Rows section respectively.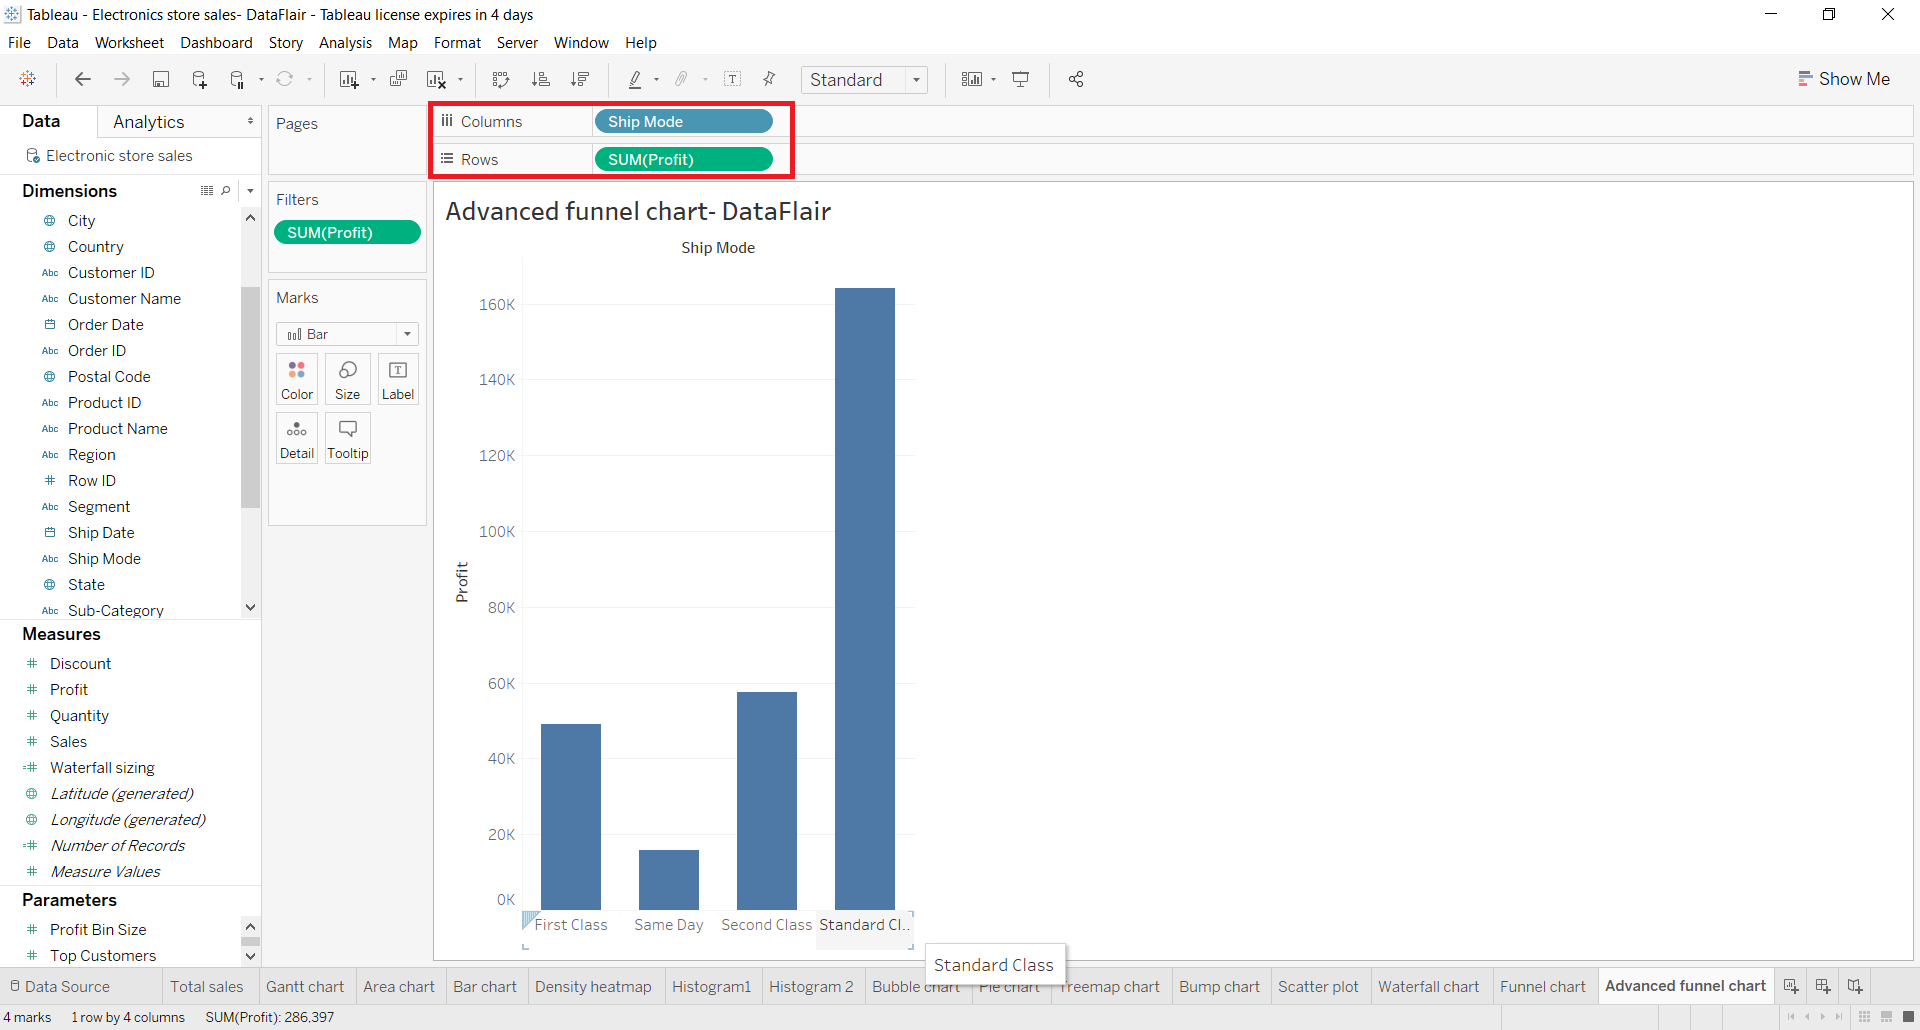
Step 2: Convert Vertical Bars into Horizontal Bars
Next, we change the perspective from vertical bars to horizontal bars. Click on the icon shown in red in the screenshot shown below.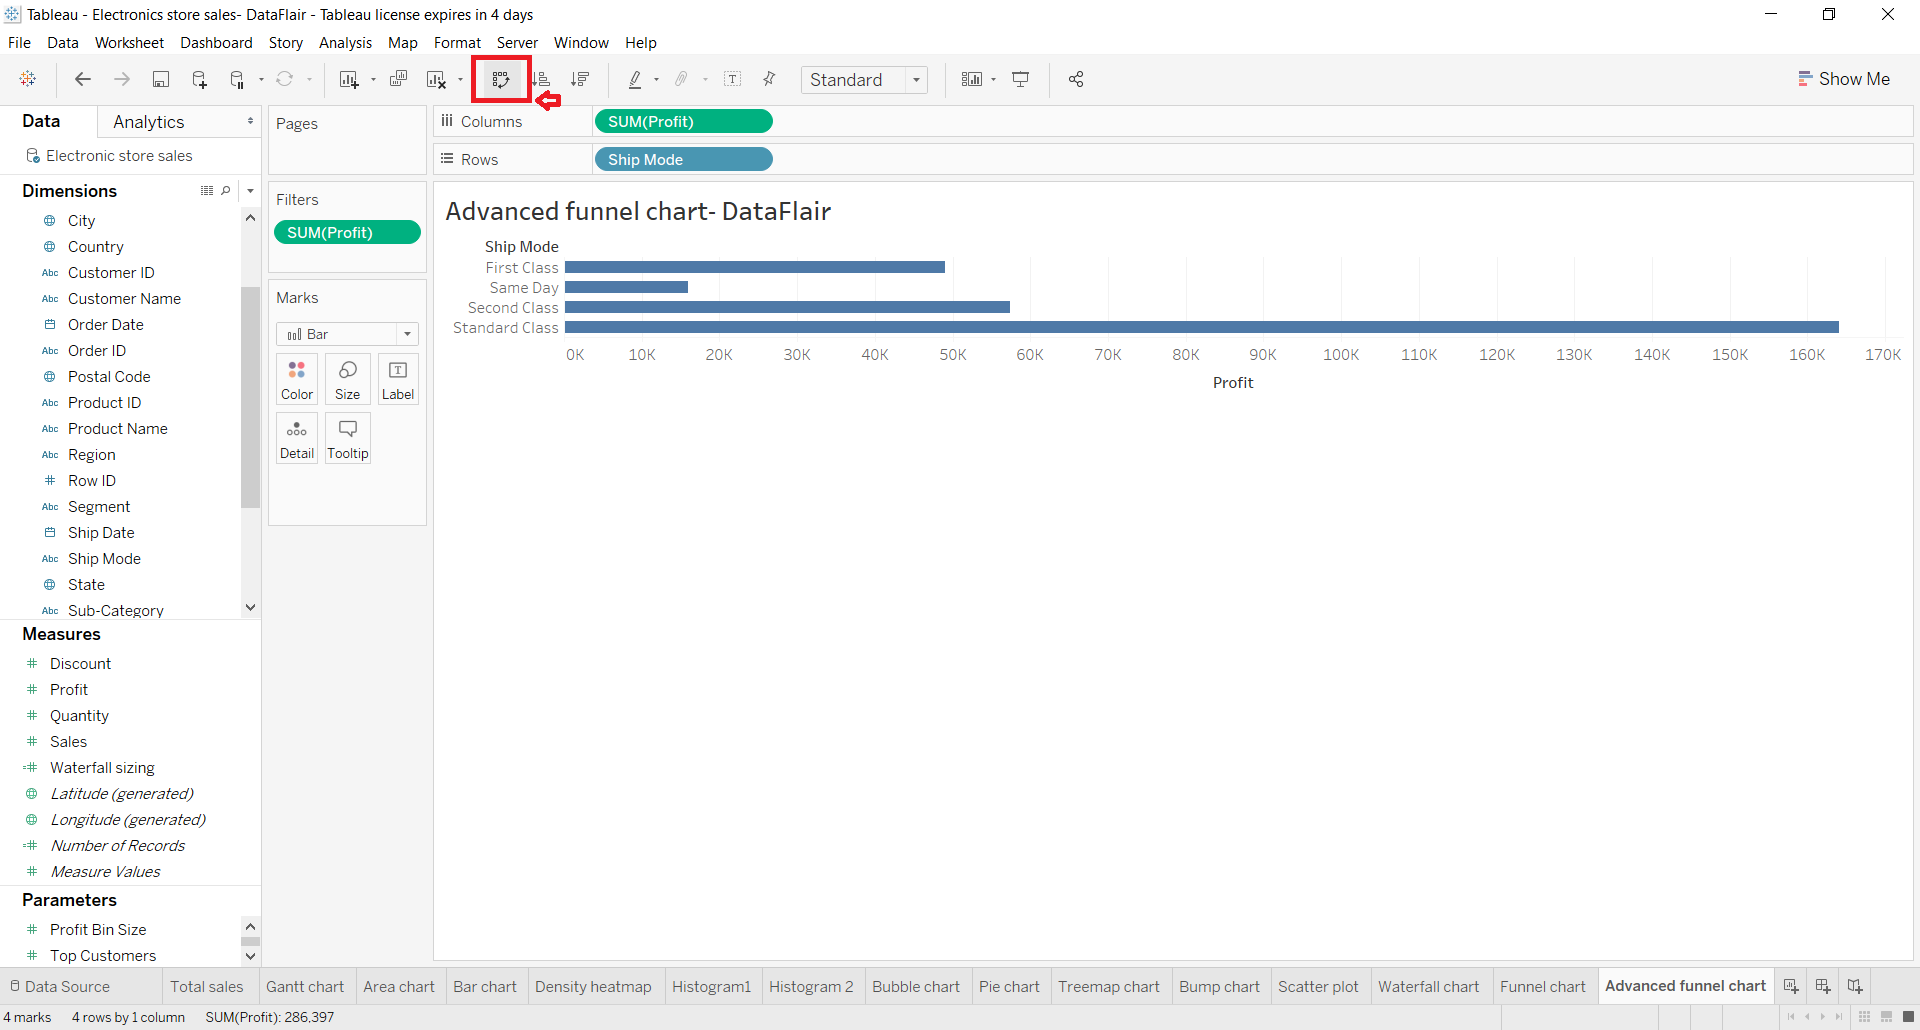
Followed by this, we click on the icon to apply a nested sort which is descending by sum of profit.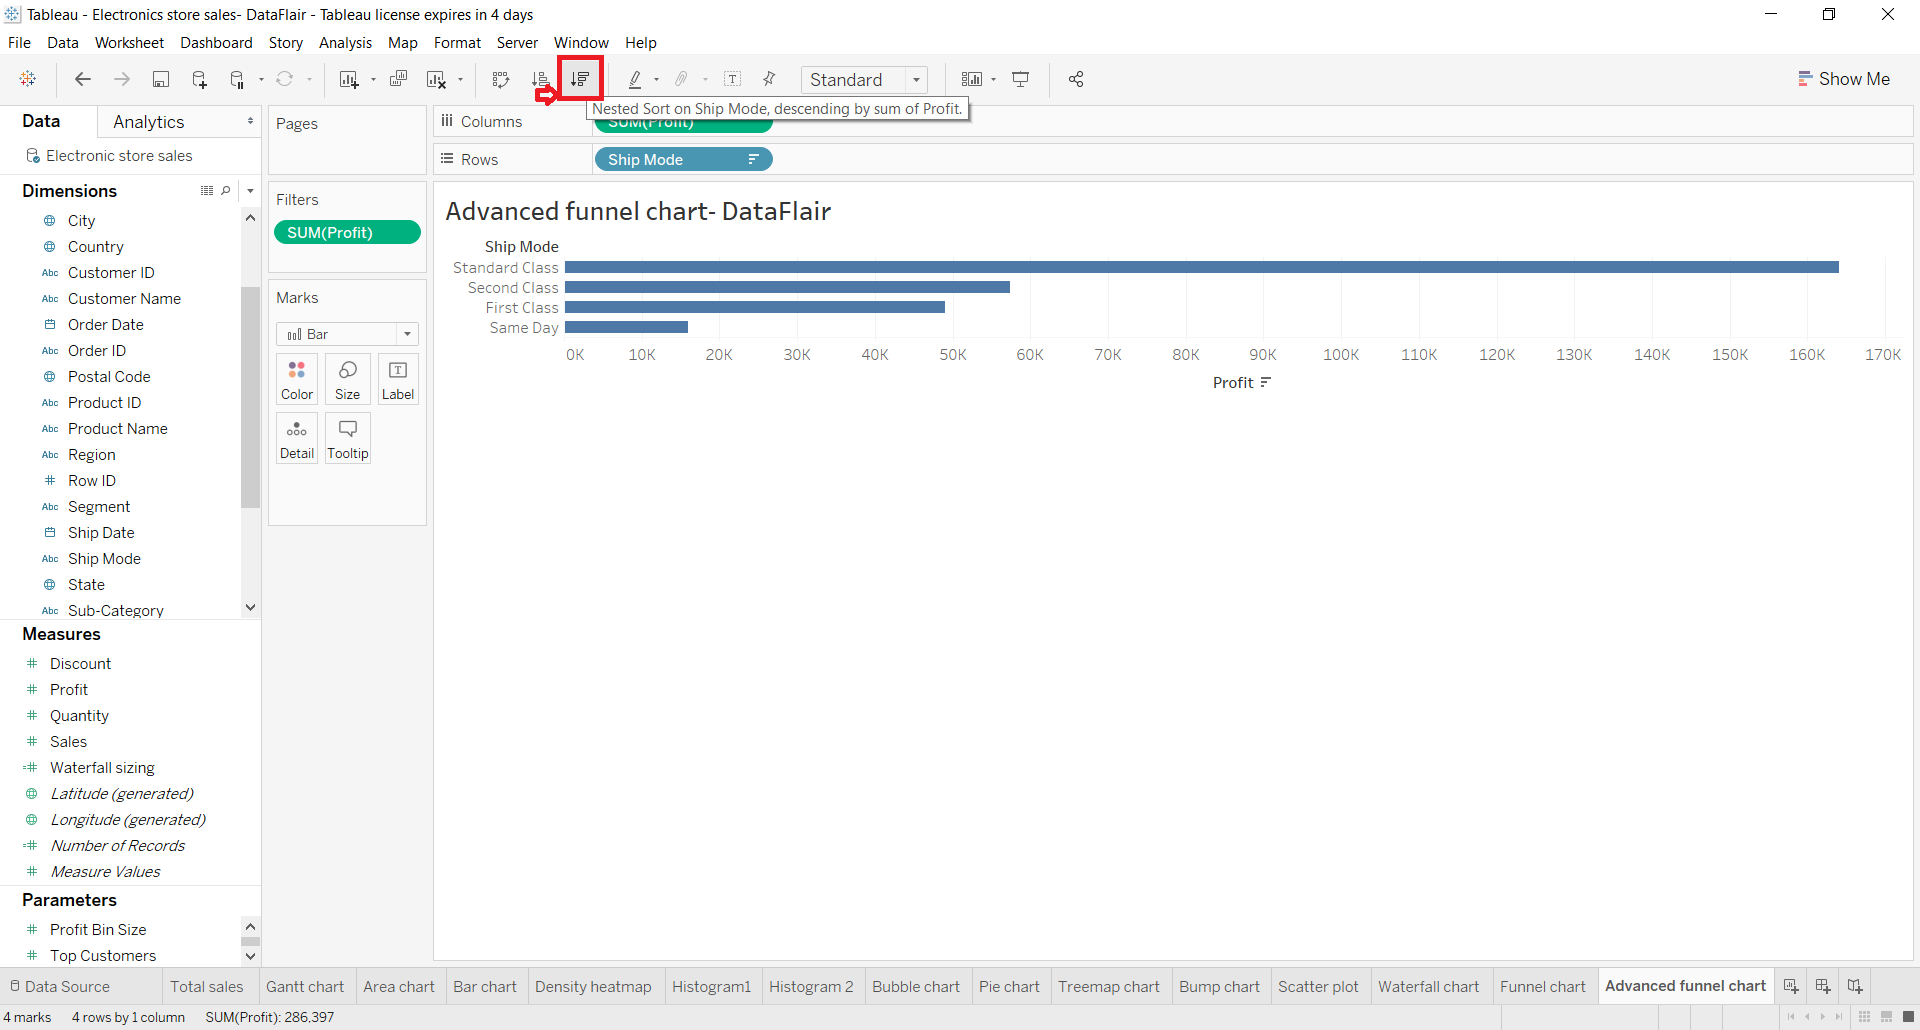
Now, we open the mark type drop-down list and select Area option from it. This creates a continuous area covering all the horizontal bars that were in the bar chart.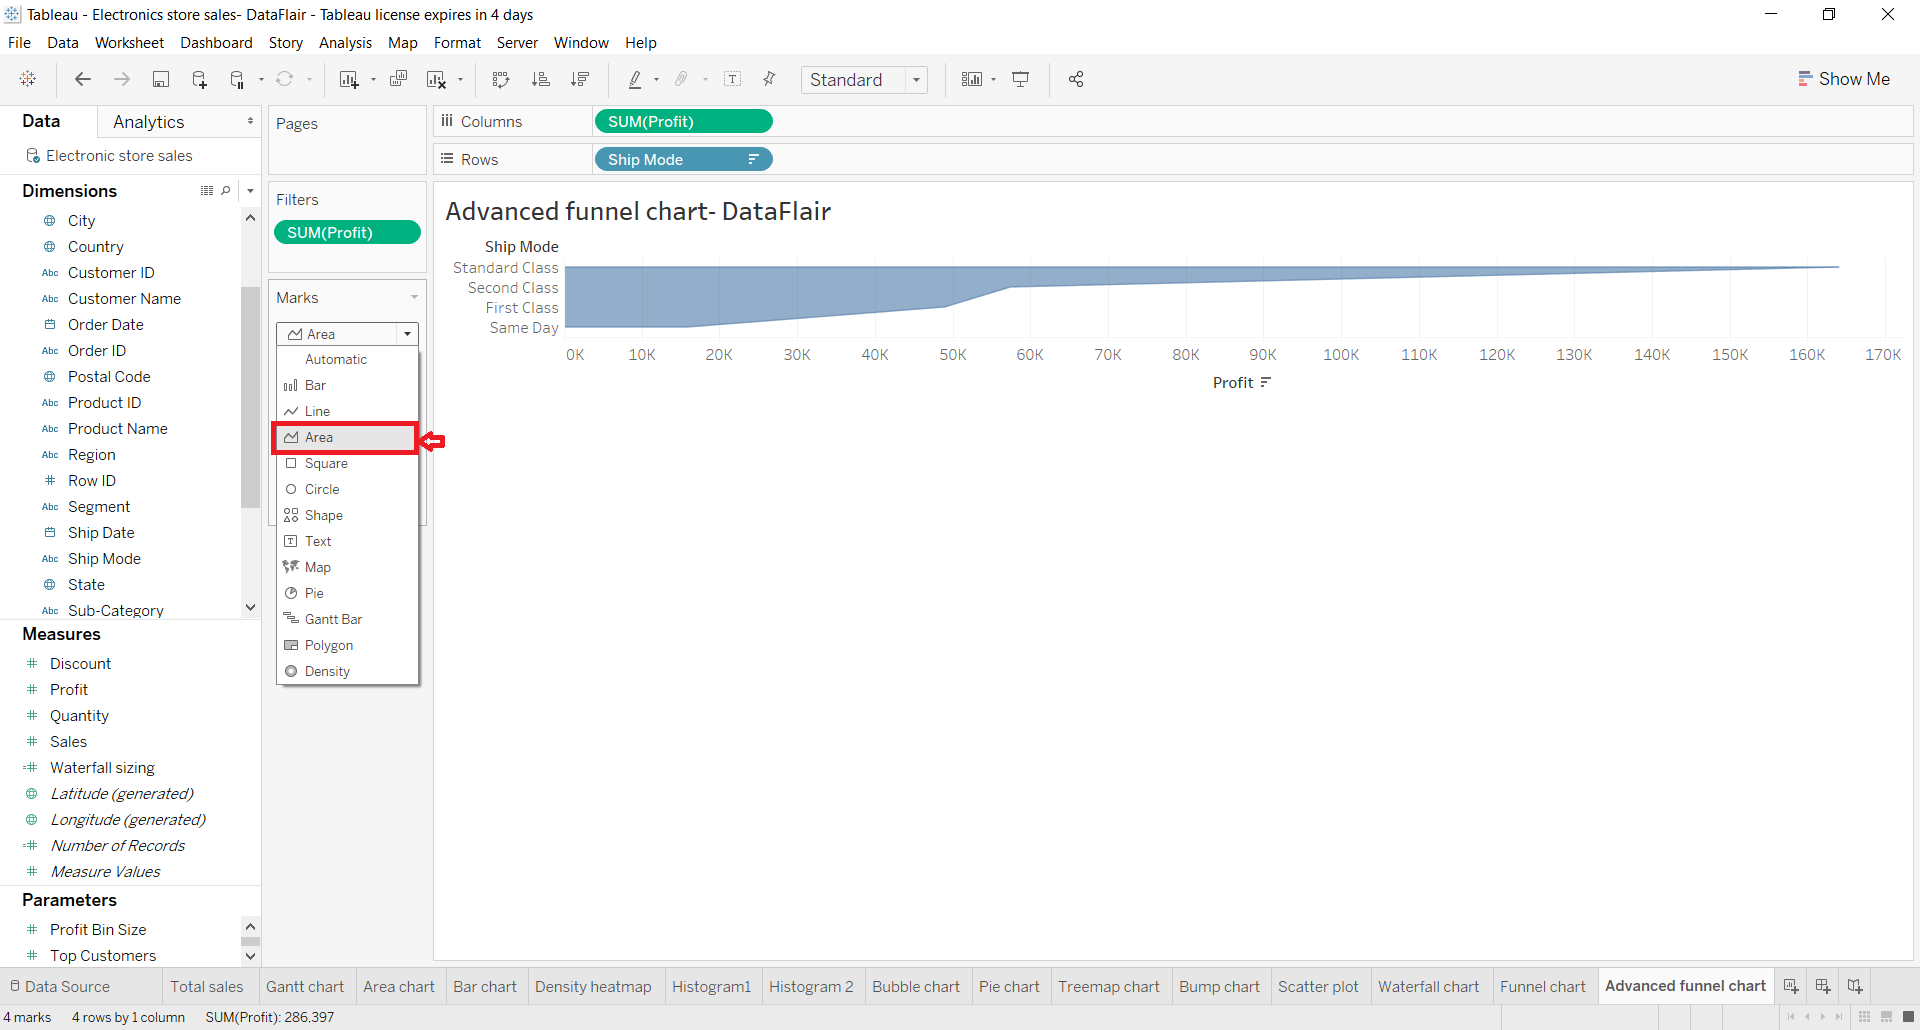
Change the view type from Standard to Entire View.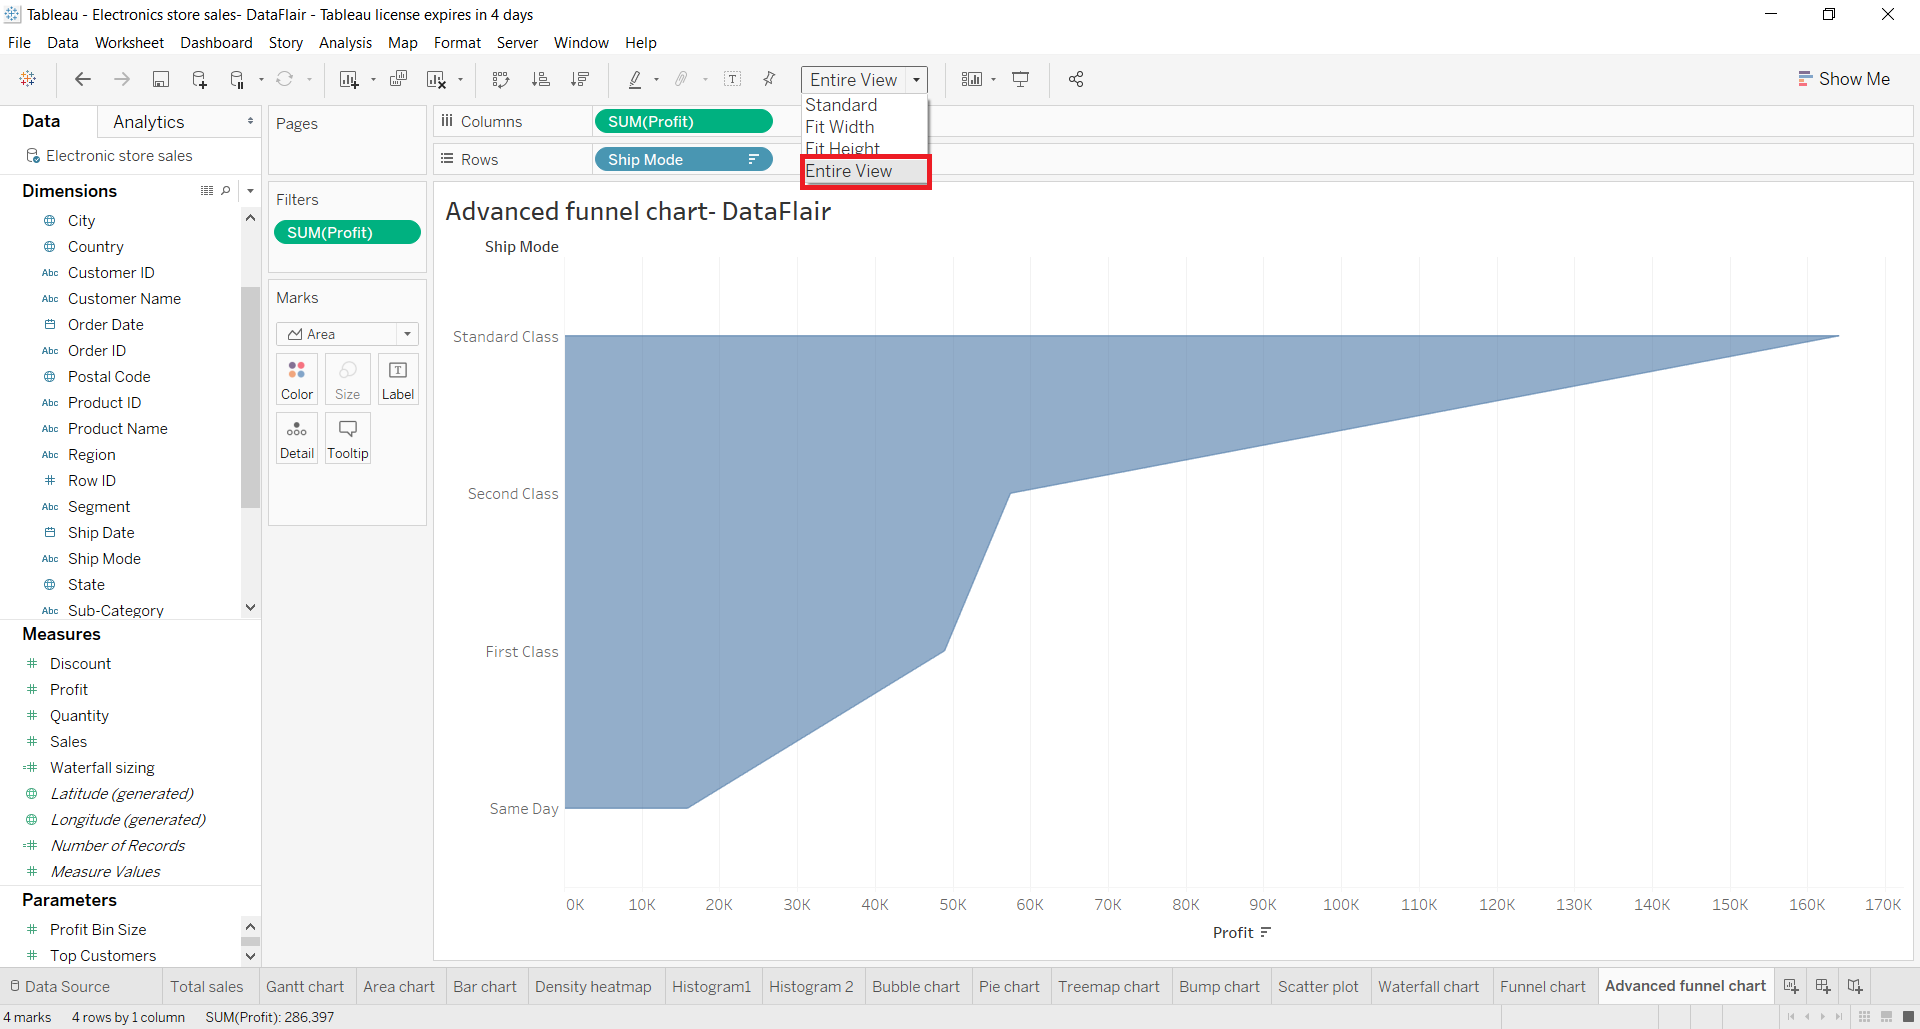
Step 3: Create a Calculated Field
Now, we’ll right-click on our measure named Profit and select Create and then opt for Calculated Field… . With this option, we will create a calculated field. In the calculated field dialog, we enter our formula that is –[Profit]. Also, we name this calculated field as Negative Profit.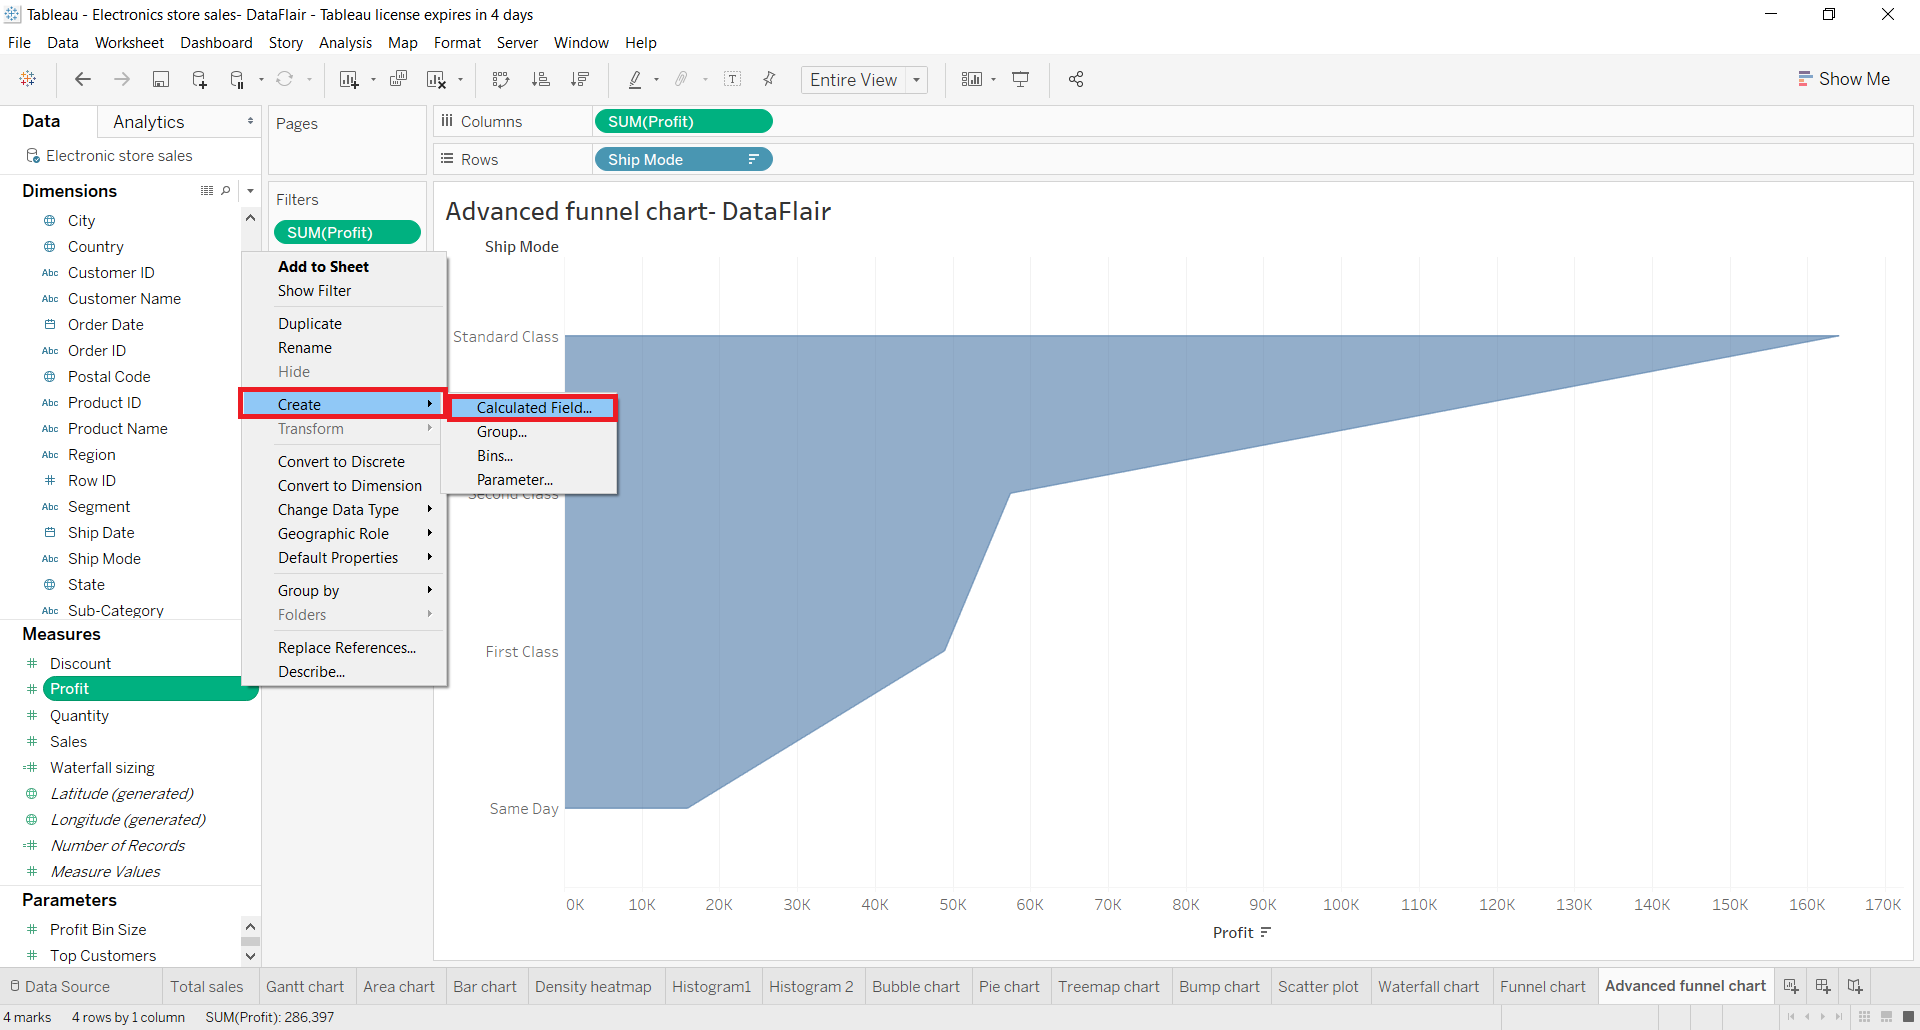
We apply the formula by clicking on Apply and then OK.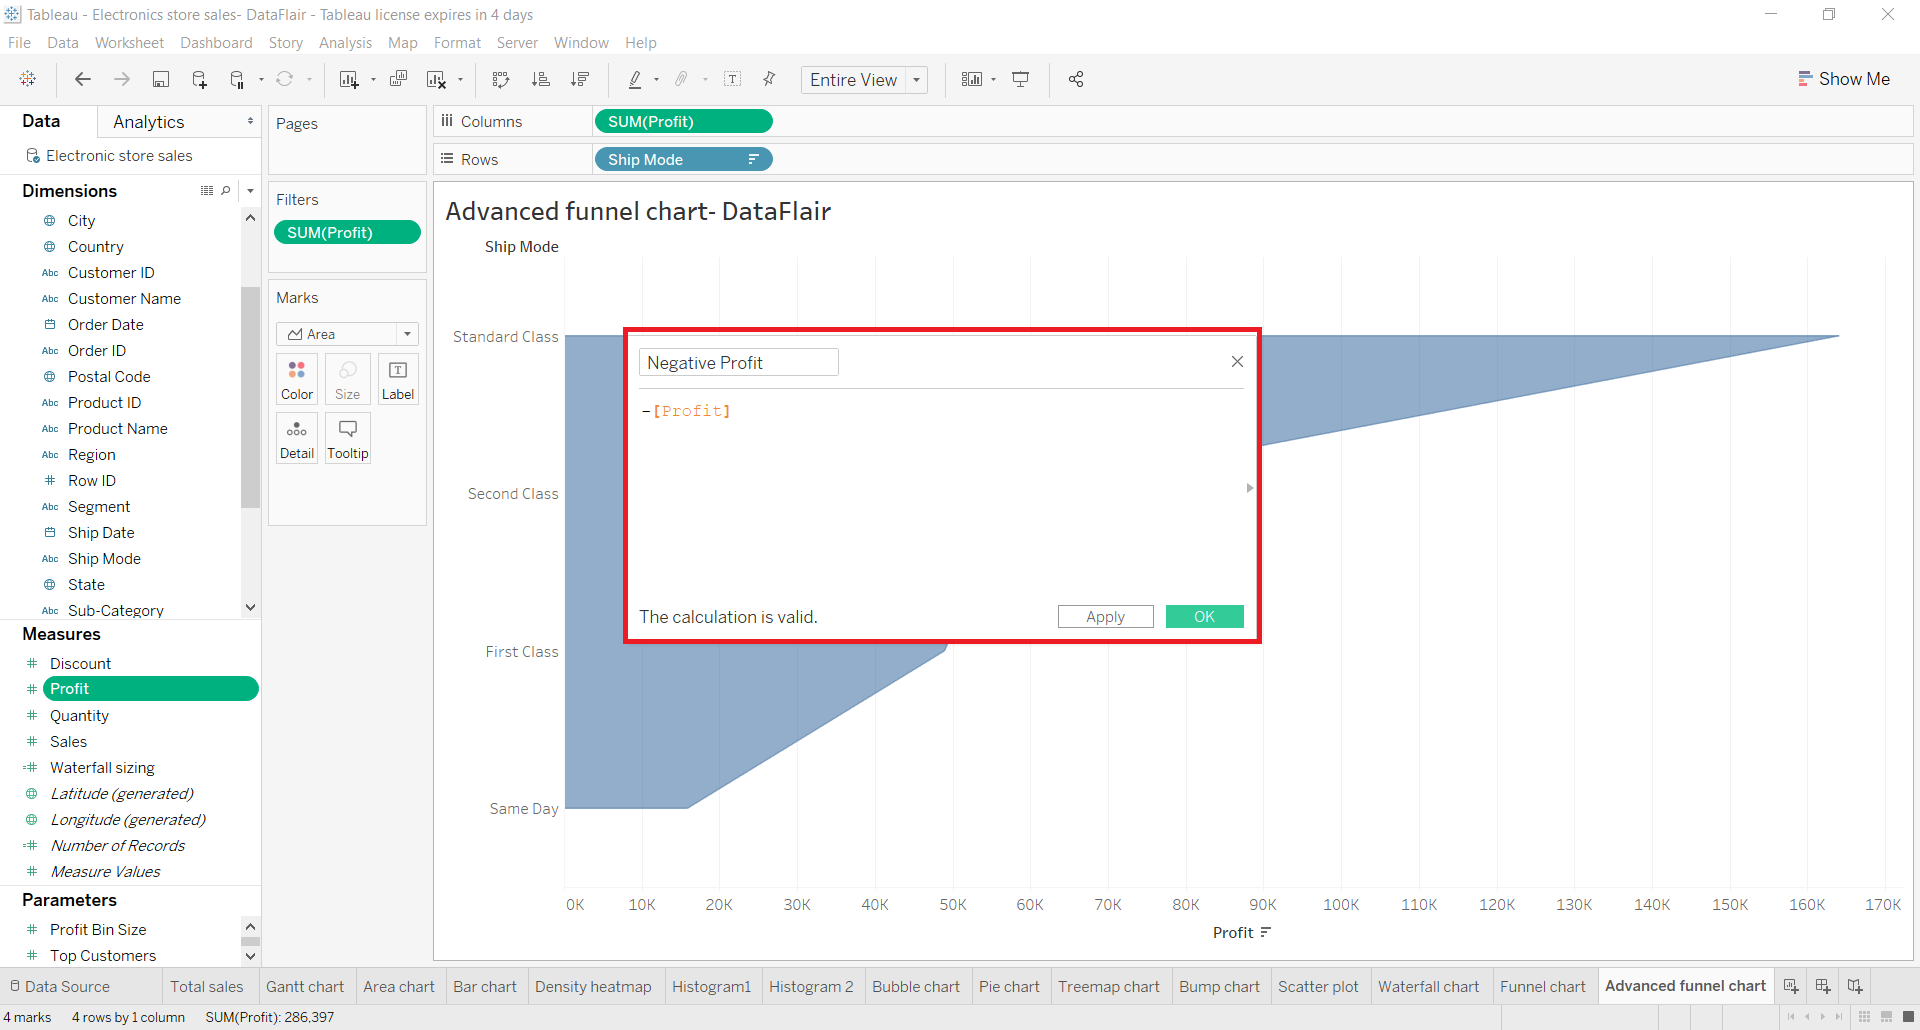
Step 4: Add Negative Profit in Column Section
As soon as we apply the formula for the calculated field, the new field name will appear on the Measures list. We take the newly created Negative Profit field and put it in the Columns section. This will add one more field on the chart giving it a funnel-like shape.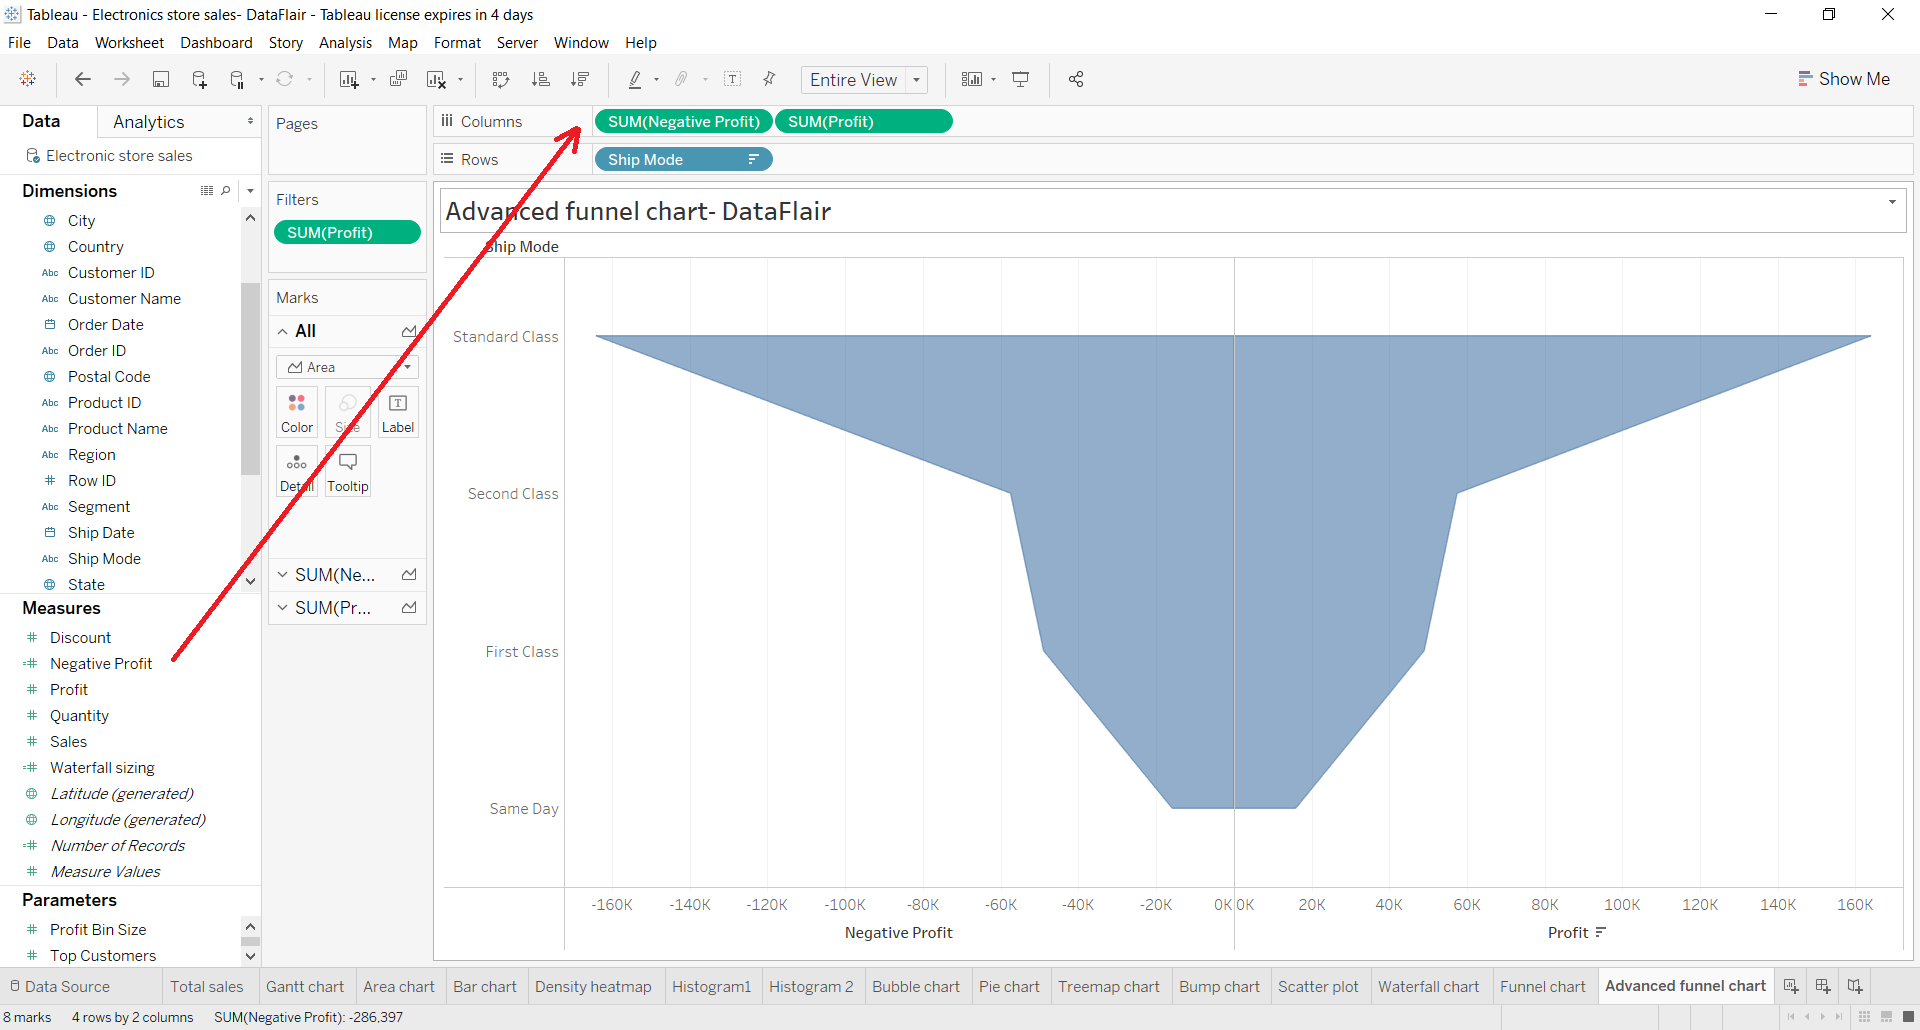
Step 5: Add Ship Mode Dimension and View Negative Profit
Now, we add a dimension called Ship Mode to the Label card present in the Marks section. This will add text labels showing shipping modes on the left of the chart. Also, we give a distinct color to the left half of our funnel chart that shows a negative profit.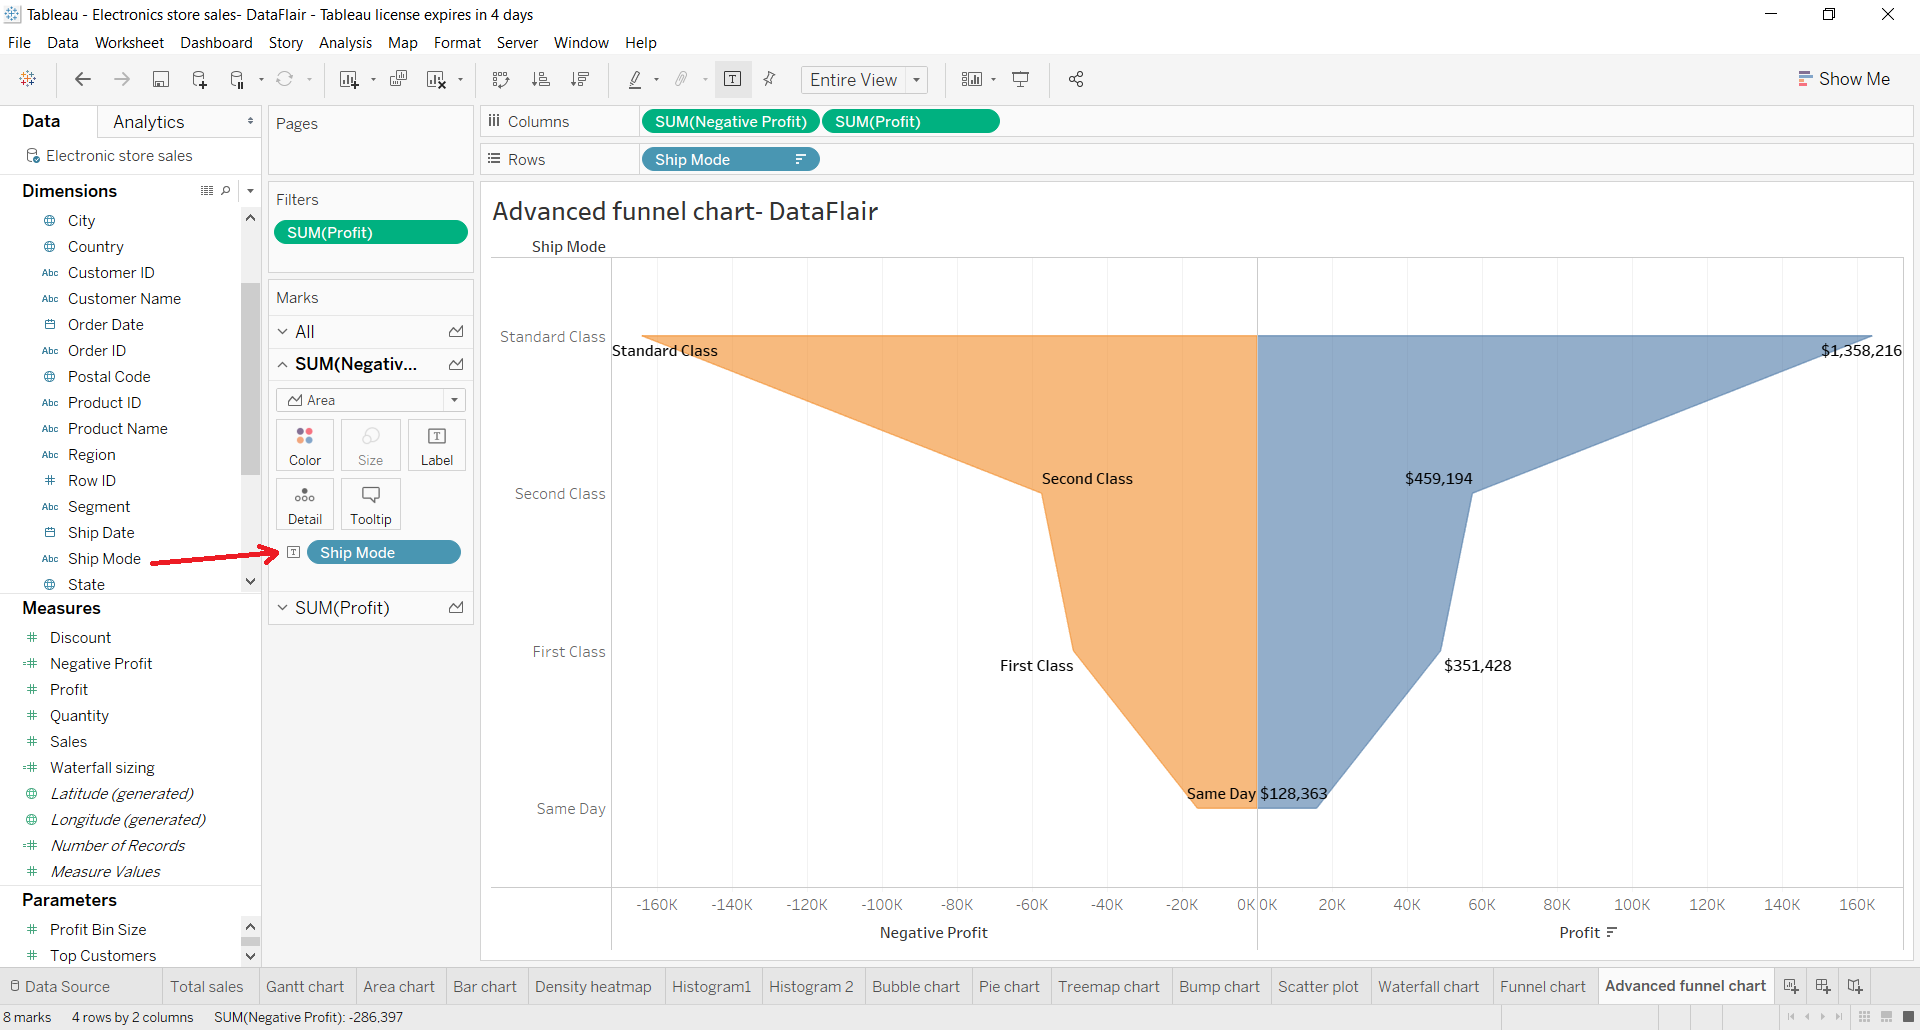
Similarly, we add a measure named Sales or SUM(Sales) in the Labels card of Marks section. This adds labels pertaining to total sales on the right half of the funnel chart.
Step 6: Finalise Advanced Funnel Chart
In this way, we made an advanced, also known as smooth funnel chart in tableau which shows both the shipment mode and total sales done with respect to each shipment mode.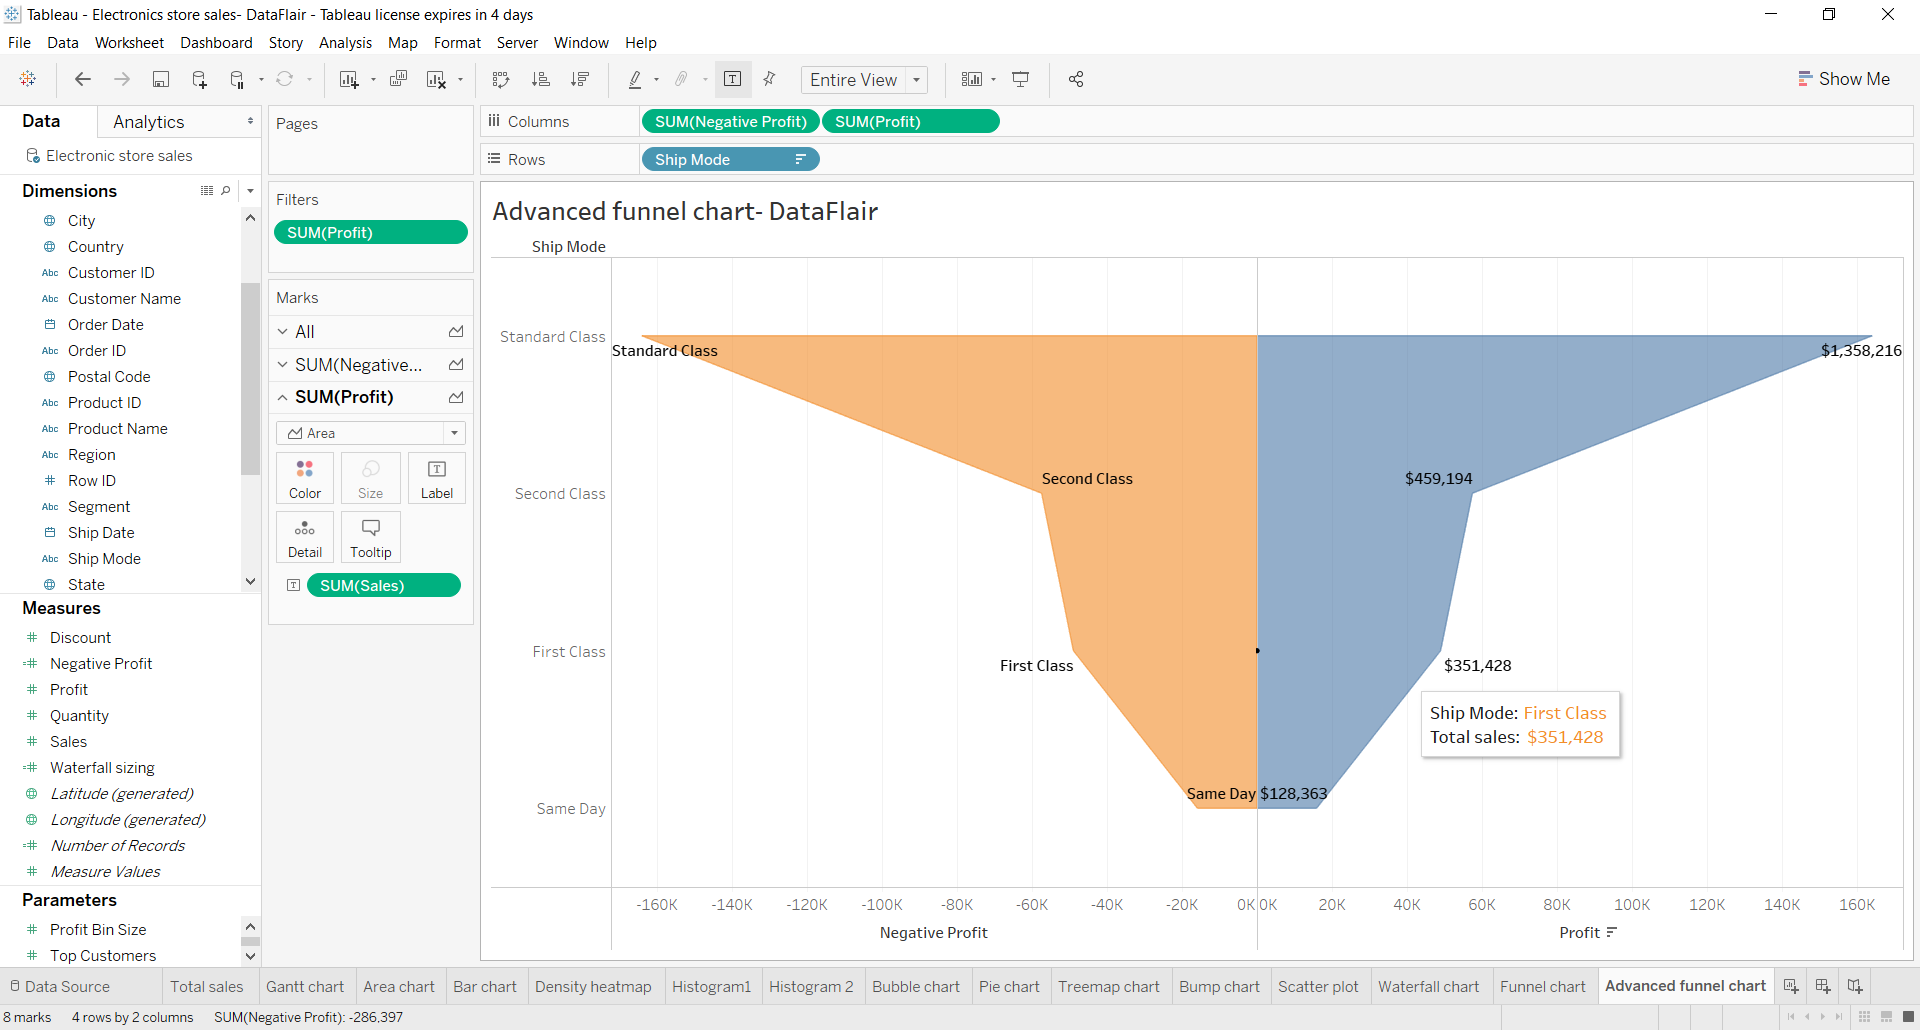
Summary
We hope you found our tutorial on Tableau funnel charts useful. You can now easily create a funnel chart on your own using your dataset in Tableau software.
Now!! You should explore the Area Chart in Tableau.
If you have any queries or find any trouble in understanding any of the steps in this tutorial, mention through comments. We will be happy to help you.
Happy Learning😃
Your opinion matters
Please write your valuable feedback about DataFlair on Google


