Tableau Architecture – 8 Major Components of Tableau Server Architecture
FREE Online Courses: Transform Your Career – Enroll for Free!
In our effort to learn the new BI tool, it is crucial to learn about Tableau architecture. By knowing what’s under the hood, you will be able to have a good technical understanding of the tool. In this tutorial, we will discuss the Tableau architecture and understand its functioning in detail. Followed by the general understanding of Tableau’s working. Along with this, we will learn the Components and Architecture of Tableau Server.
So, are you ready to explore Tableau Architecture?
Tableau Architecture
So, let us first get the bigger picture clear in our heads; let’s talk about the entire architectural framework that Tableau operates in. It can be categorized into three main segments. The segments are –
- Data Sources
- Tableau Server
- Tableau Desktop and the clients.
1. Data Source
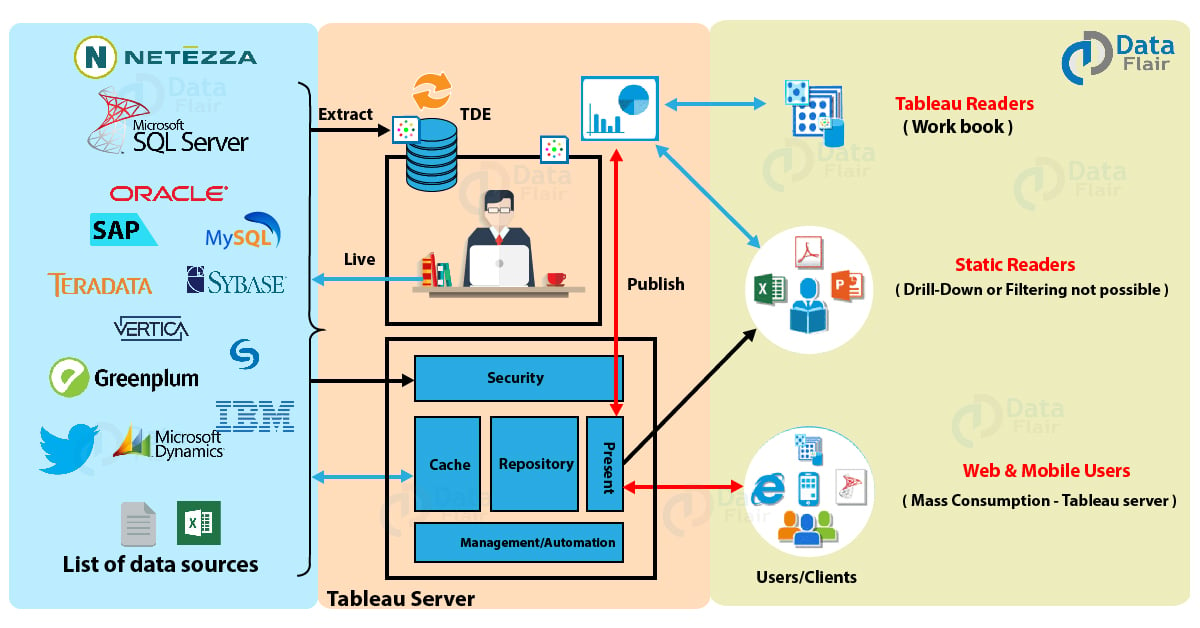
The first section of Tableau architecture is where a user can extract data from a gamut of data source options available like SAP, Oracle, Salesforce, Excel file, MySQL, Teradata etc. A user can establish data connection in two ways; a live data connection which sends instant queries to the data source and gets results instantly. Another way is to extract data from the data source and have a local copy of it as a temporary database. Data can be fetched through a live connection or extraction into both Tableau Desktop and Tableau Server.
2. Tableau Server and Desktop
Before getting to Tableau Server, let us first discuss the Tableau Desktop as it is the platform through which a user gets the ball rolling for further actions to take place. Because depending on the user’s request the actions for all the other architectural components are assigned. Tableau Desktop acts as an authoring tool where users create visualizations, workbooks, and dashboards using the data from the data source in Tableau. These workbooks or visualizations can be shared to users in many ways. It can be shared to static users (just to view), to a web or mobile clients, workbook packages can be shared to the Tableau Reader where users can view as well as edit the visualizations. Also, the visualization can be published or loaded into the Tableau Server.
The Tableau Server has many components working together as it manages a bunch of important processes. It has components taking care of the user and data security, a repository which stores all the visualizations published to the Server, a cache for performance improvement, a manager/automation to manage data loads and schedule updates, a presentation layer which is responsible for all the visualization/presentation related activities. The Tableau Server primarily serves the dynamic user base of the web and mobile customers interacting with the data on Tableau platforms.
Do you know how to create a Tableau dashboard?
3. Clients
The clients are the end users using Tableau through a web, mobile devices, on-cloud, on-premise, or on a command-line interface for development. These end-users interact mainly with Tableau Server for accessing workbooks or visualizations. The server components then work as per the client’s request and return the outcome.
Tableau Server Components
As we discussed in the section earlier, Tableau Server is an important component in the Tableau architecture as it is thoughtfully designed to manage and execute crucial processes. It is important for us to understand what’s under the hood of Tableau Server as it is a core component and helps to understand Tableau better.
Let us go through the components of Tableau Server and learn how they work.
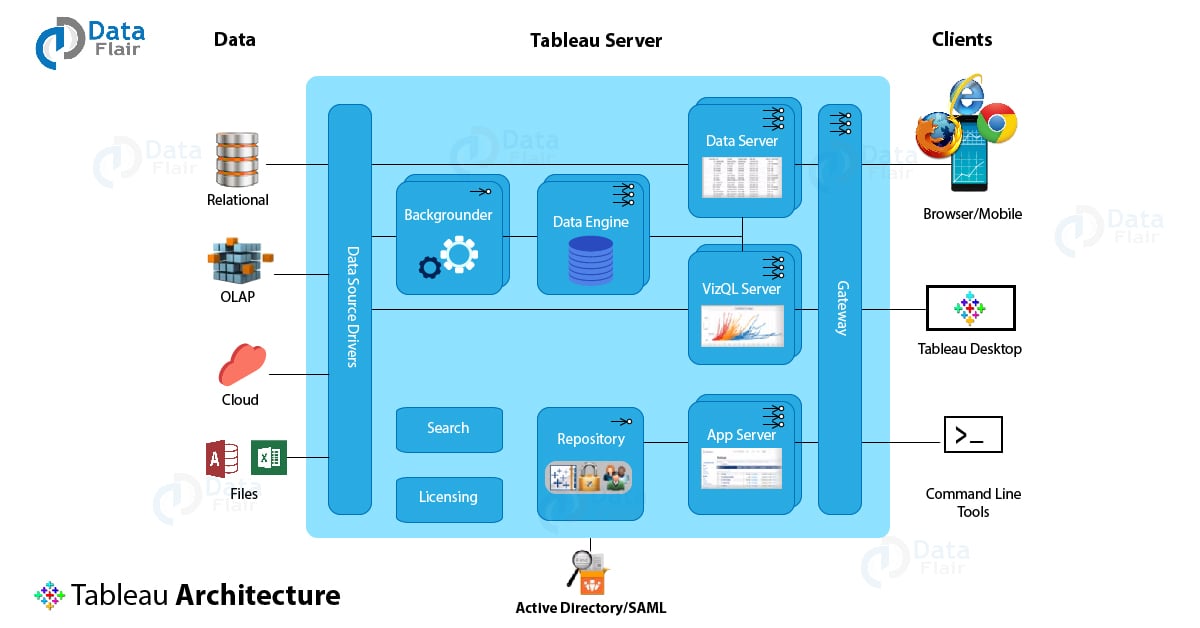
1. Gateway
Gateway is a kind of web-server that helps clients communicate to the server via HTTP or https. The server receives incoming client requests and directs them to the appropriate server for action. A gateway handles processes such as load balancing, traffic routing, URL rewriting, serving static files to clients, serving multi-thread processes etc. The gateway server used by Tableau is Apache Tomcat.
Also, see – Creating URL action in Tableau in 5 min.
2. Application Server
Gateway interacts primarily with the application server, also known as a workgroup server. The application server deals with login processes, domain authentication, data authorization, user or group permission management, content searches, etc. It works in close association with the server’s repository and handles the data access operations. Also, it renders processes related to the user interface other than the visualizations which are the work of the VizQL server. The user interface is the page that gives the users an overview of the workbooks and projects they have access to.
3. Repository
The repository in Tableau Server stores server metadata related to users, permissions, assignments, groups, and projects. Along with the metadata, it stores visualizations in flat files (TWS, TDS), and performance data for auditing. Whenever a server service or component demands for metadata, it is provided from the repository. Also, it cooperates with the active directory to provide useful information to the app server for login verification processes.
4. VizQL Server
It is an important component of Tableau Server as it is responsible for loading all the visualizations that you see and work with on Tableau. It has an in-built caching for performance improvement and editing tasks. Whenever a user requests a visualization or wishes to update an existing one, the request received by VizQL is first converted into an SQL statement and sent down to the data sources via respective data source drivers. The requested data sent back from the data source comes to the VizQL server again, where it is processed with some final touches of additional calculations and sent to the user. Any new visualization coming from the data source is cached in the VizQL for further use.
5. Data engine
The data engine is another efficient component which handles processes related to Tableau data extract (TDE). It is invoked only when a query is shot, which involves data from TDE. The data engine stores multiple TDEs and can run on multiple servers maximum 2). It also attends multiple requests parallelly at a given point of time. The data engine hosts the piece of data in-memory extracted from the TDE upon getting a request from the user.
6. Backgrounder
Backgrounder is an essential multi-process, a multi-process element that manages schedules for information refreshing and ensures proper functioning of the Tableau Server and Data Engine.
7. Data Server
The data server helps in centralizing metadata management, driver deployment, and extract management. It also contributes to access control and serves as a proxy to the data sources. It hosts user queries and requests to prevent users from directly accessing the data source.
8. Search and License
Two other important components are search and license. The search component manages the search indexing for the data in the repository. Whereas, the license component is responsible for the licensing and configuration of the Tableau server. Both these services run on the primary server of the Tableau’s server cluster.
Recommended Reading – Clustering & Visualizing Forecasting in Tableau
Tableau Server Architecture
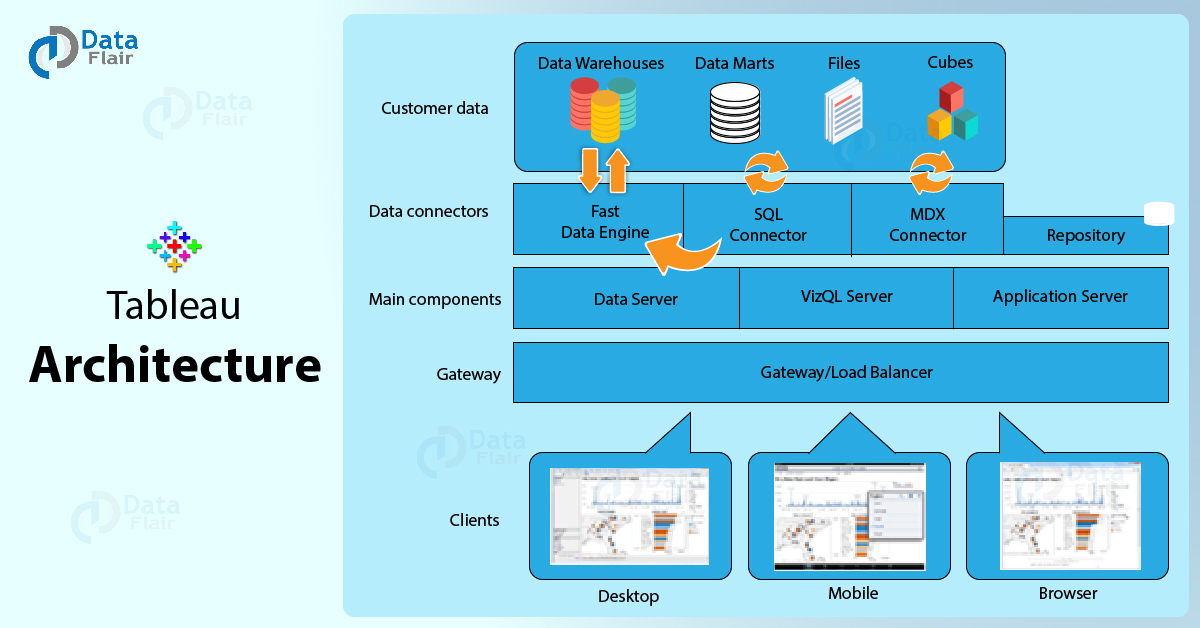
Tableau Server is essentially a communication tool which shares data connections and visualizations with the end-users or clients. So, now that we have learned about the functioning of each component in a Tableau server. Let us understand how all these components work in tandem. For this, we will club the server components into layers or tiers. So, we have five layers or sections in the Tableau Server; customer data, data connectors, main components, gateway, and clients.
- The customer data layer contains all sorts of data sources available for a Tableau user like data warehouses, data marts, flat files, and multi-dimensional cubes, relational databases.
- Next lies the data connectors layers which consist of a data engine, repository, SQL Connector, and MDX Connector. These components interact directly with the data sources. The Data engine processes the data requested by the user and assigns the data type, decides whether it is a measure or a dimension, and creates TDEs (data extracts). At the background of the data, engine runs an SQL Connector which creates an SQL query for all the user requests and interacts to the data sources. The SQL Connector primarily deals with data marts and flat files. Similarly, the MDX Connector deals with the multi-dimensional cubes.
- The next layer comprises of all the main components, essentially the data server which regulates and monitors the functioning of the components of the data connector layer. Along with this, it includes a VizQL Server and Application Server. The application server takes all the user requests coming from Tableau Desktop, mobile or browser for accessing the visualization. It processes the requests and detects the type of request, checks user authorization and grants access accordingly. The VizQL Server is a patented component of Tableau, where VizQL stands of Visualization Query language. It works behind the logic of Tableau visualization and creates the visualization as per your instructions on the dashboard.
- As we have already learned about the gateway, it acts as a gatekeeper of the Tableau Server and any request or query sent by the client first hits the gateway or load balancer. A gateway is nothing but a primary server which receives the queries and redirects it to an appropriate and available secondary server, known as worker server.
Must refer – Tableau Performance Optimization
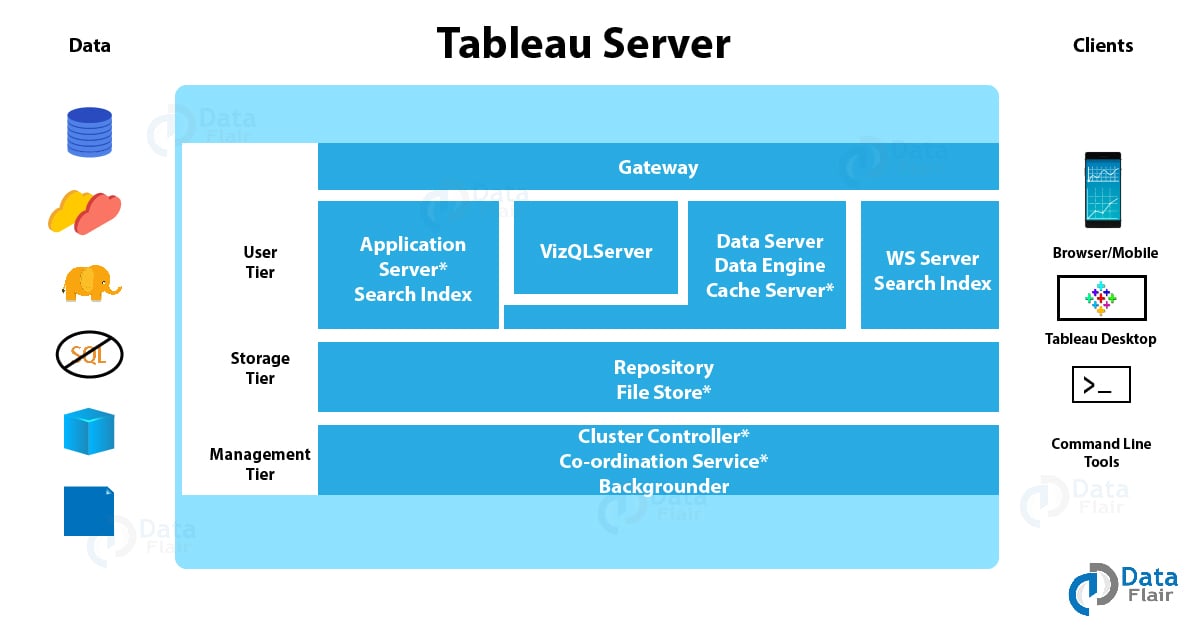
One more way to organize the Tableau Server architecture is in a tier-based model. In such a model, the architectural components are grouped into three tiers, i.e. a user tier, storage tier, and a management tier.
Summary
So, this concludes our lesson on Tableau architecture. We have learned the architecture of Tableau and the architecture of Tableau Server. Along with this, we studied each component of Tableau Server in good detail and tried to understand the server architecture from a section-based and tier-based perspective. Hope, you liked this tableau tutorial. You may also like 5 Best books to learn Tableau.
We will love to hear your feedback!
Your opinion matters
Please write your valuable feedback about DataFlair on Google


Just awesome, the way things are explained are commendable. The language is so easy and crisp can’t explain in words.
Very neat Explanation
Very well-explained!
very well explained