Tableau Reference Lines – Add Reference Lines in Tableau
We offer you a brighter future with industry-ready online courses - Start Now!!
In this Tableau tutorial, we will study what is Tableau Reference Lines with example and the steps involved in creating / Adding reference lines to the Tableau Bar Chart. So, let us start!!!
Tableau Reference Lines
A reference line in Tableau is simply a line that gets drawn on a chart that represents another measure or point of reference. These are useful in providing context to the related chart. For example, a line showing the median will visually show the difference of each mark in the chart relative to the median.
Read about Tableau Constant Line in detail
How to Add Reference Line to Bar Chart in Tableau?
Using the following steps, we can create Reference lines in Tableau.
i. From Dimensions, drag Year to Rows.
ii. From Dimensions, drag Genre to Rows to the right of the Year pill.
iii. From Measures, drag Worldwide Gross Amount to Columns.
iv. Hover over the Worldwide Gross Amount axis, and click on the sort icon once to sort the bars in descending order.
Let’s Study About Tableau Stacked Bar Chart
v. On the sidebar, click on the Analytics tab to activate it.
vi. Under Custom, drag Reference Line from the Analytics tab and drop it onto the Table placeholder:
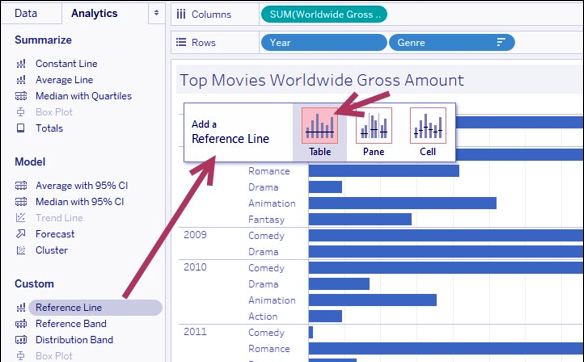
Step. 6 Adding Tableau Reference Line in Bar Chart
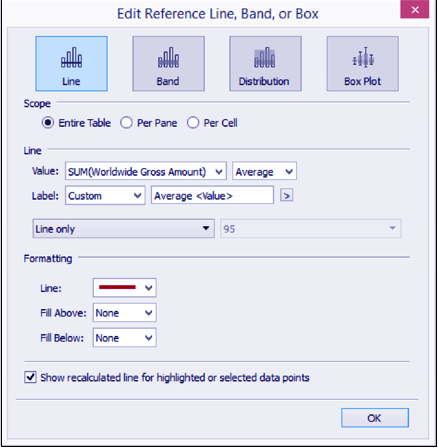
vii. Set the following for this Tableau reference lines:
- Scope as Entire Table
- Under Line, setValue, set the aggregation to Average of the SUM(Worldwide Gross Amount)
- Under Line Label, set it to Custom with Average <Value> as text; note you can use the > button to insert values
- Under Formatting, set Line to a thick, dark red line
- Under Formatting, set Fill Above: to None
- In Under Formatting, set Fill Below: to None:
Step. 7 Adding Tableau Reference Line in Bar Chart
Let’s look at Tableau Trend Line and How to Create Trend Line
viii. Click OK when done.
ix. Under Custom, drag Reference Line again from the Analytics tab and this time drop it onto Pane.
x. Set the following for reference lines in Tableau:
- A scope is Per Pane
- Under Line Value, set the aggregation to Average of the SUM(Worldwide Gross Amount)
- Under Line Label, set it to Value
- In Under Formatting, set Line to a thick gray line
- Under Formatting, set Fill Above to None
- Under Formatting, set Fill Below to a light yellow color
xi. Click OK when done.
Conclusion
Hence, in this Tableau tutorial, we studied about Tableau reference lines, steps involved in creating and adding them in Tableau bar chart. Furthermore, if you have any queries, feel free to ask in the comment section.
You give me 15 seconds I promise you best tutorials
Please share your happy experience on Google


