Tableau Text Table | Tableau Crosstab
FREE Online Courses: Your Passport to Excellence - Start Now
1. Objective
In this Tableau tutorial, we are going to study what is Tableau Text Table or Tableau Crosstab, various steps to create text table in tableau them and how we can use Crosstab in Tableau.
2. Tableau Text Table
Tableau text table or Tableau Crosstab, a shortened term for cross tabulation. Another common term that can be used to describe text tables is a spreadsheet. A text table is a series of rows and columns that have headers and numeric values. Tableau Text table is great when the audience requires seeing the individual values. A limitation of tableau crosstab is that it requires attentive processing—whoever is using the text table needs to focus on reading and comparing the numbers because any patterns or insights are not very easy to spot.
Follow this link to know about Tableau Design Flow & Tableau FIle Type in detail.
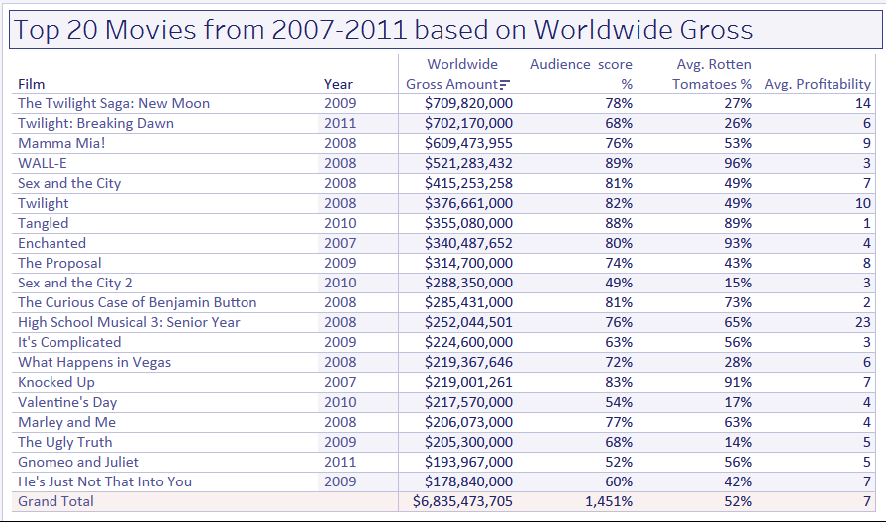
In this recipe, we will create a Tableau text table that shows the top 20 movies from 2007-2011, based on the worldwide gross amount.
3. How to Create Text Table in Tableau
i. Change the default number format of Audience score %. You can do this by right-clicking the field Audience score % in the Measures section of the sidebar, selecting Default properties and then Number Format…. In the window that shows up, set the following:
- Number (Custom)
- Decimal places: 0
- Suffix %
ii. From Dimensions, drag Film to Rows.
iii. Now from Dimensions, drag Year to Rows.
Let’s revise Adding Worksheets And Renaming Worksheet In Tableau in detail.
iv. From Dimensions, drag Film to Filters. This will open a window with several options for filtering the Film
v. Select the Top Choose By field: and specify Top 20 by Average Rotten Tomatoes %, as shown here:
vi. From Measures, drag Worldwide Gross Amount to Text in the Marks
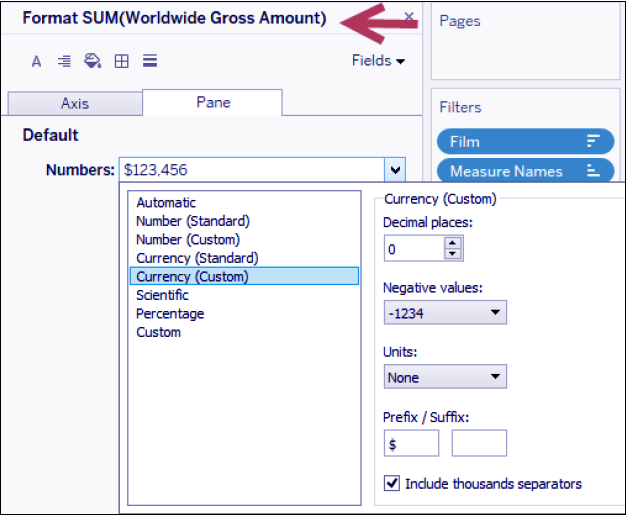
vii. Right-click on the Worldwide Gross Amount pill in the Marks card, and choose Format.
viii. Format the Pane tab to use:
- Currency (Custom)
- Decimal places: 0
- Prefix: $
Technology is evolving rapidly!
Stay updated with DataFlair on WhatsApp!!
ix. Double-click on Audience score % in the Measures This adds this measure to the text table. This also introduces a new Measure Values shelf in your canvas.
x. From Measures, double-click on Rotten Tomatoes % to add this to the text table.
xi. Change the Rotten Tomatoes % aggregation to Average. You can do this by right-clicking on this pill in the Measure Values shelf, going to Measure (Sum), and changing this to Average.
Read about Tableau Heat Map & Dealing With Data Quality Problems In Tableau in detail.
xii. From Measures, double-click on Audience Score % to add this to the text table.
xiii. Change the aggregation of Audience Score % to Average.
xiv. From Measures, double-click on Profitability to add this to the text table.
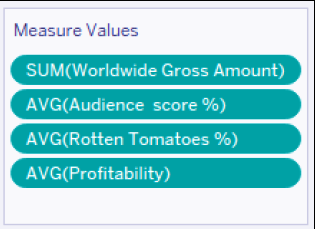
xv. Rearrange the pills in the Measure Values shelf by dragging them manually to have the following order:
xvi. Right-click the Film pill in Rows, and click on Sort….
xvii. In the Sort window, select:
- Sort order Descending
- Sort by field Worldwide Gross Amount using Aggregation of Sum
4. Conclusion
In conclusion, we learned about what Tableau Crosstab, consequently how to create Crosstab in Tableau, and also how to use tableau text table our software. Furthermore, if you have any query, feel free to ask in a comment section.
See Also- Tableau Paged Workbook & Steps to Create it
For reference
Did we exceed your expectations?
If Yes, share your valuable feedback on Google


