Tableau Motion Chart – Put your data into action with tableau motion
Interactive Online Courses: Elevate Skills & Succeed Enroll Now!
In this tutorial, we are going to learn about an interesting chart in Tableau, that is, Motion chart. Motion chart is an advanced chart which when you learn to create brings a lot of analytical convenience in your data analysis project. You can use tableau motion charts to gain important insights from your data. So first, let’s learn the concept of a motion chart in Tableau.
What is Motion Chart?
A motion chart, as the name suggests, is a moving or a mobile chart which gives us an idea of the trail or the path that data points follow and make a trend. A motion chart is similar to a line chart in which we plot a line on the x and y-axis.
But a difference between a line chart and a motion chart is that the motion chart moves from a starting point and goes to the endpoint leaving a trail of data points occurring in its path. Thus, using motion charts, we can see the highs and lows that our values are hitting in the course and conduct our analysis based on this information.
How to Create Motion Chart in Tableau?
Follow the steps given below to create a Tableau motion chart:
Step 1: Add Dimension Field in Column Section
To begin with, we need a dimension field to add in our Columns section. From our sample dataset of electronics store sales, we select a dimension field Order Date. Then we set our field value type to Month.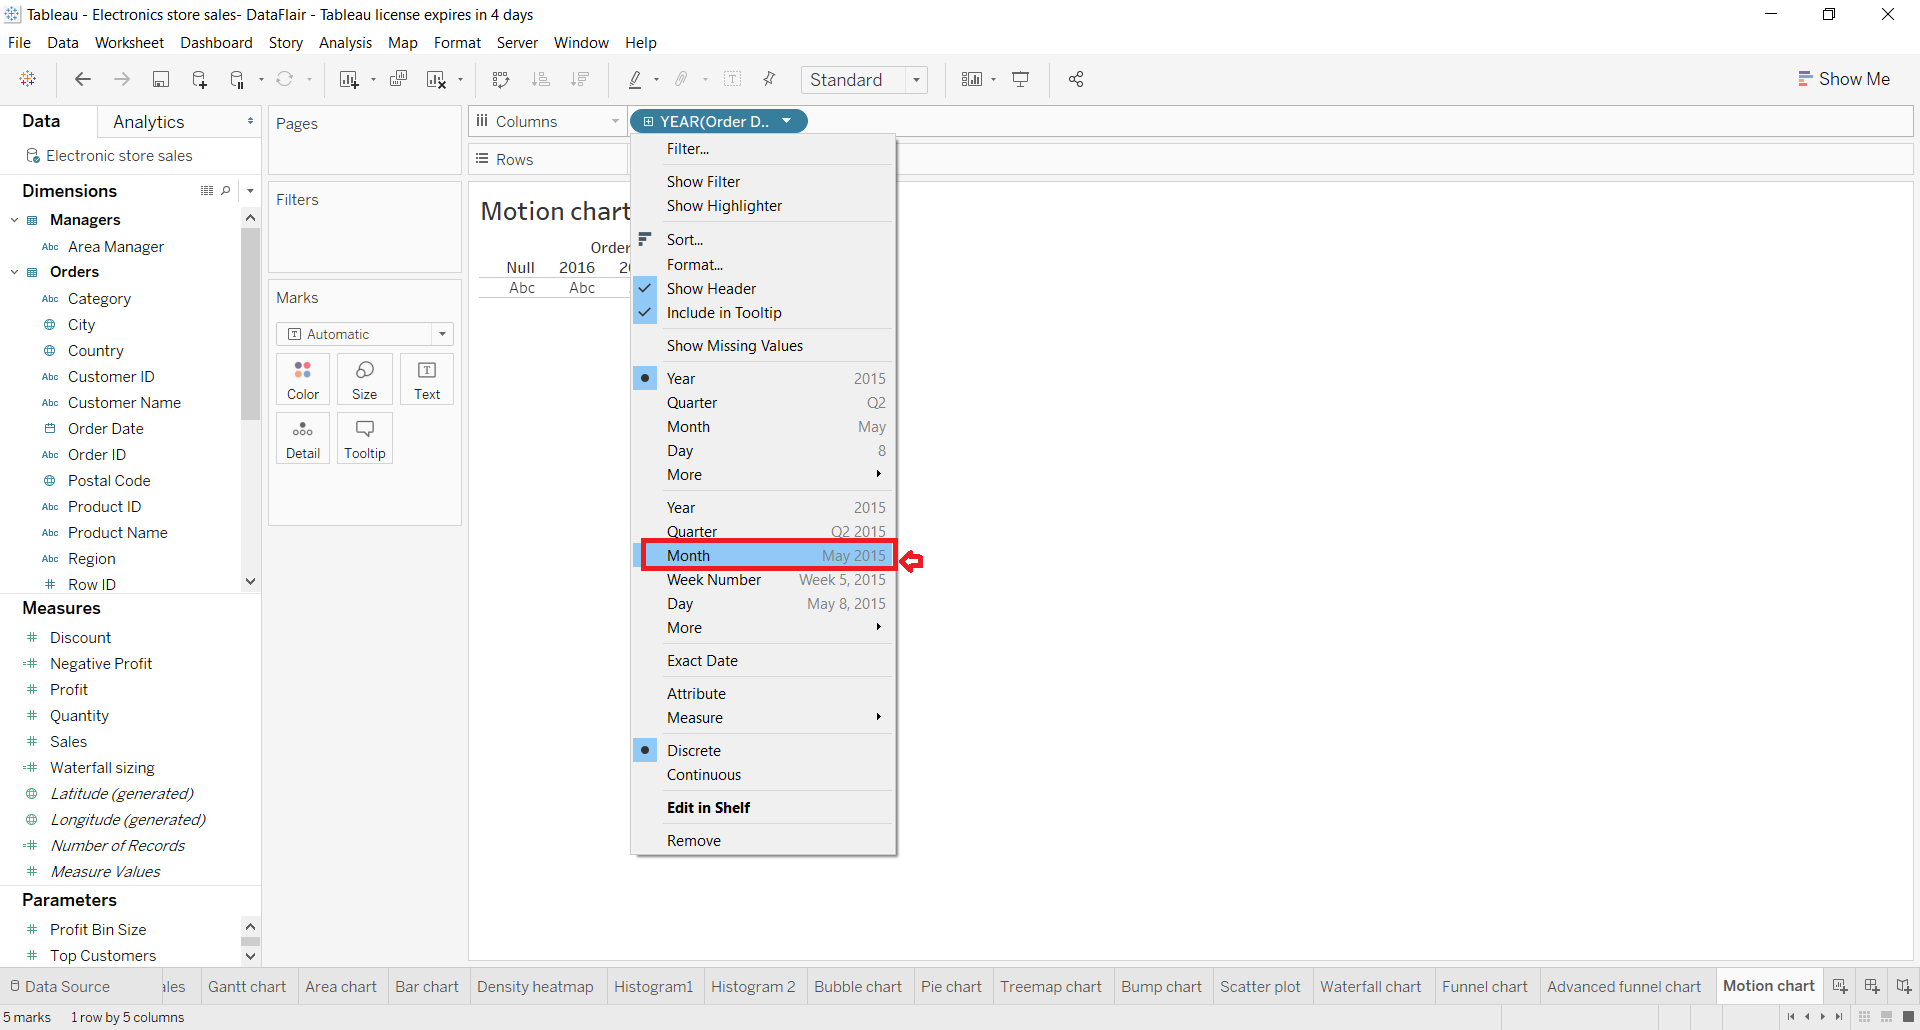
Step 2: Add Measure Field in Rows Section
Next, we add a measure field, Sales in the Rows section. As you can see, this creates a preliminary line chart on the screen.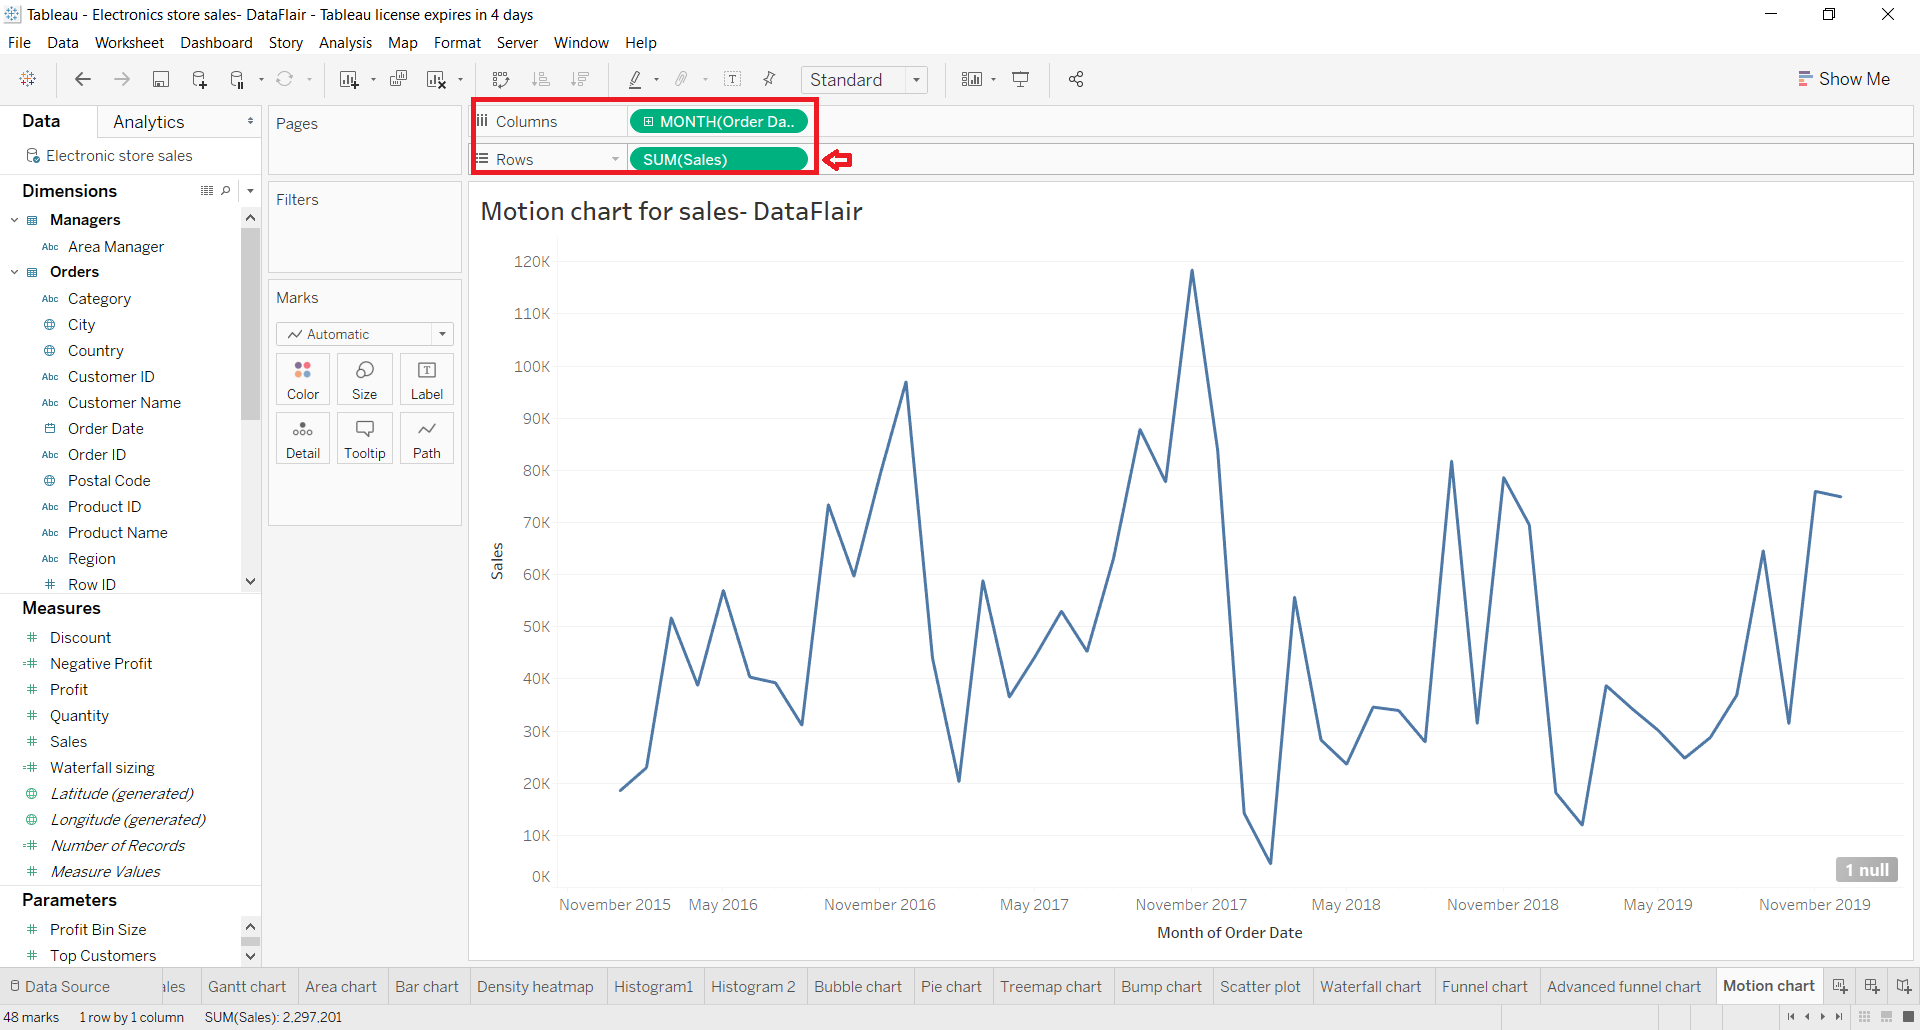
Step 3: Add Dimension Field into Page Section
This step is going to be a new one as we did not do this in any of the other charts so far. Here, we add our dimension field, Order Date into the Pages section as shown in the screenshot below. We change the field value type of this dimension as Month also.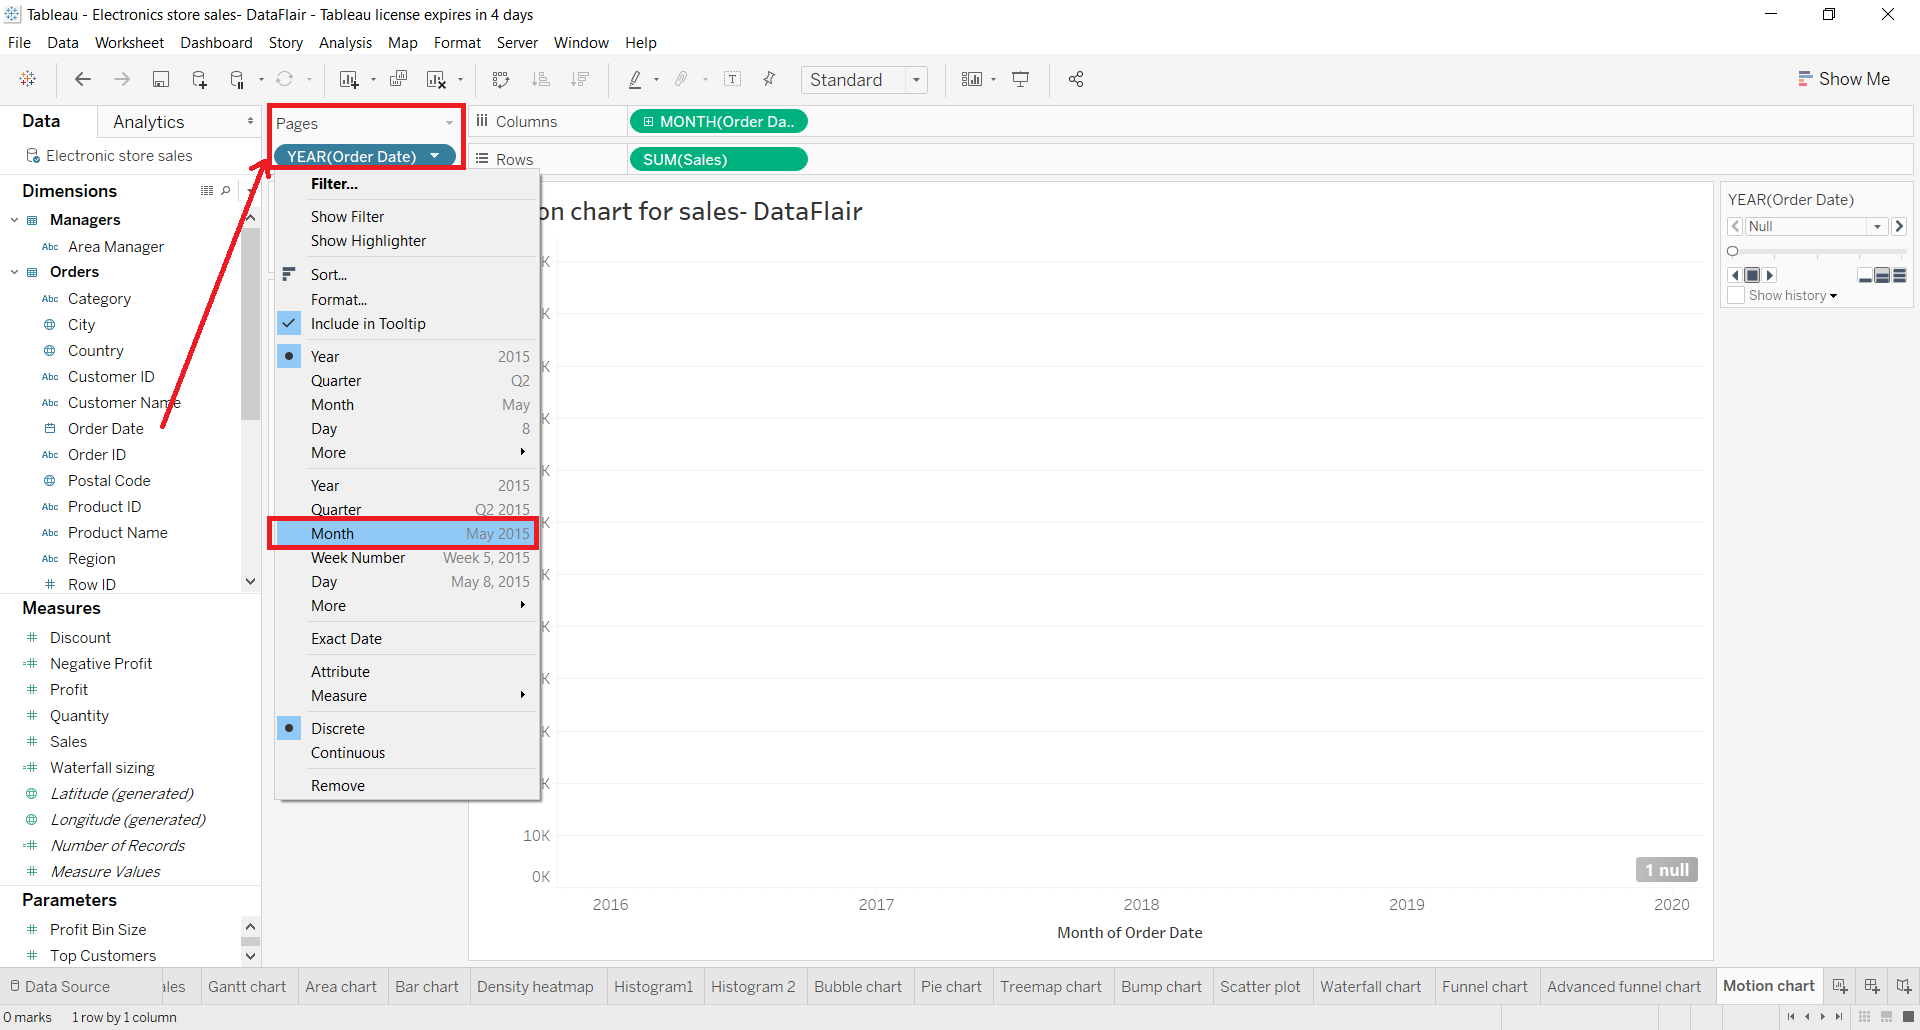
Step 4: Operate Motion Chart with Tableau Play-Pause Button
As soon as we add our dimension to the Pages section, a filter and play box appears on the right. From here, we can set a range of months or use the tableau play-pause button to operate the motion chart. In the next steps, we will learn to further use this filter-play box for our motion chart.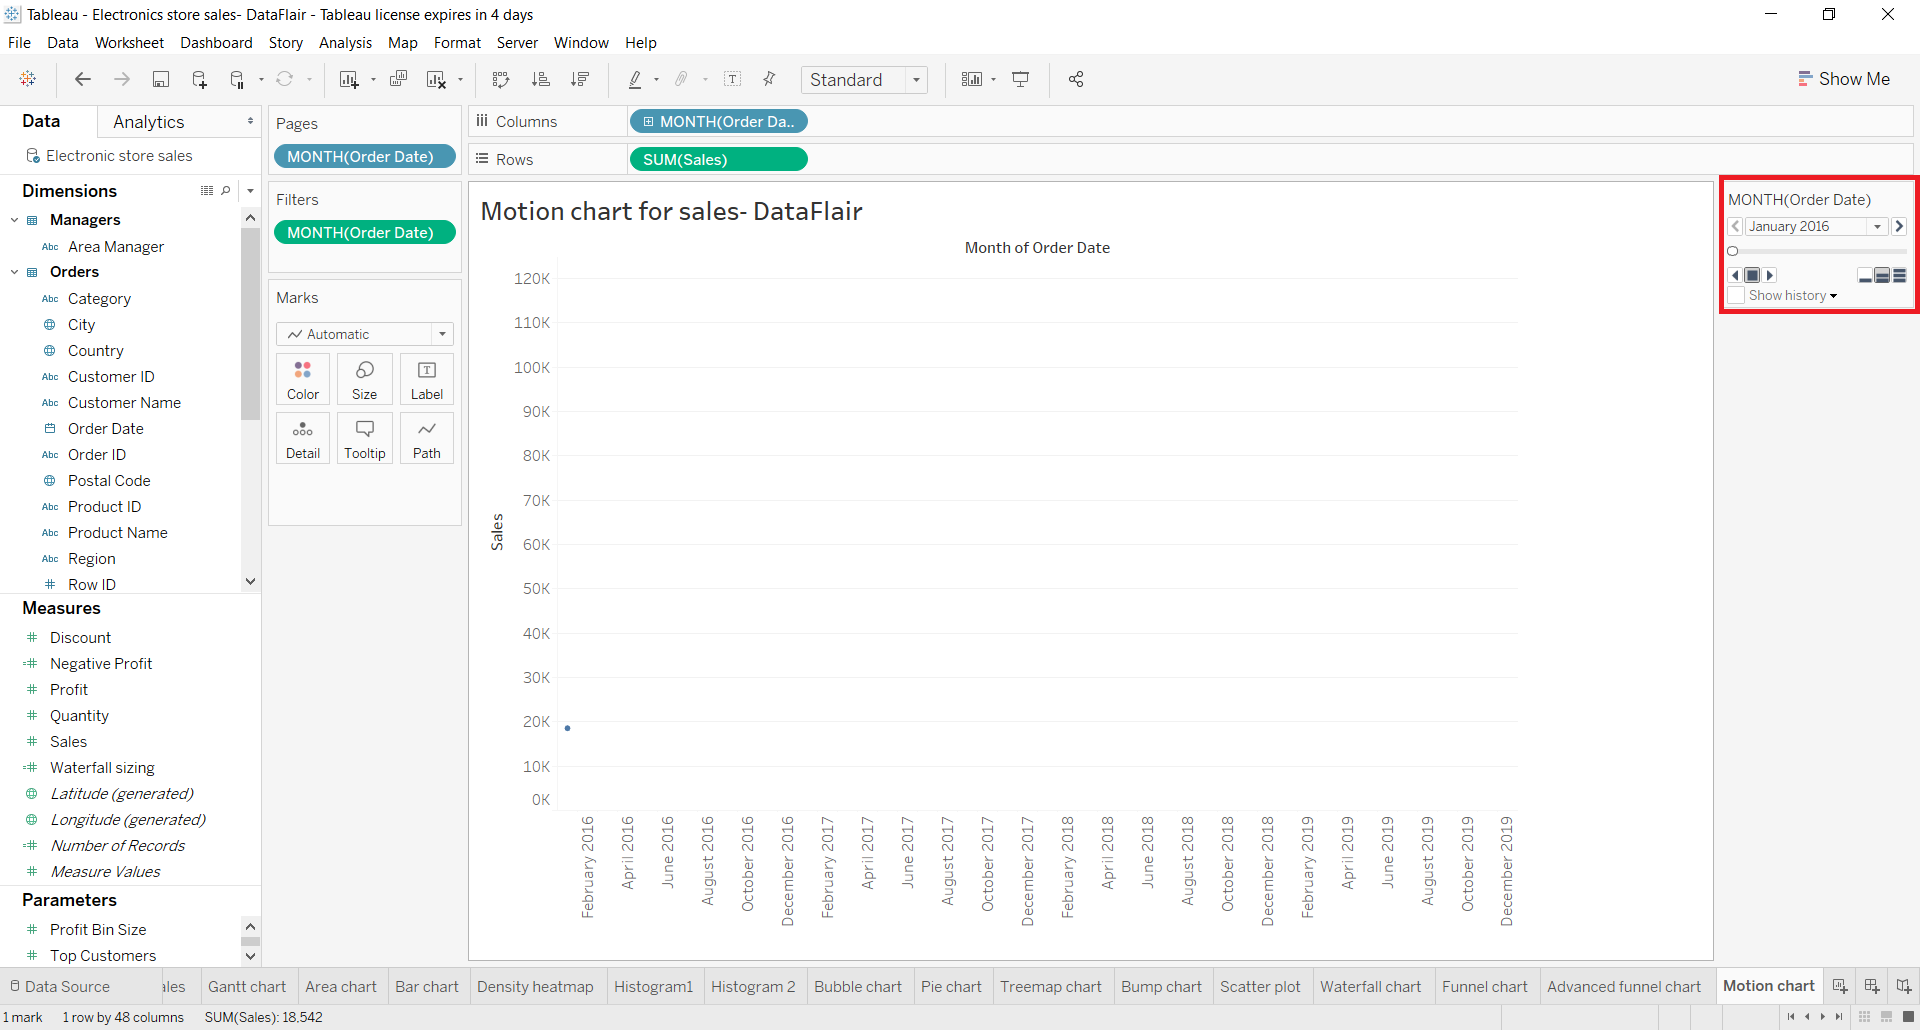
Step 5: Select Circle from the Marks List
Now, we select Circle as the mark type from the Marks list. This will show individual data points on the plot.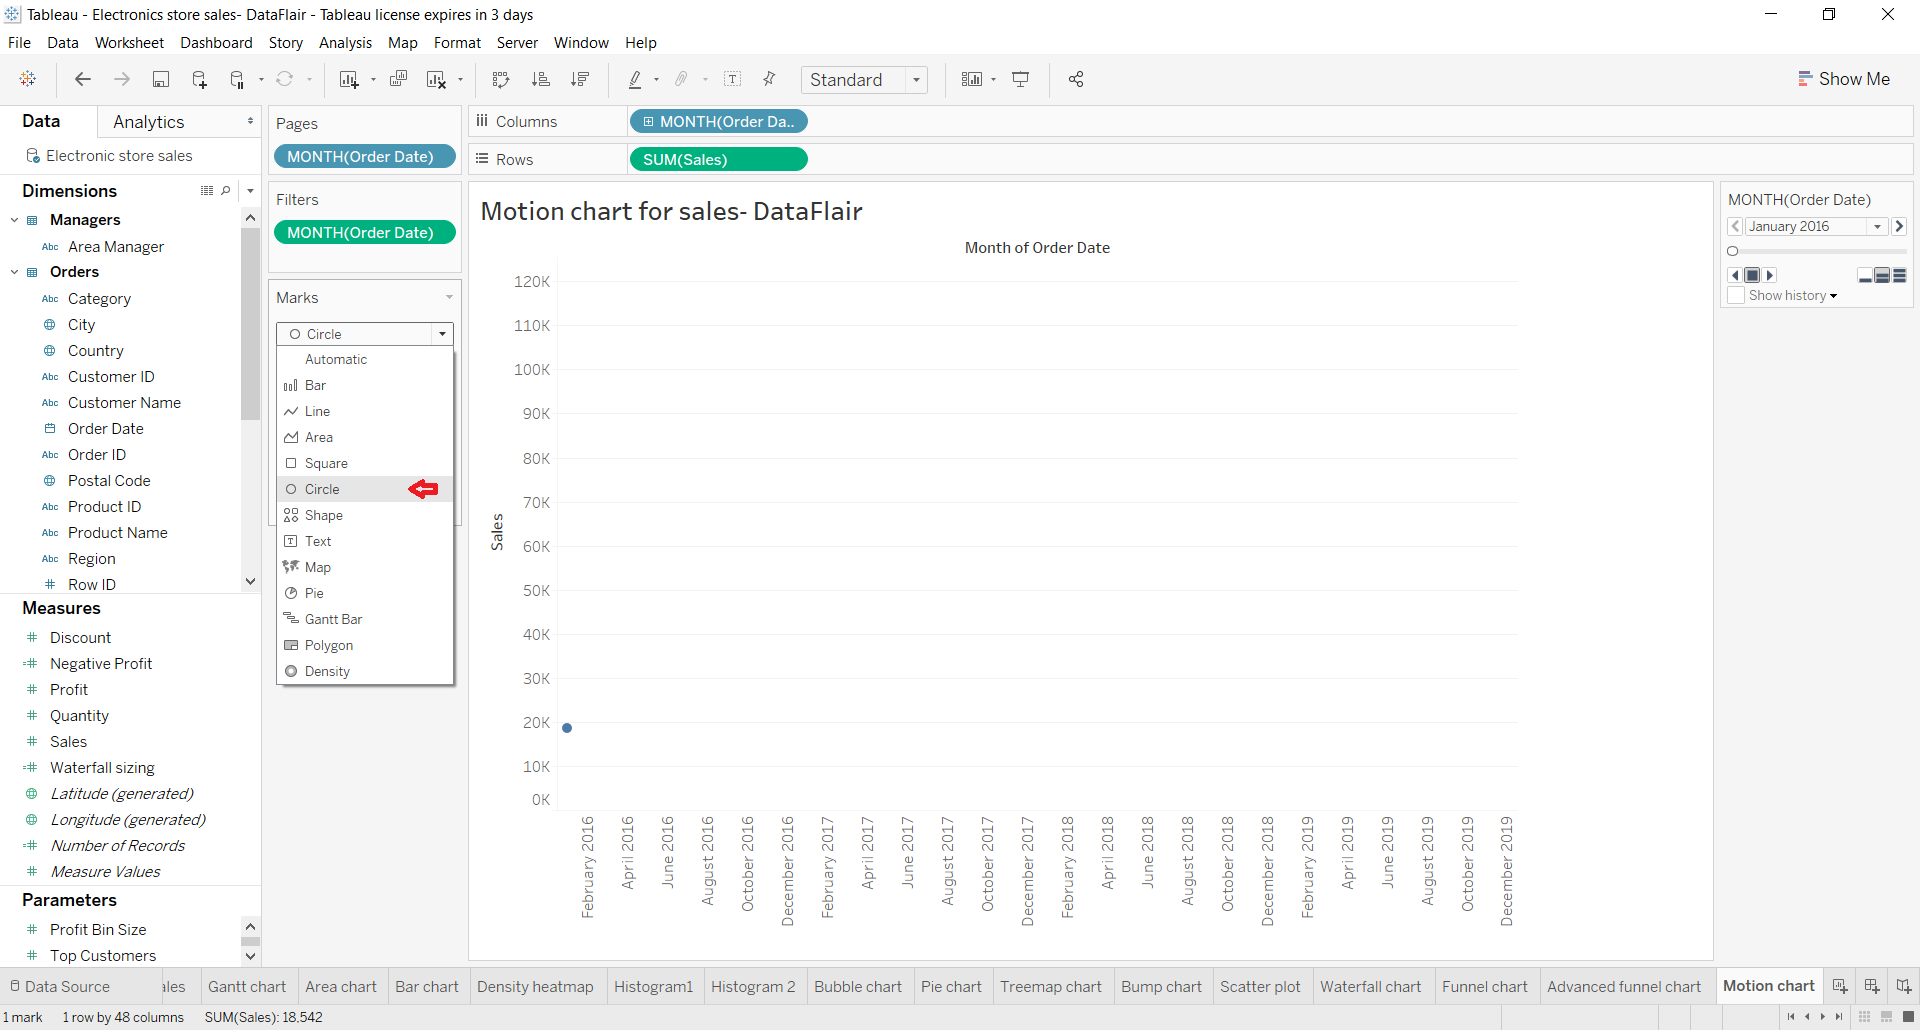
Step 6: Go to Show History to Make Changes in Motion Chart
Now, we need to make some changes in the settings to create a motion chart with data points and a trailing line. To do this, go to the Show history option. We can set a lot of options for our line from here such as length, show, marks, etc.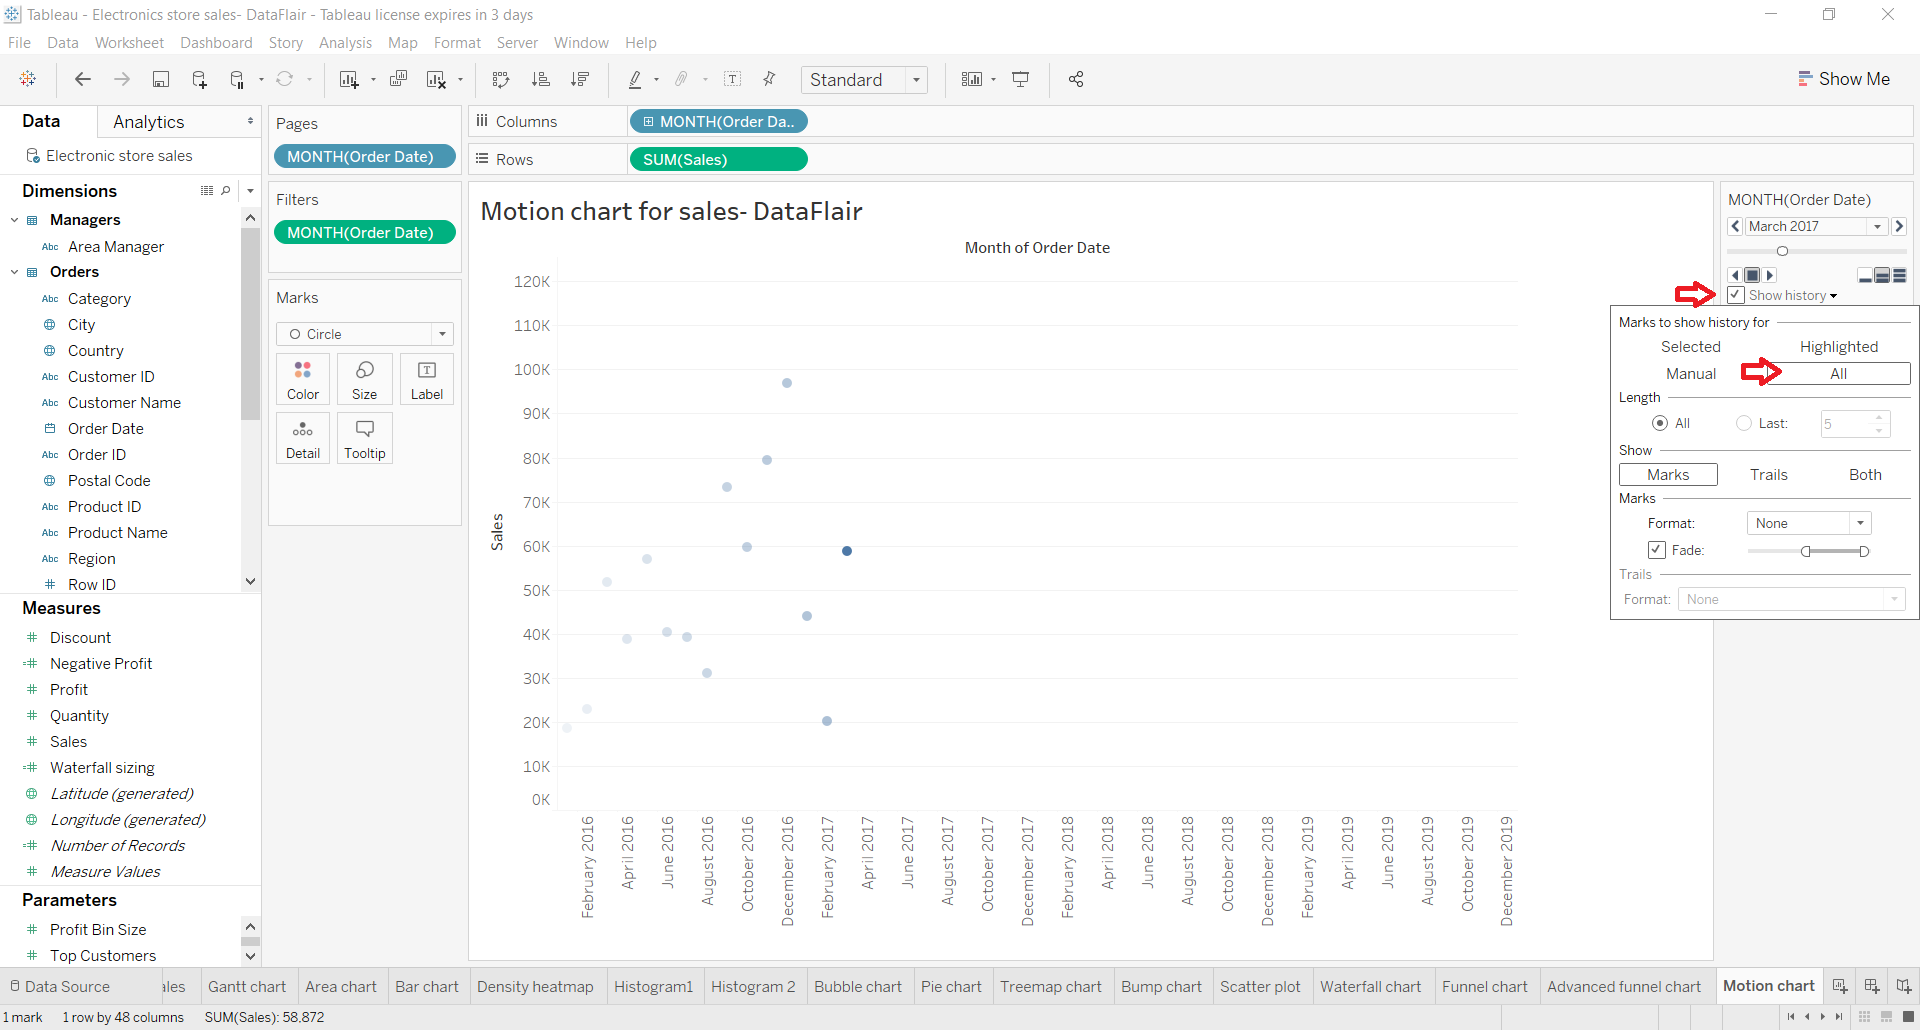
Step 7: Select Both Option in Tableau Motion Chart
We select the option Both so that our motion chart has both data points and trailing line when it moves from a start point to an endpoint.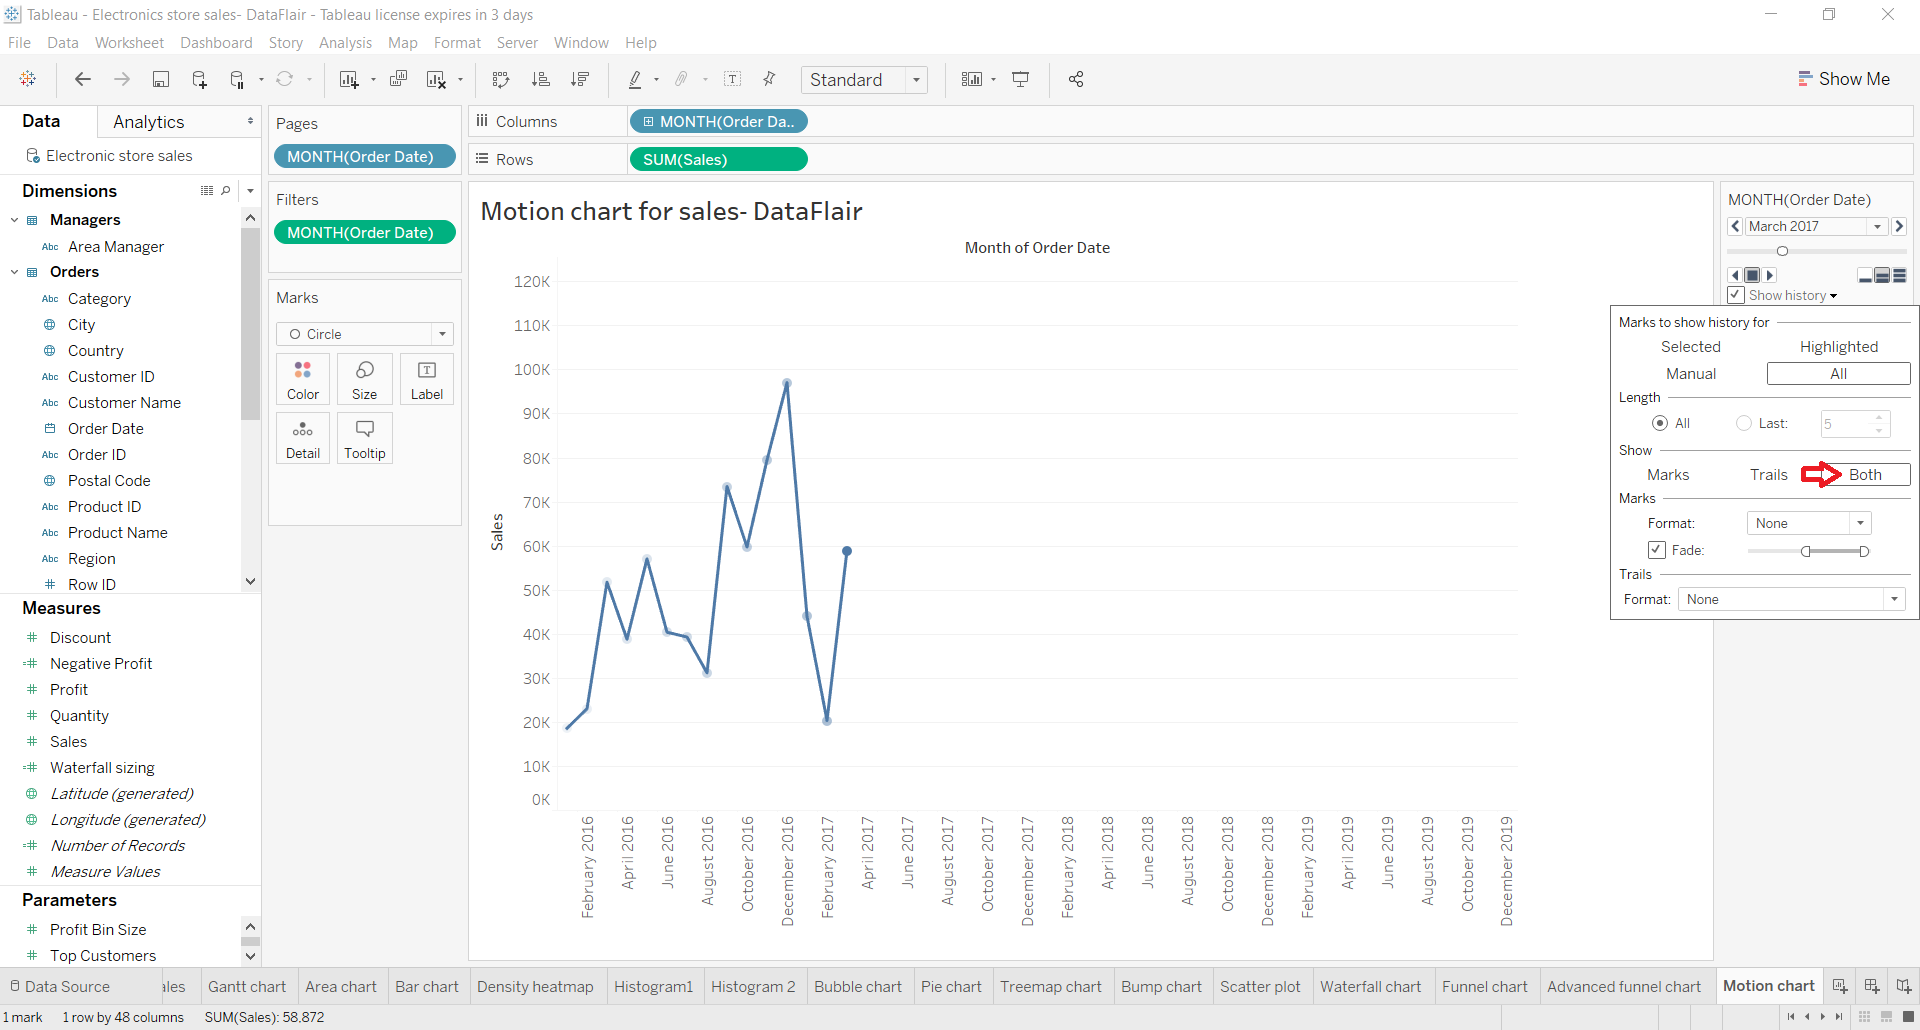
Step 8: Click on Tableau Play Button
Now, clicking on the play button as shown in the screenshot below, our motion chart starts from one point, moves towards the right following the trail of every data point and then finally terminates on the last data point on the plot.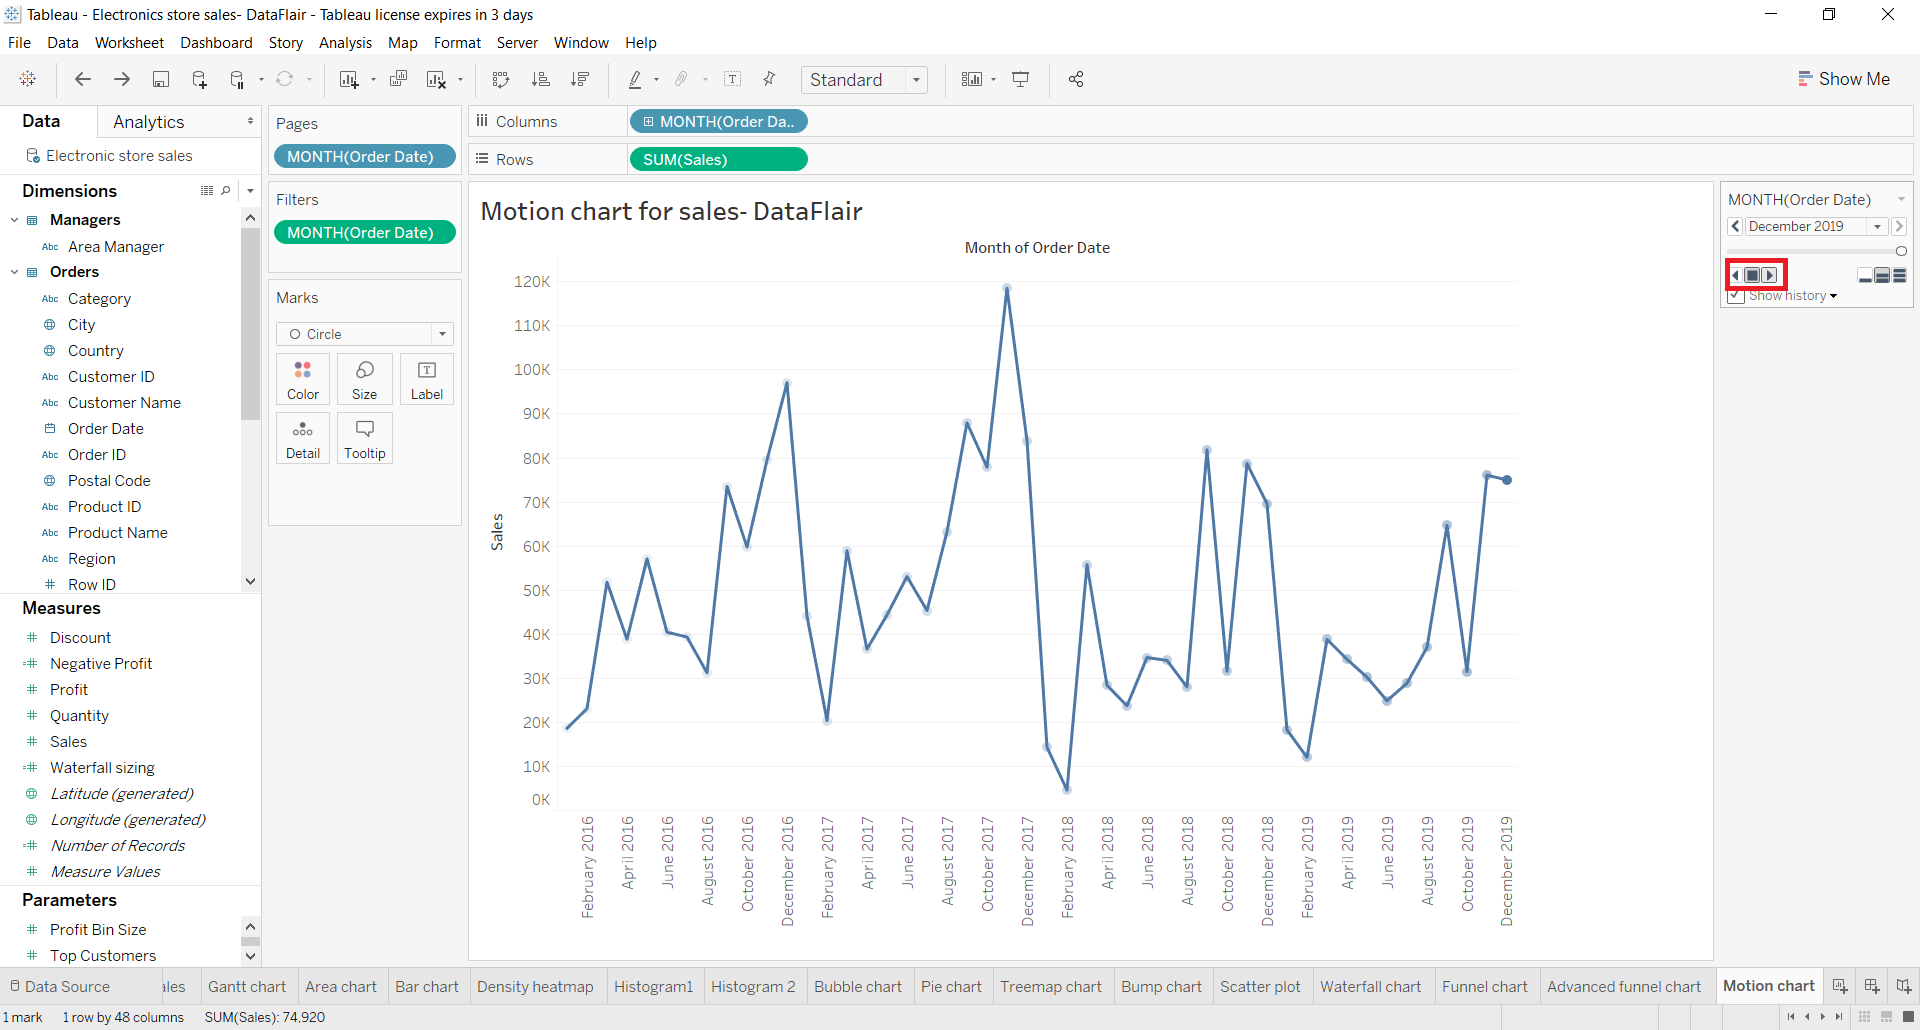
Step 9: Create Tableau Motion Chart with Two Variables
We can also create a motion chart with two variables, hence, two lines moving together parallelly (unless they have the same data point). To do this, just add one more measure field on the Rows section.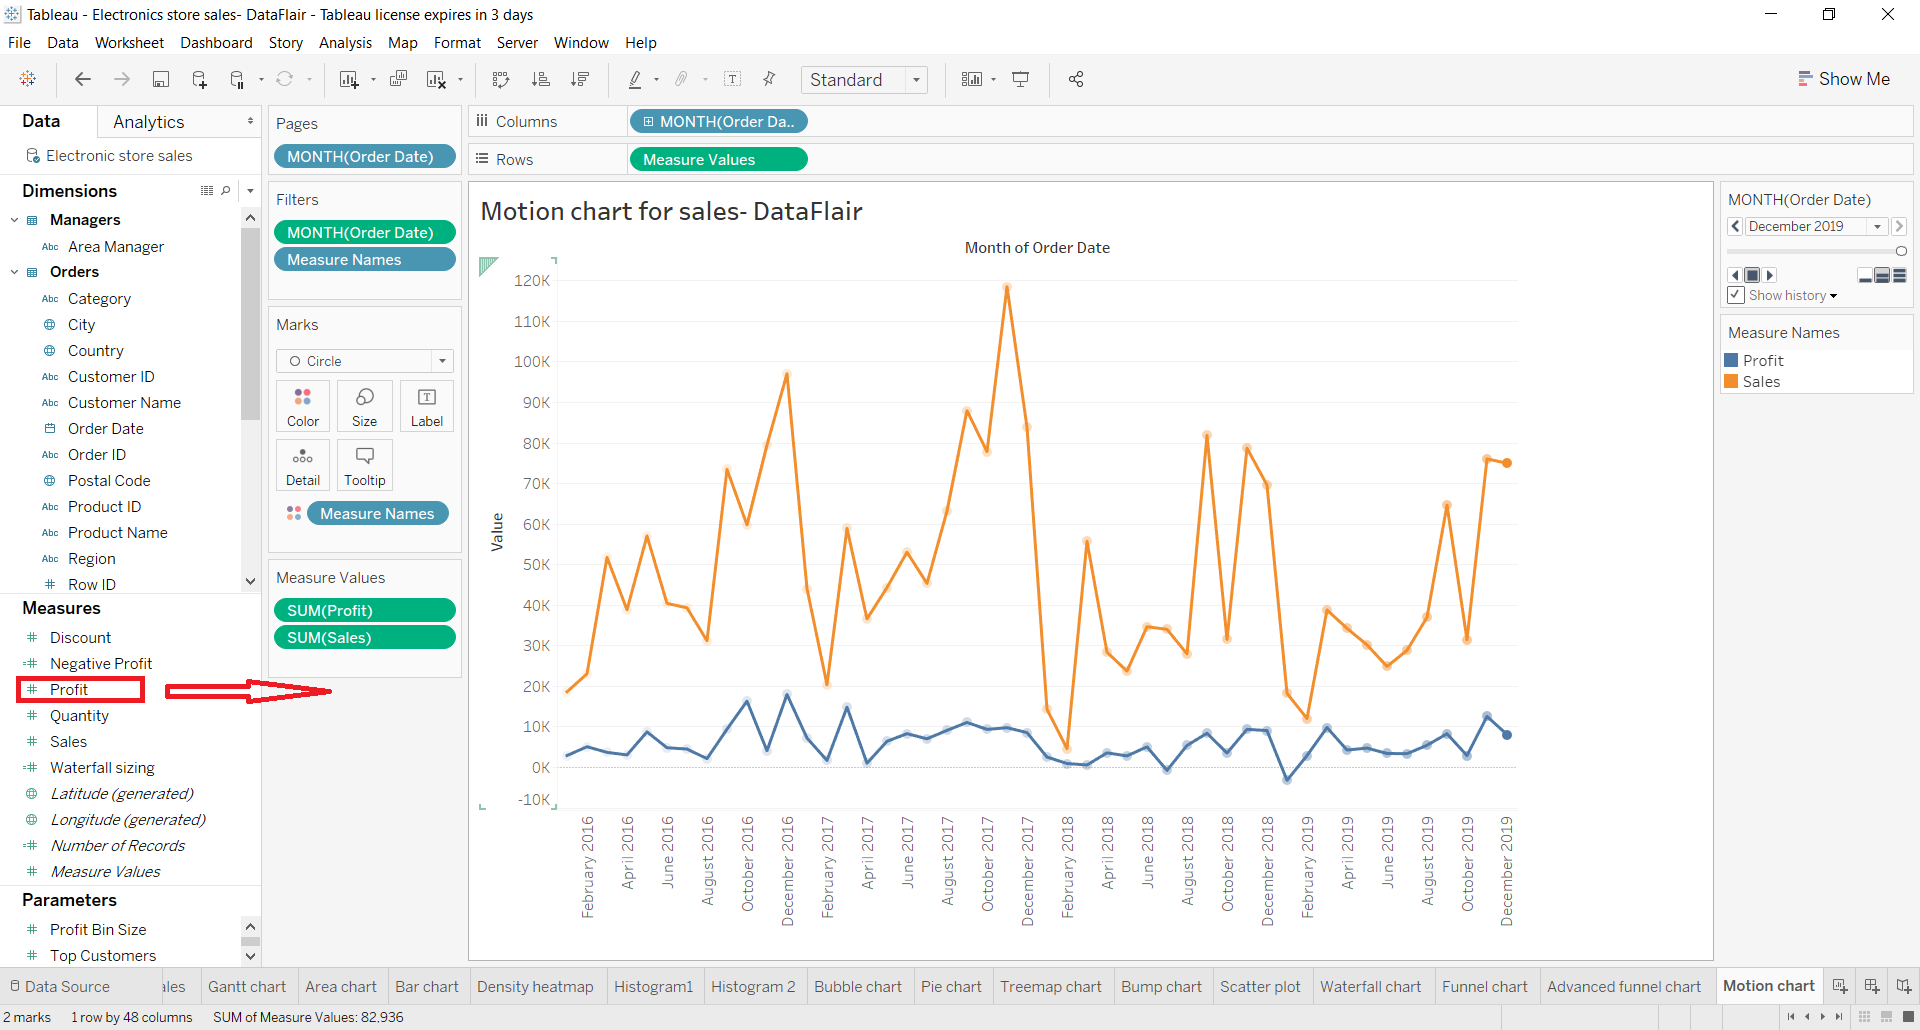
Here is our final Tableau motion chart trailing line moving in the right direction.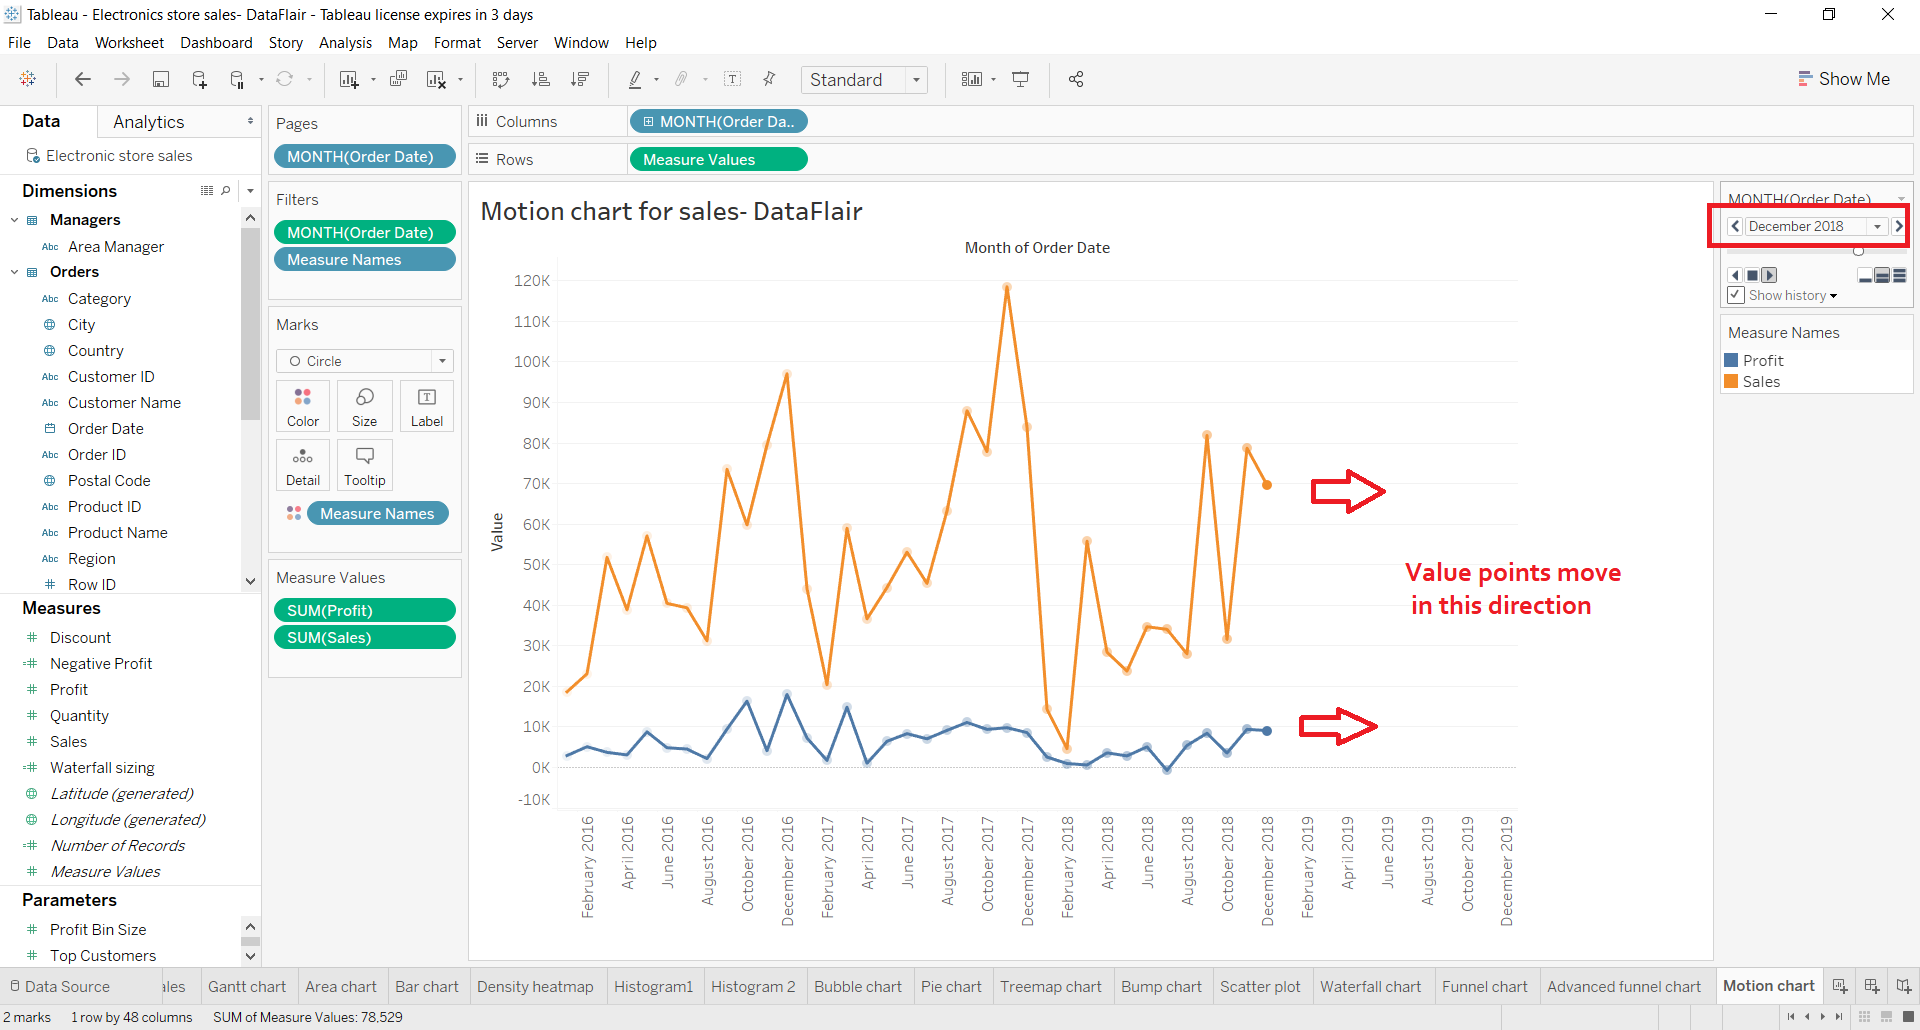
Summary
In this way, we can create motion charts to represent our data in motion. Once we know how to create a motion chart in Tableau, we can apply it in many ways to make our analysis more insightful and meaningful.
Time to have a clear-cut insight of your data using Tableau Donut.
We hope our explanation on the tableau motion chart was helpful to you. In case if you have any queries in any steps mention in the comment section.
Did you like this article? If Yes, please give DataFlair 5 Stars on Google


Is there a way to autoplay the chart?
Is there a way to Autoplay – and when published the Play option is not visible?
How to save motion chart as gif or video?