Learn to Add Trend Lines in Tableau in Just 3 Steps!
Interactive Online Courses: Elevate Skills & Succeed Enroll Now!
In this tutorial, we are going to learn about the trend lines in Tableau. Trend lines are considered to be of great use in data visualization and analysis. In Tableau, we get a lot of options to create different types of trend lines which helps in inferring important patterns and trends in our data. In the sections to follow, you can learn about the types of trend lines along with learning how to create trend lines in Tableau.
What are Trend Lines in Tableau?
A trend line in simple words is a line showing the patterns or trends emerging from data points. For instance, just by looking at a trend line for sales data, we can infer whether the sales are increasing with time, is not changing or decreasing. In this way, trend lines help us in interpreting data trends, predicting future scenarios and draw a correlation between two variables in the analysis.
In Tableau, we can have straight or curved trend lines depending on the model you select from the different options of trend line models available in Tableau. Tableau has a total of five types of trend lines; Linear, Exponential, Logarithmic, Polynomial, and Power trend line. Let’s see the details of all types of trend lines.
How to Add Trend Lines in Tableau?
In this section, we will learn how to create trend lines in Tableau. Follow the steps given below and create a trend line for your Tableau charts.
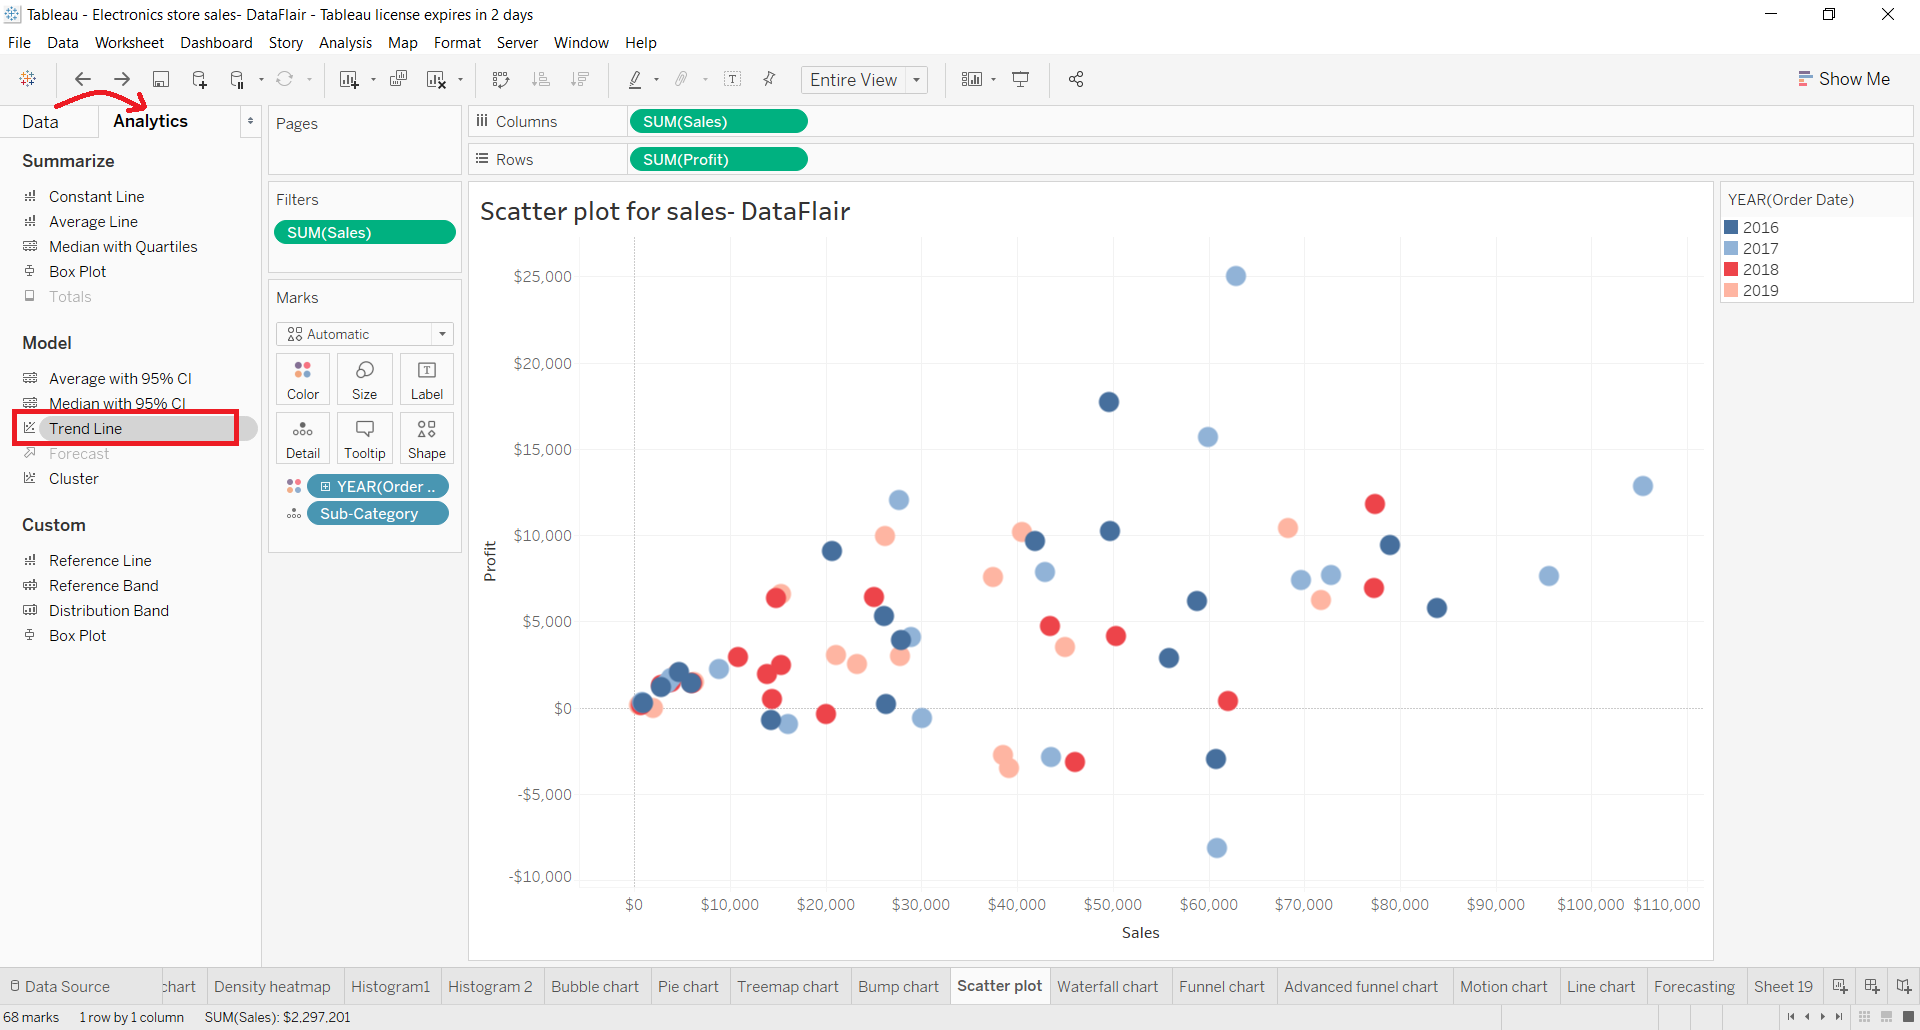
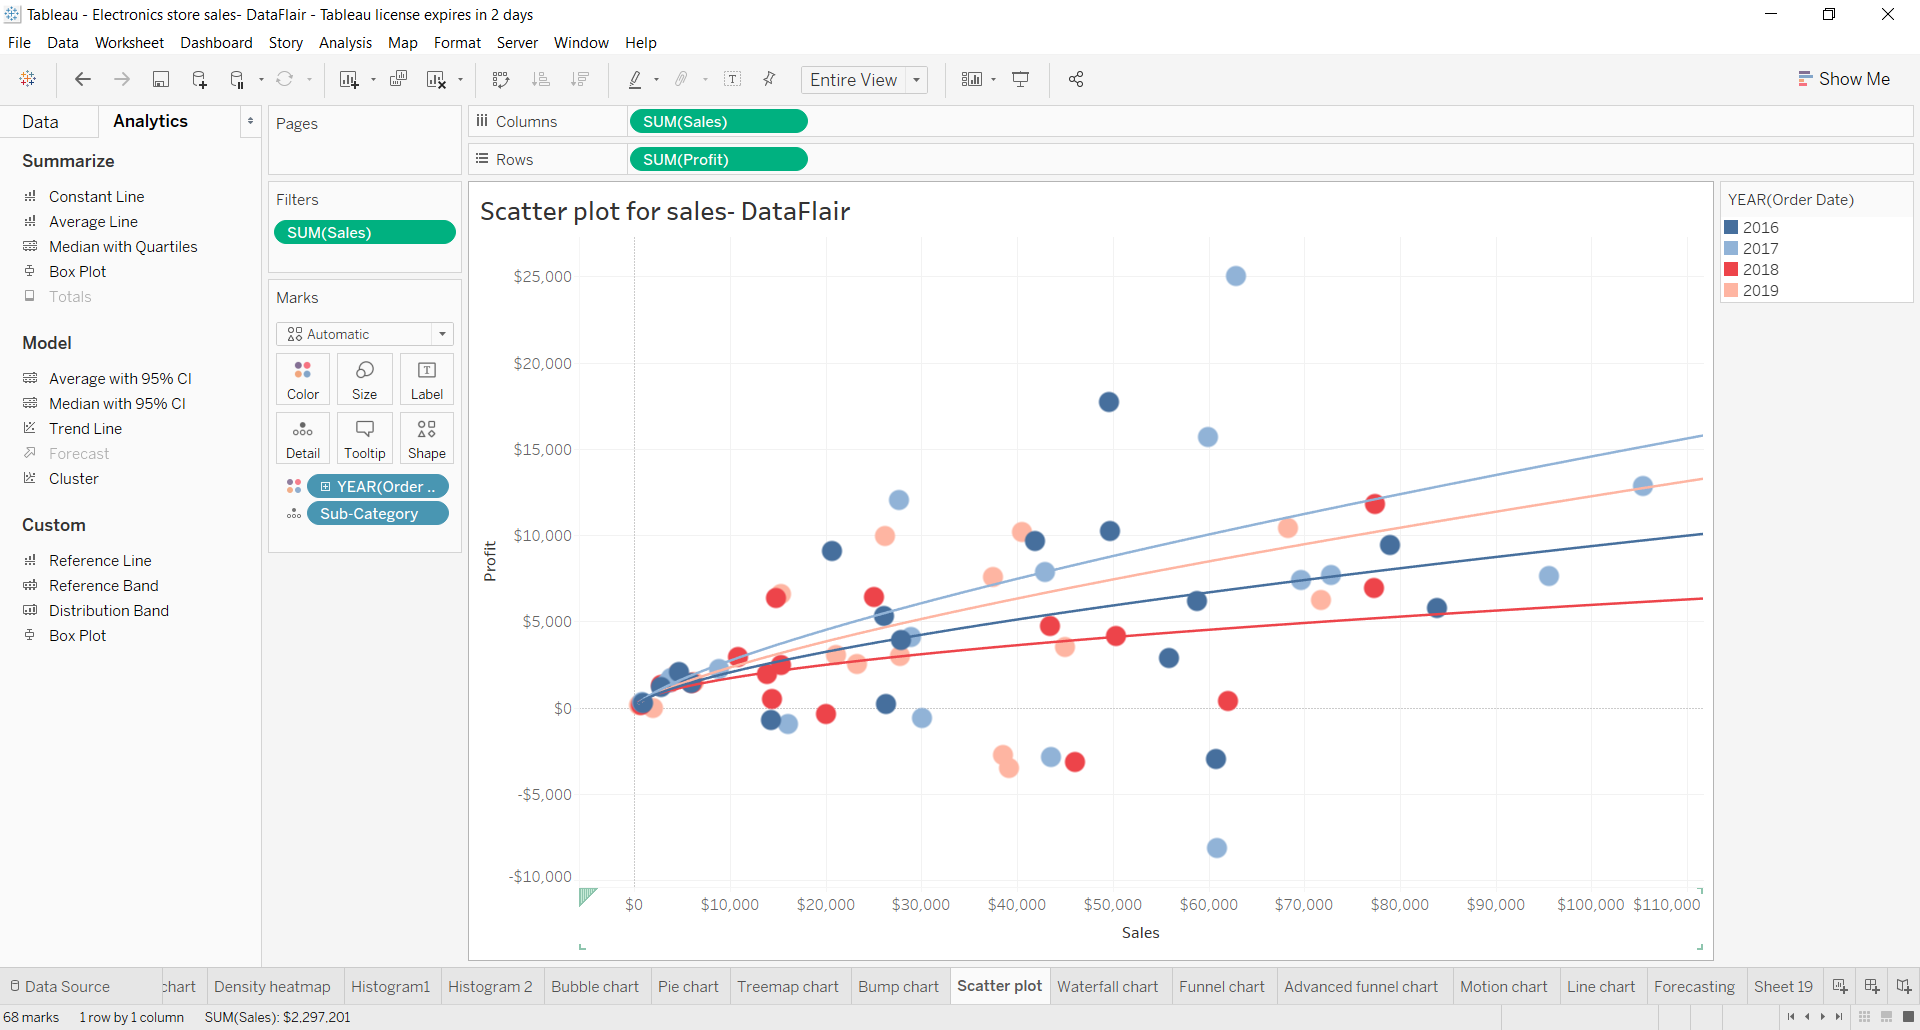
As shown in the screenshot below, we have a scatter plot for yearly sales. Now, in the steps to follow, we will add trend lines in this scatter plot.

Step 1: In the first step, we need to switch to the Analytics tab from the Data tab. In the Analytics tab, there is a Trend Line option under the Model section.
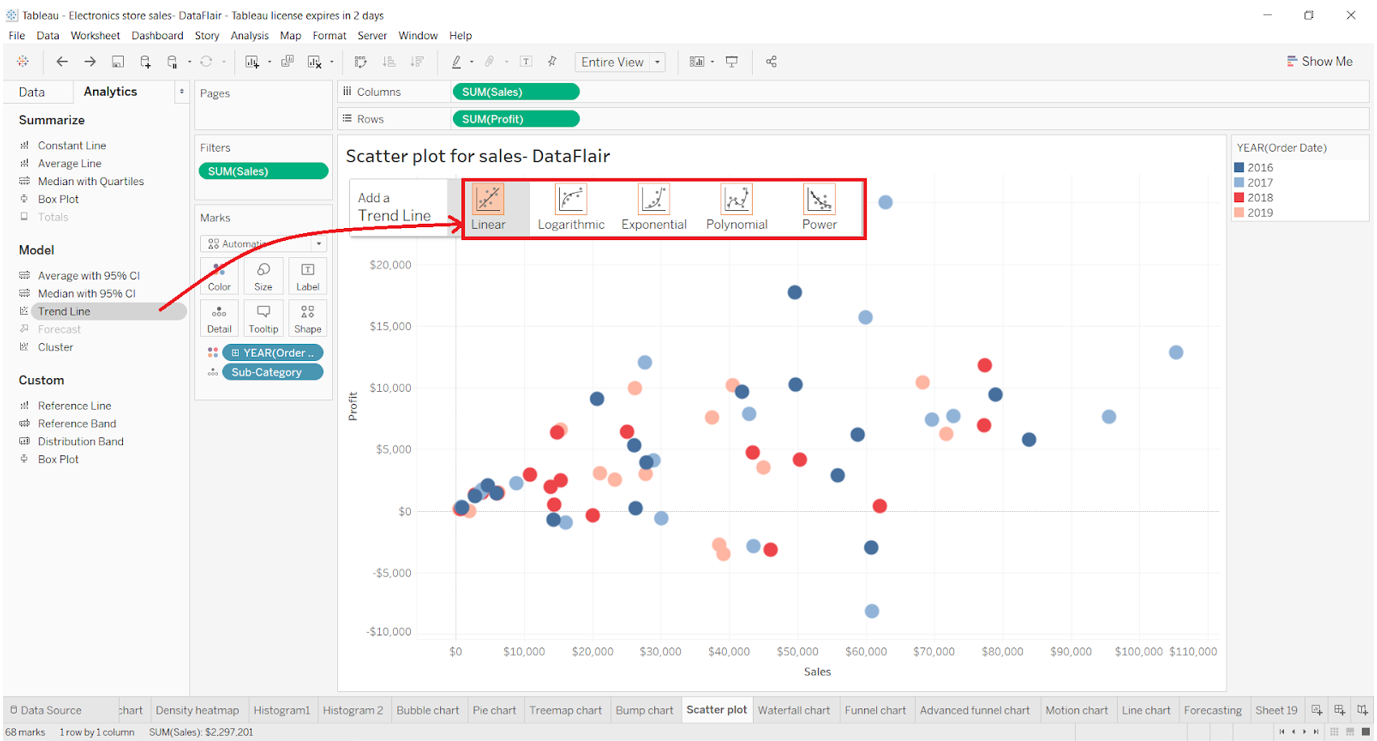
Step 2: Now, to add a trend line on this plot, hold the Trend Line option and drag it on to the scatter plot (or visualization area). You will see that it gives us five options of different types of trend lines which we can add on our graph. The options are Linear, Logarithmic, Exponential, Polynomial, and Power trend line.
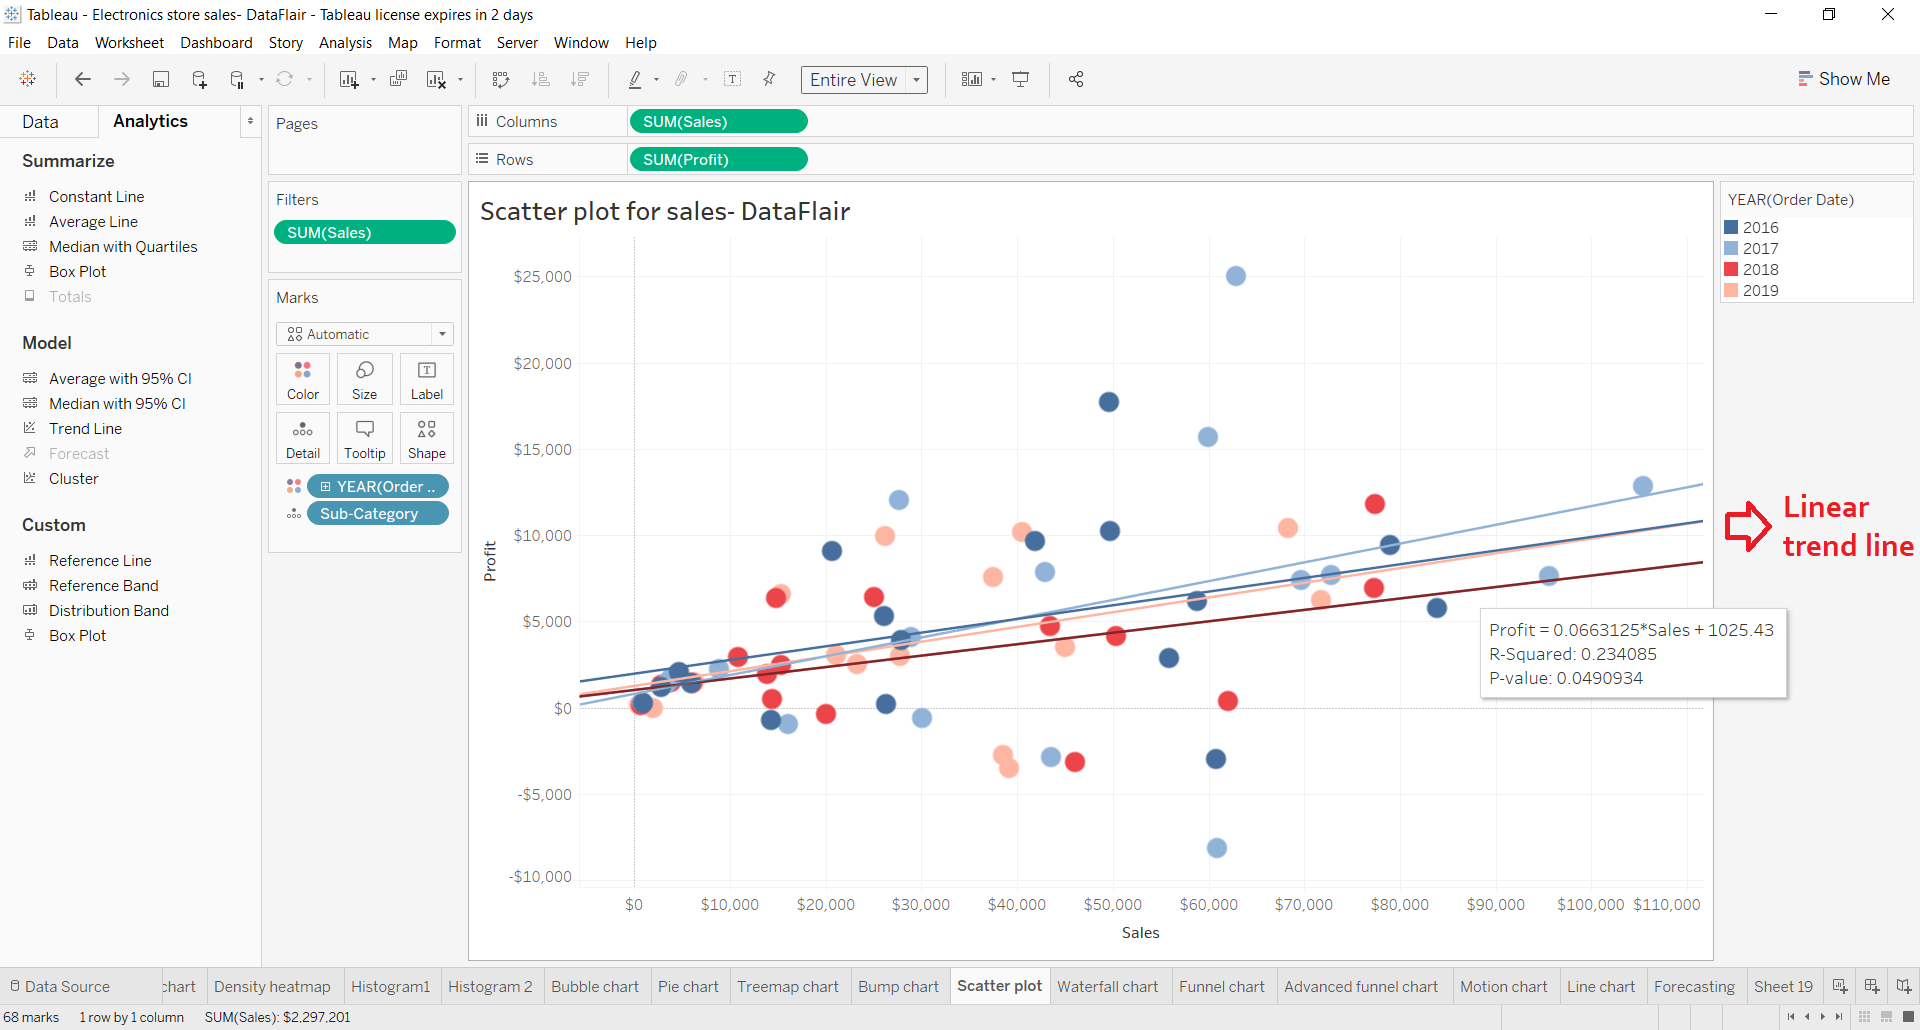
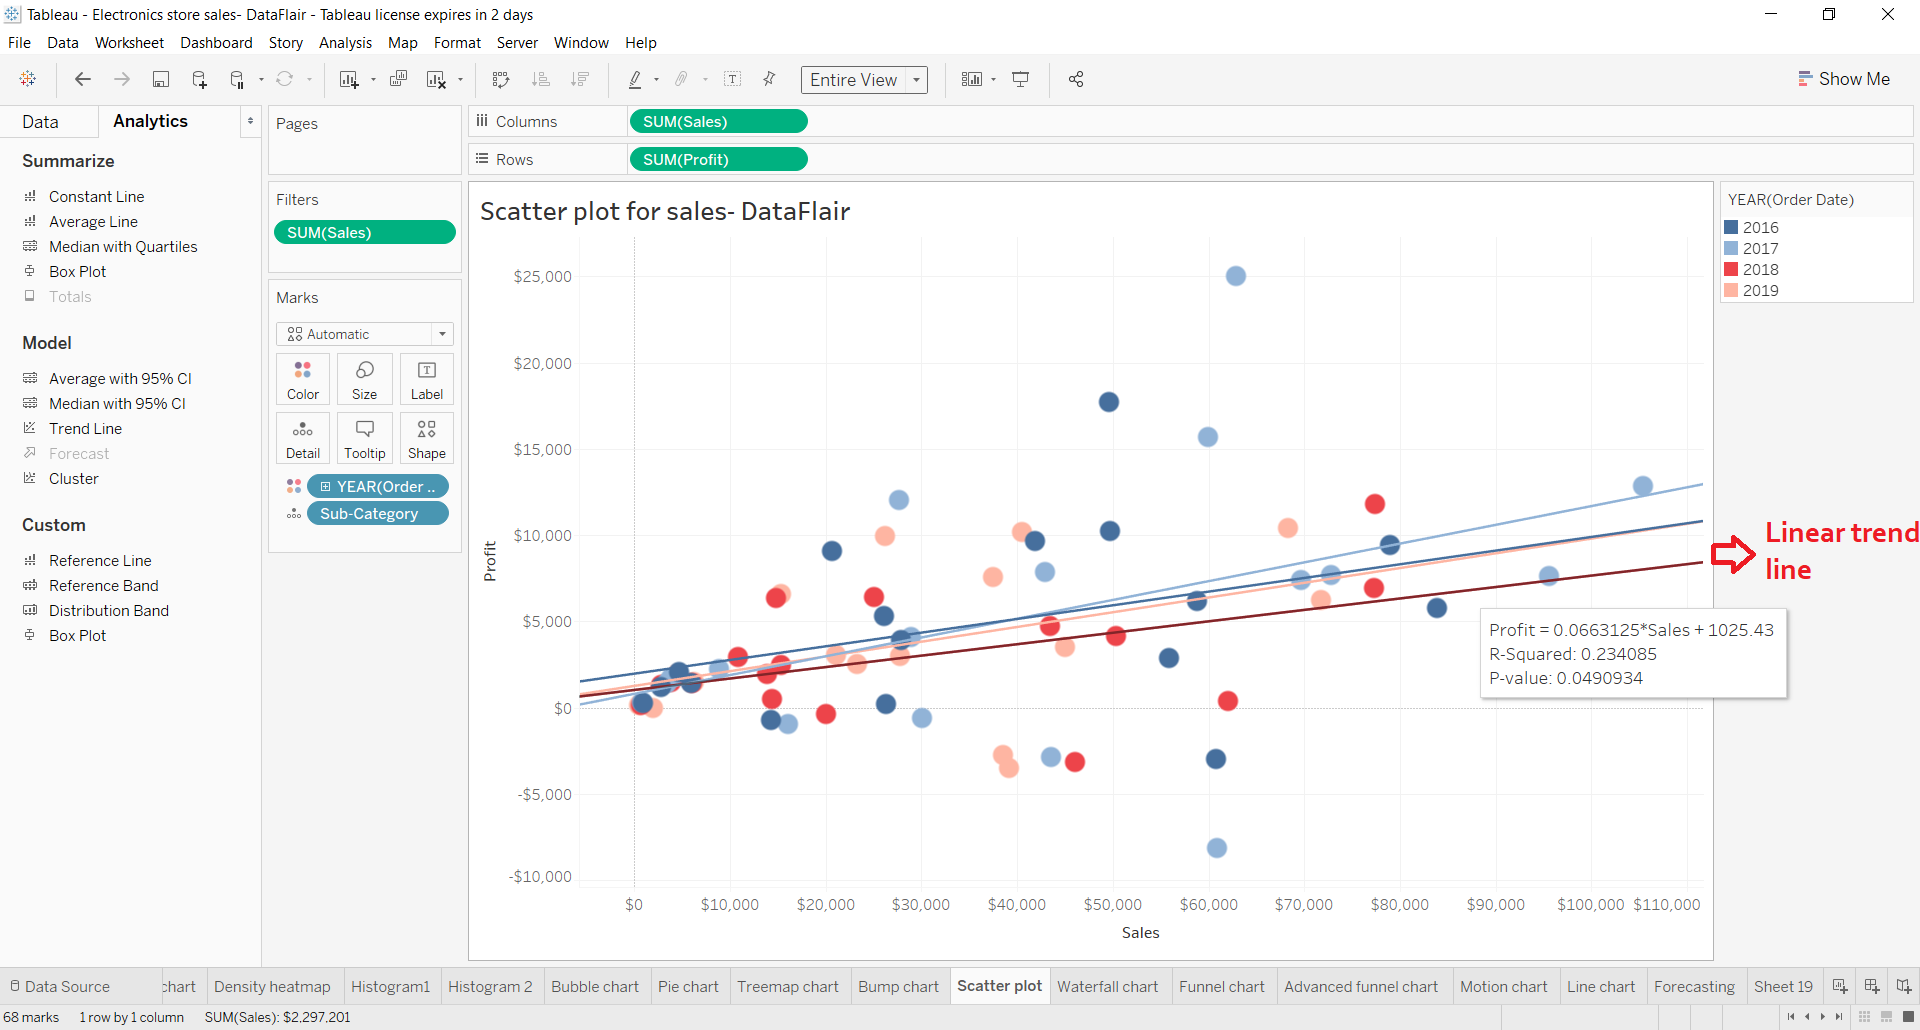
Step 3: Upon selecting the Linear trend line option (or one of your choice). As you can see in the screenshot below, four trend lines (each for a particular year) are added on the scatter plot. Each trend line is color-coded corresponding to the year it represents.
In the later sections, we will learn about other trend line types in detail.
Edit Options in Trend Lines
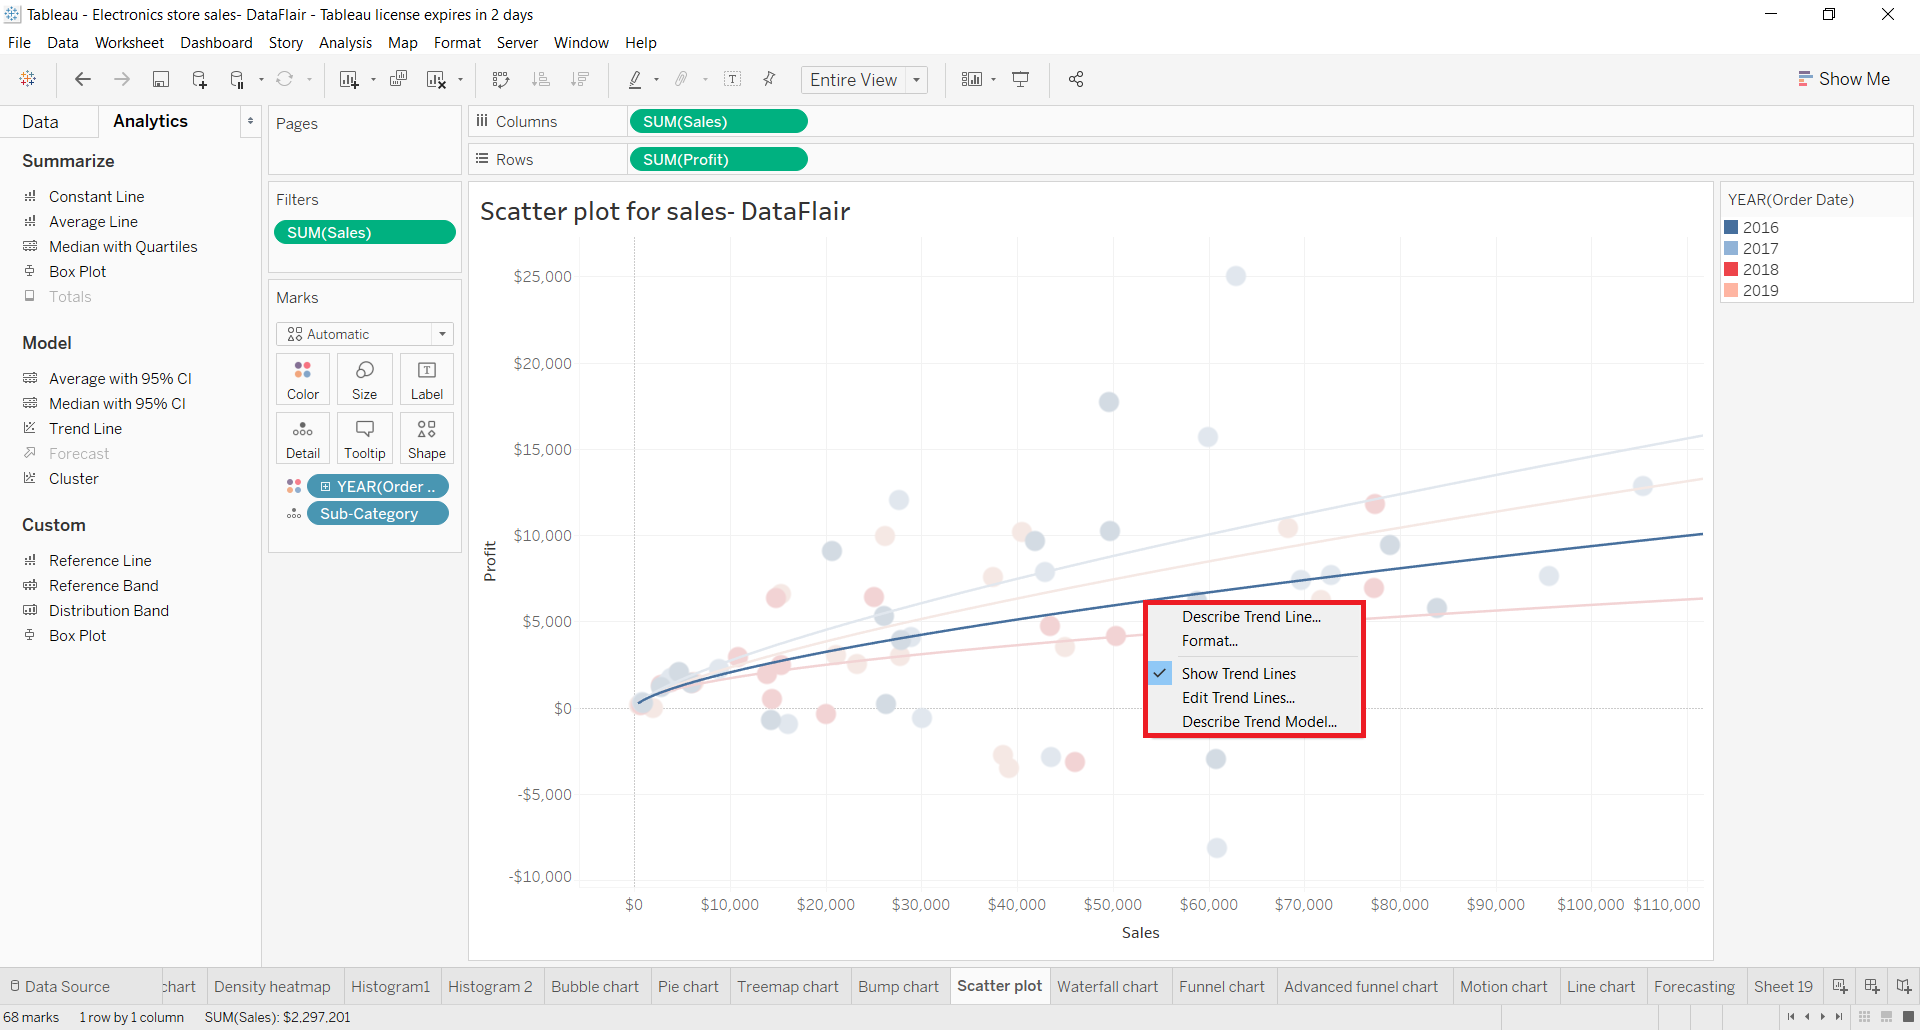
Tableau provides us with many options to edit the trend lines as per our requirement. To edit a single trend line, select the trend line and right-click on it. A small menu will open having the options such as Describe trend line, Format trend line, Show trend lines, Edit trend lines, and Describe trend model.
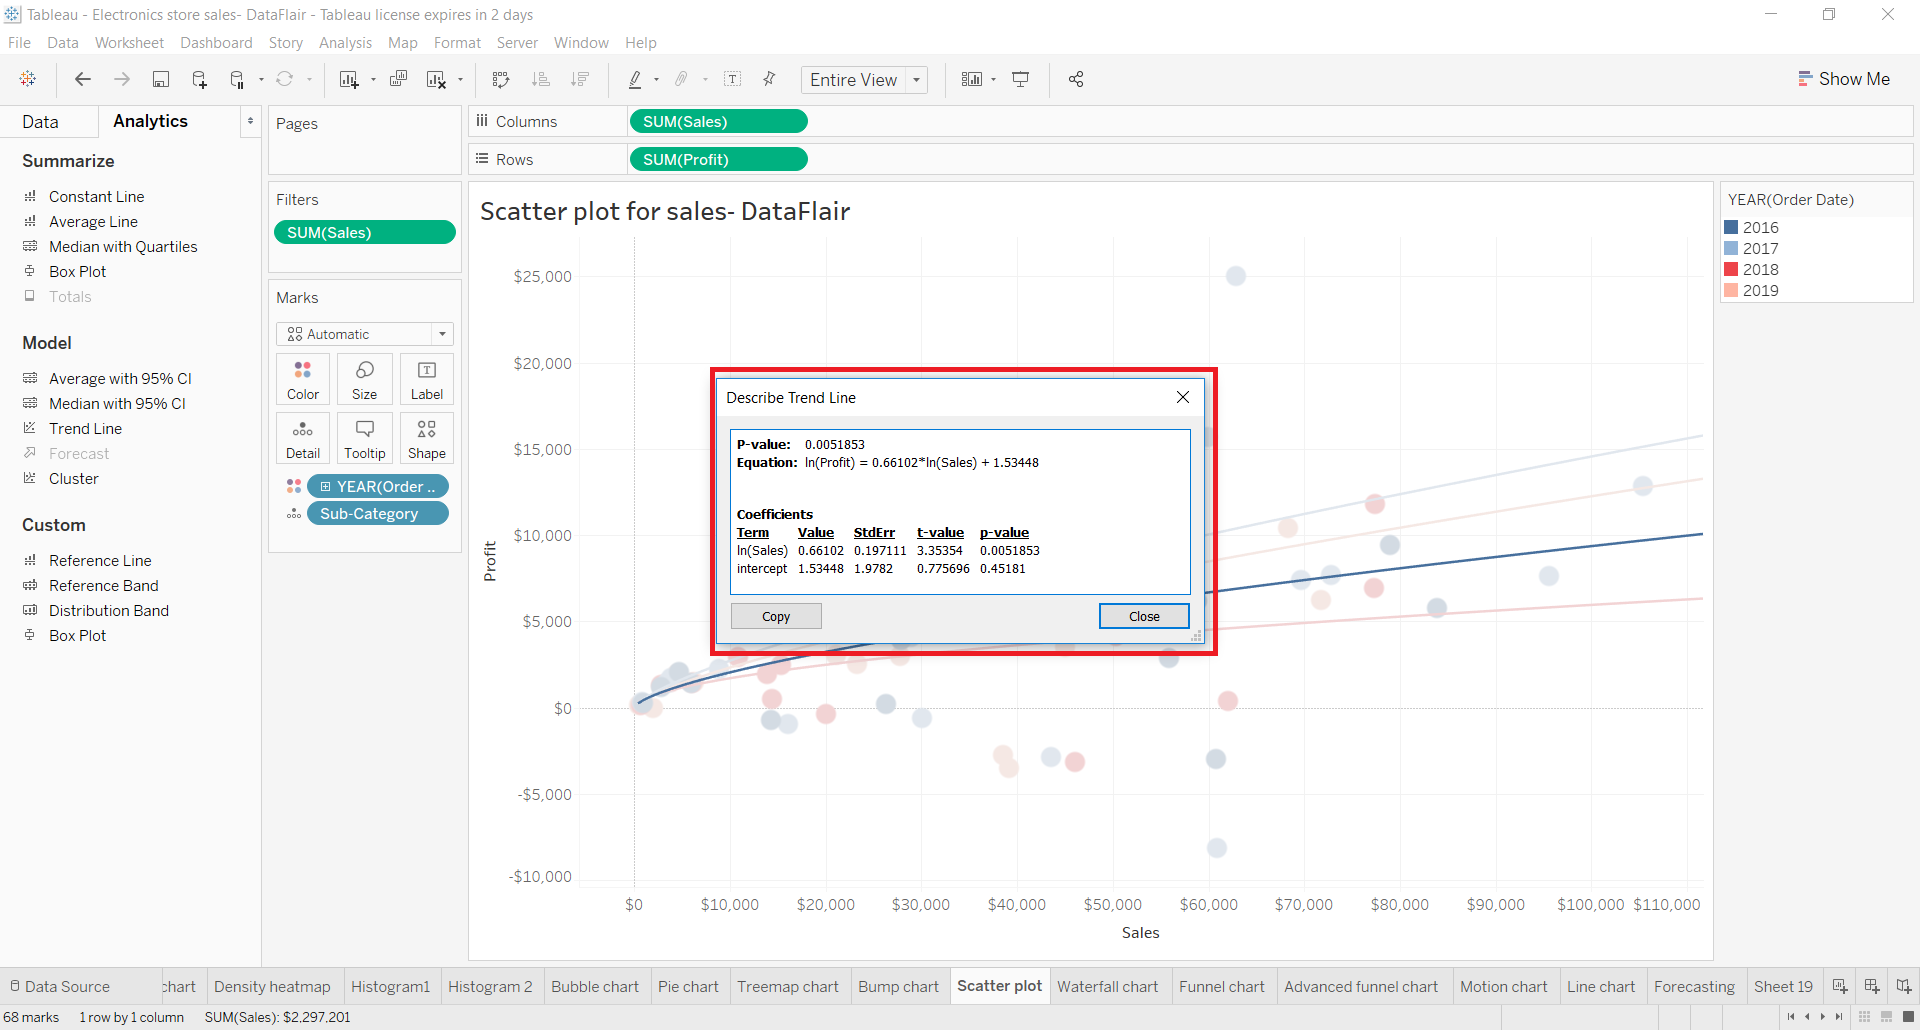
Describe Trend Line: This option gives a detailed description of the trend line. In includes the p-value, equation, and coefficients of the trend line.
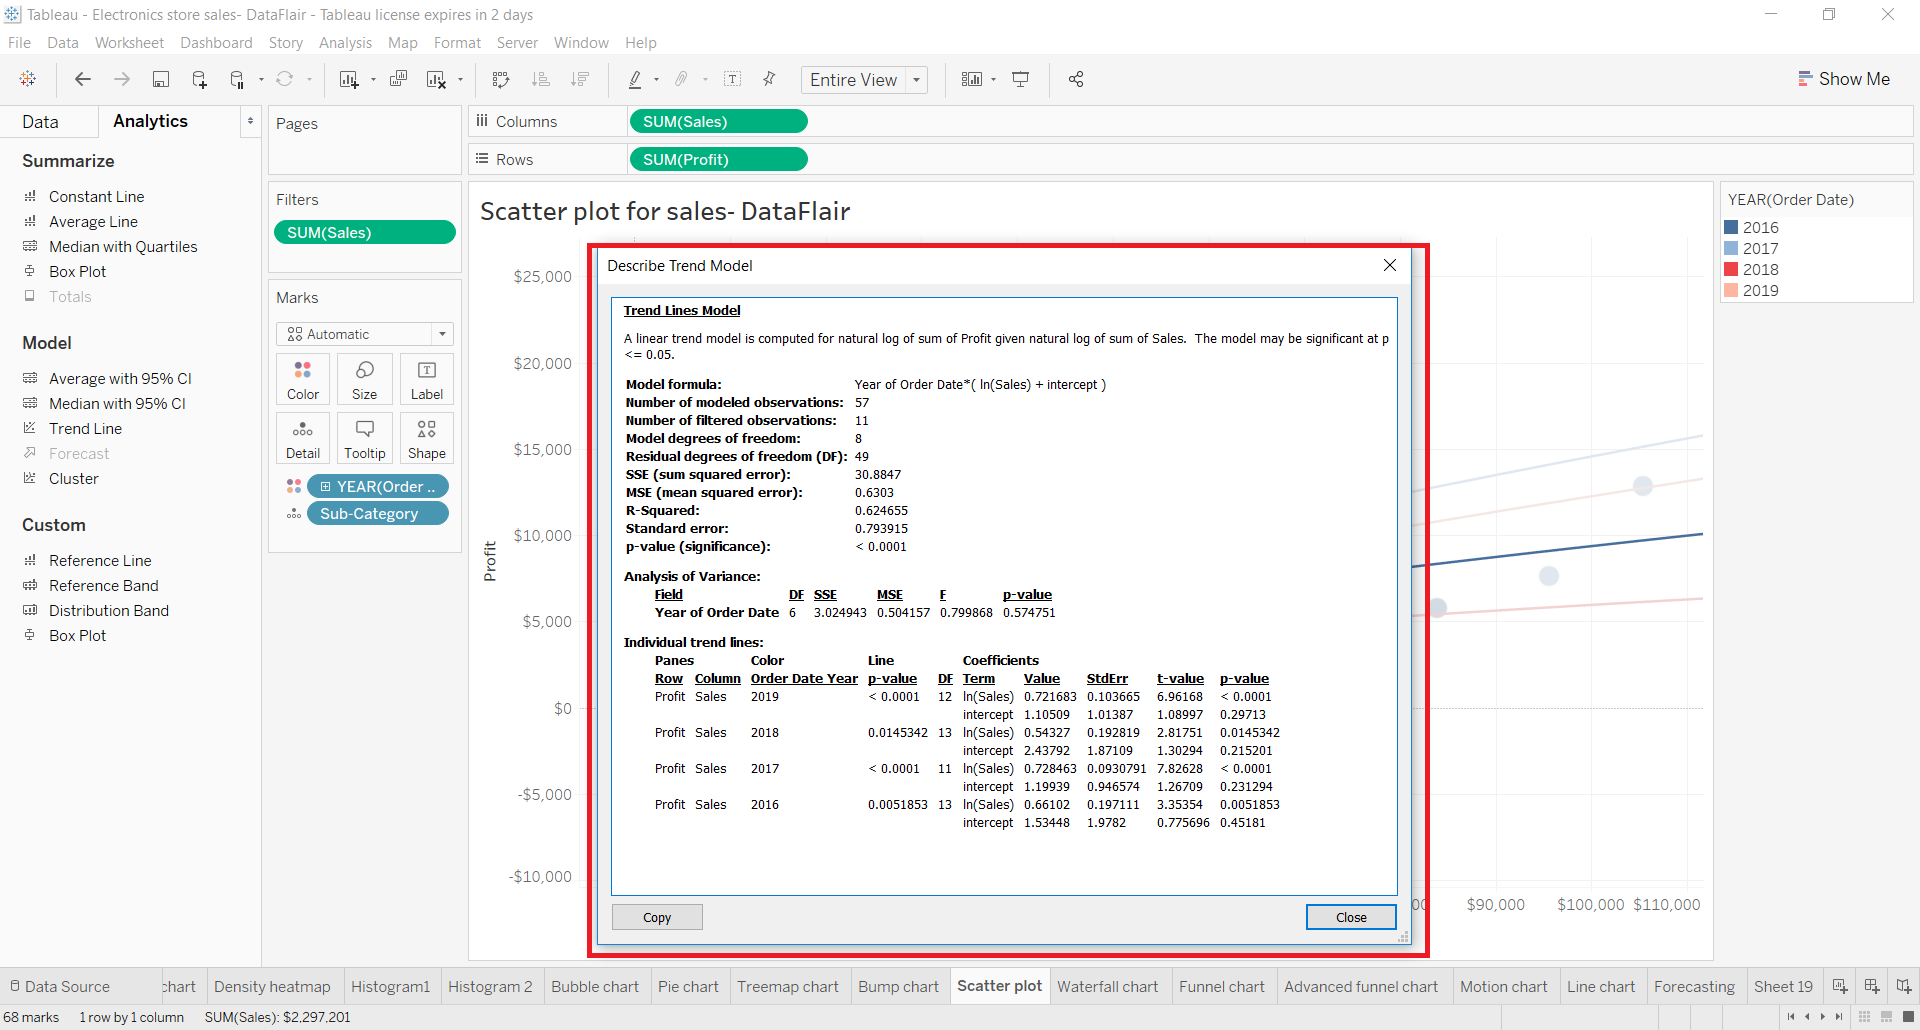
Describe Trend Model: This option gives a description of the entire trend line model. As you can see in the screenshot of a model description below, it is a very detailed one and provides a lot of information on the trend line model in use.
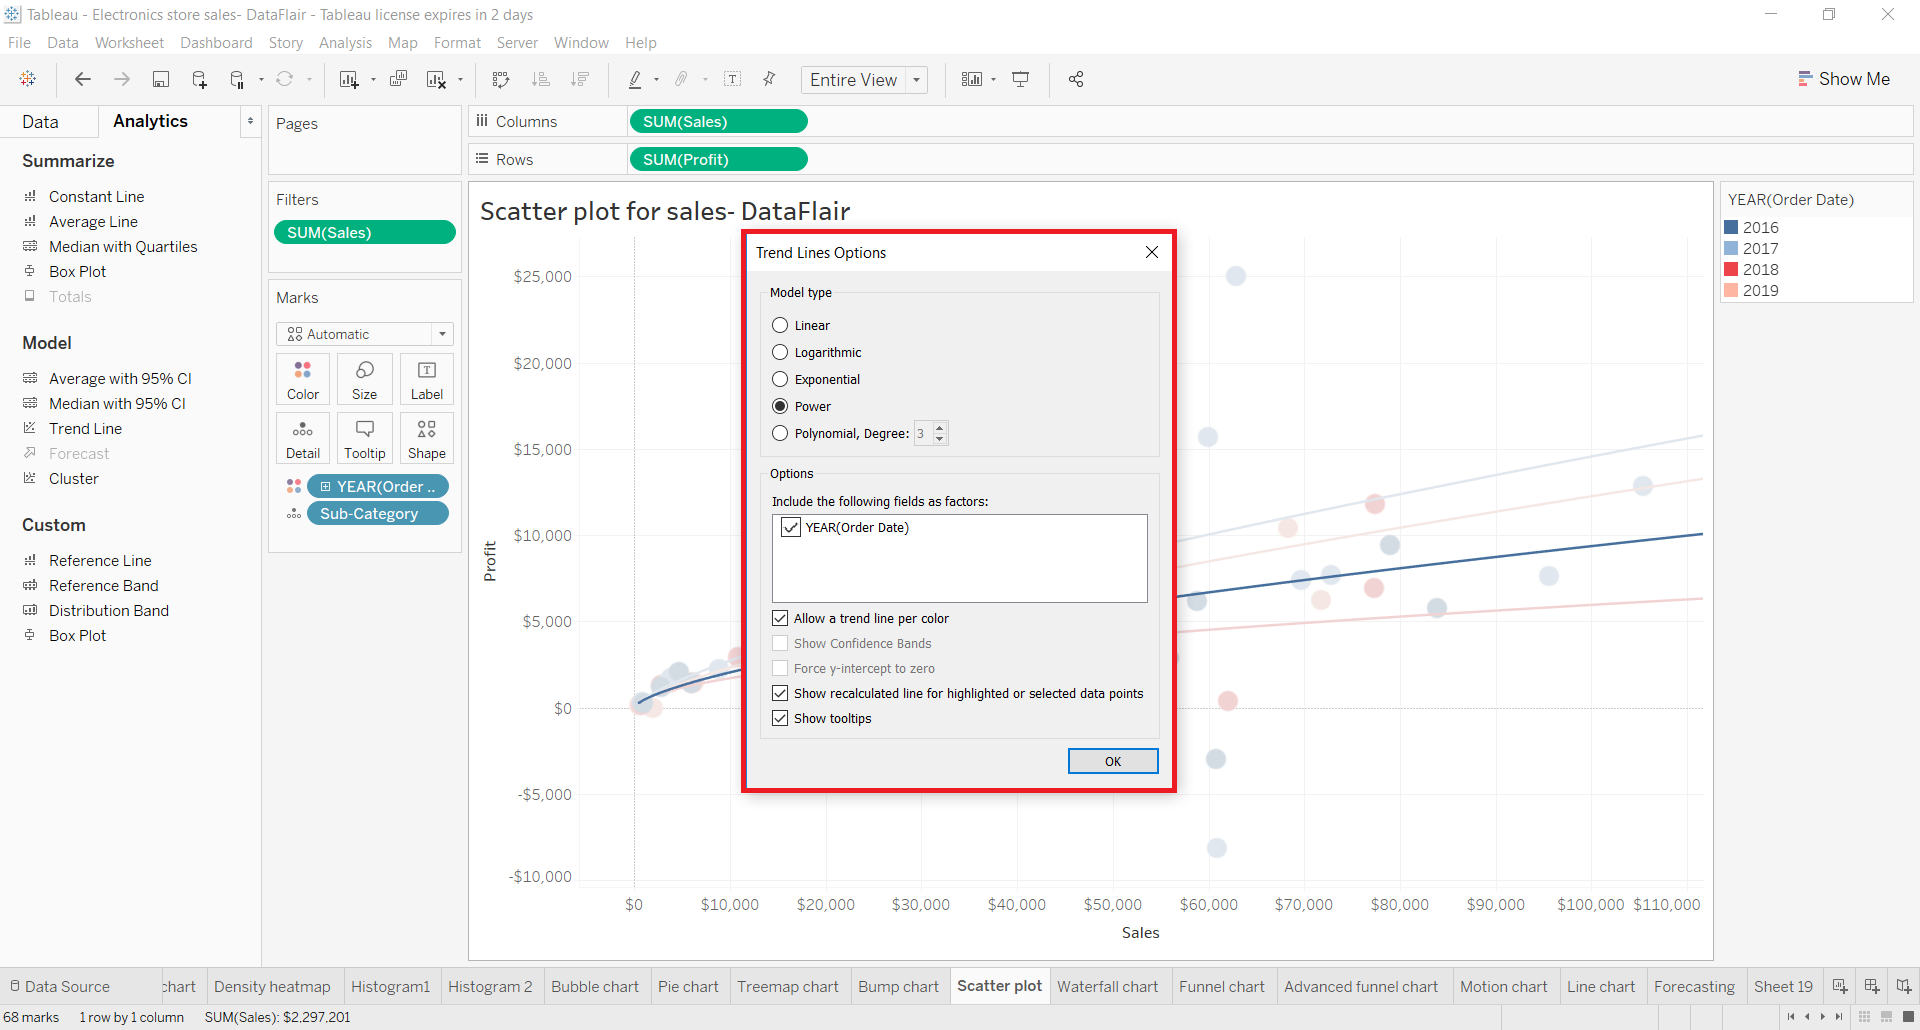
Edit Trend Lines: This option gives us the facility to change the trend line type from one to another. It also provides a few other editing options.
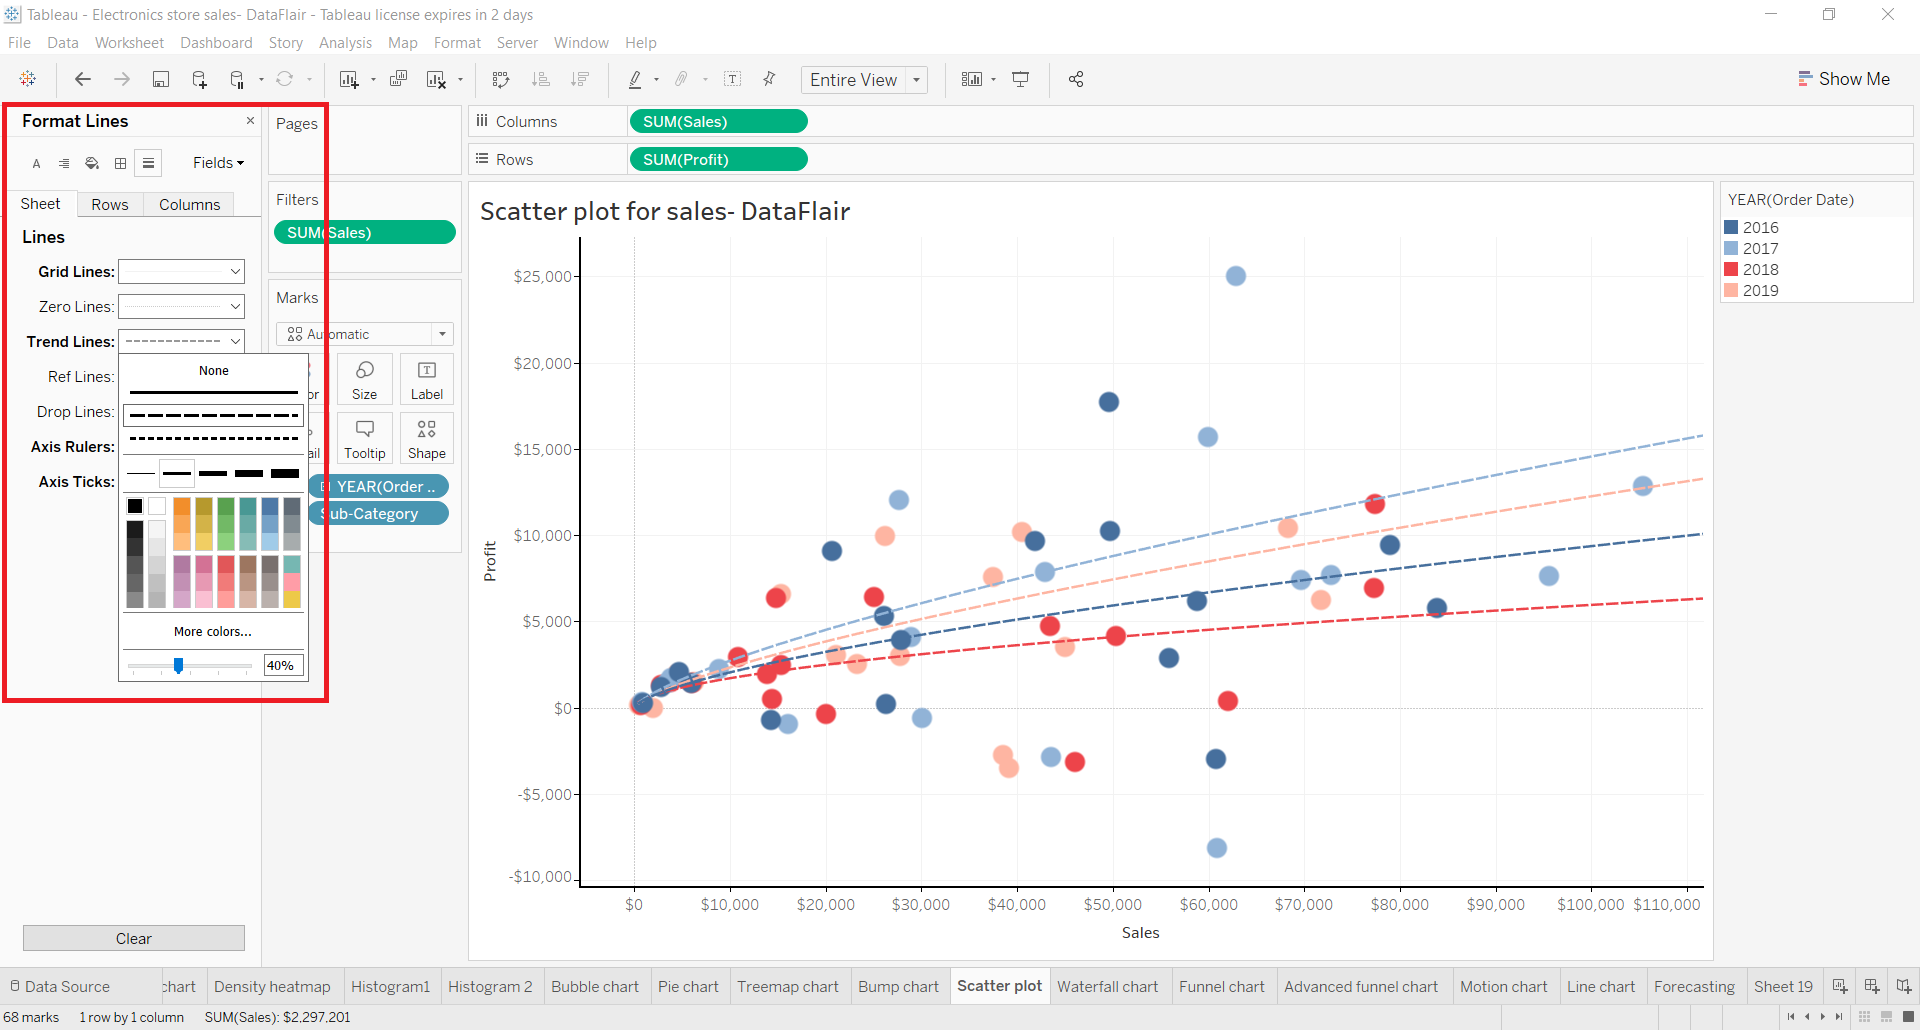
Format Trend Lines: Using the Format option, we can format the appearance of the trend line. We can change the line type, thickness, color, etc of the trend line from here. You can explore more formatting options from the formatting pane which appears on the left.
Types of Trend Lines in Tableau
Let us discuss about the different kinds of trend lines available in Tableau.
1. Linear Trend Line
The formula for the linear trend line is; Y = b0 + b1 * X (here b1 is the slope and b0 is the intercept of the line).
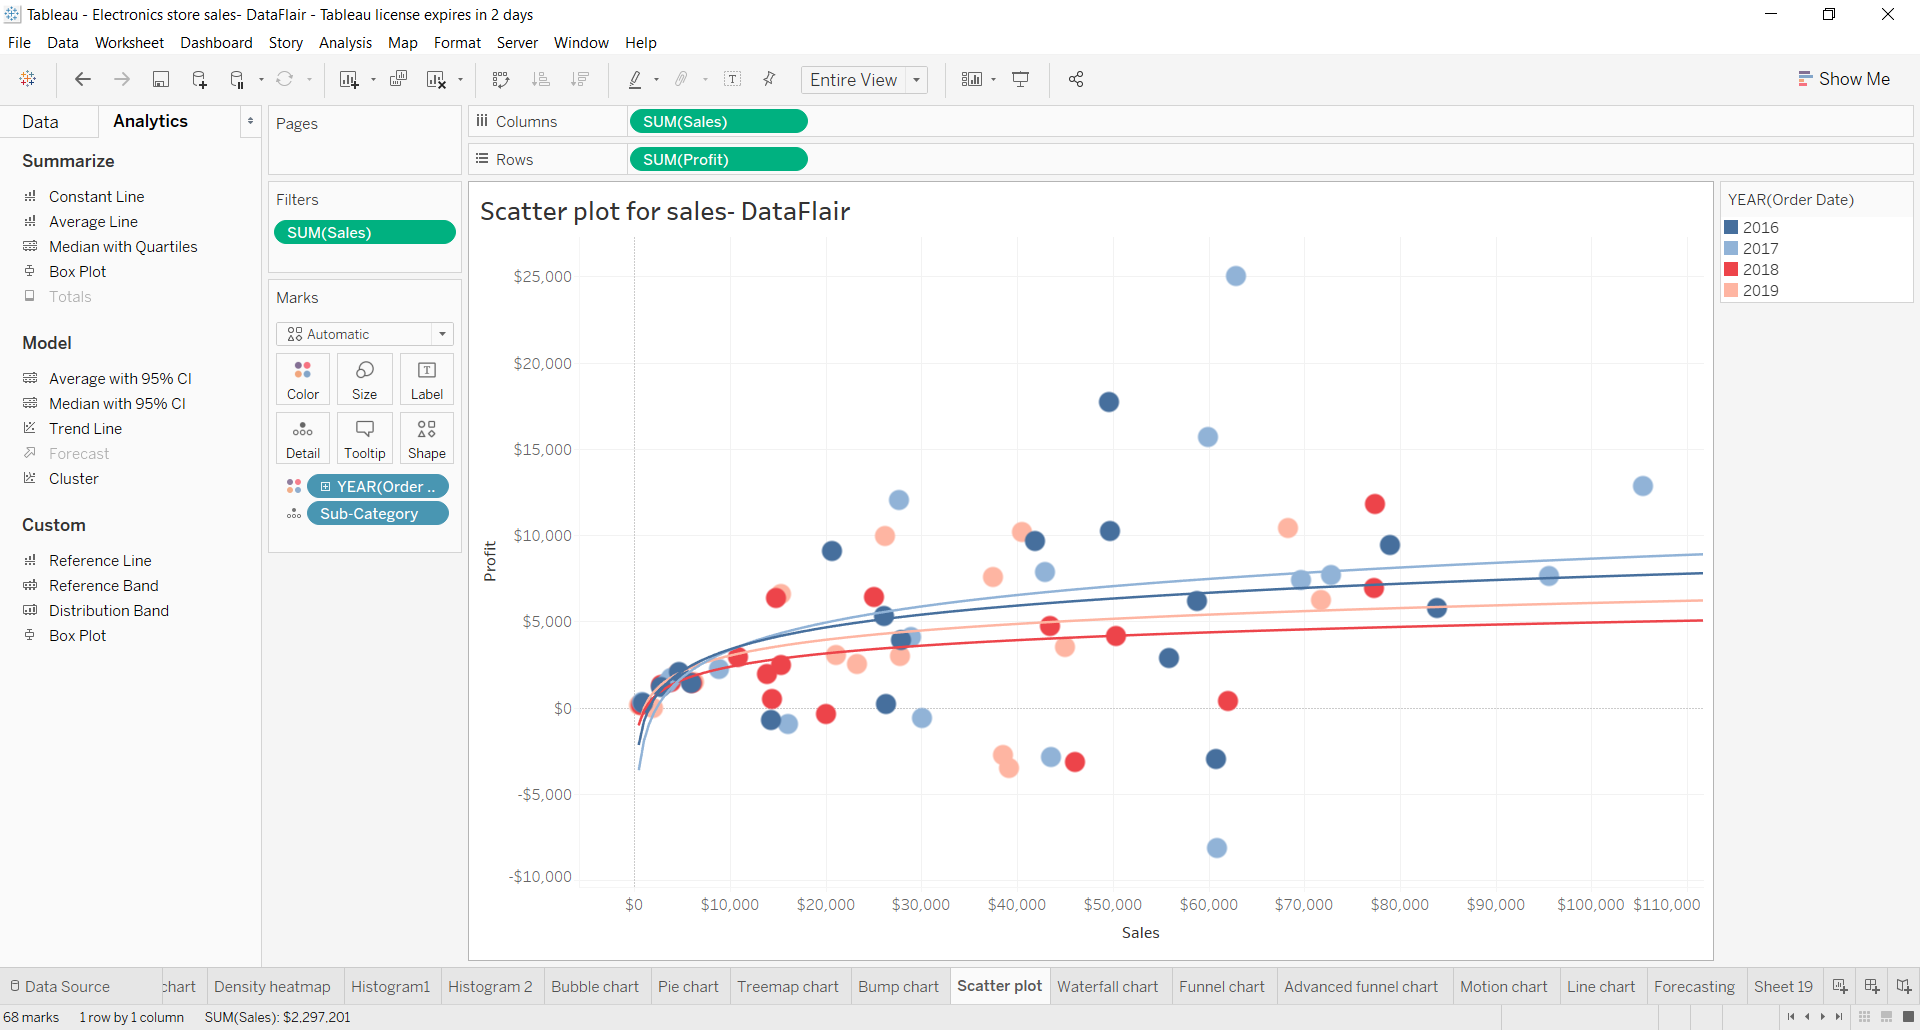
2. Logarithmic Trend Line
The logarithmic trend line defines and represents the logarithm of all the values in a field. The equation of a logarithmic trend line Y = b0 + b1 * ln(X). In order to create a logarithm, Tableau filters out all the negative values as a logarithm cannot be defined with values less than zero. You can see how many marks or data values were eliminated before estimating the logarithmic trend model or line in the trend line description.
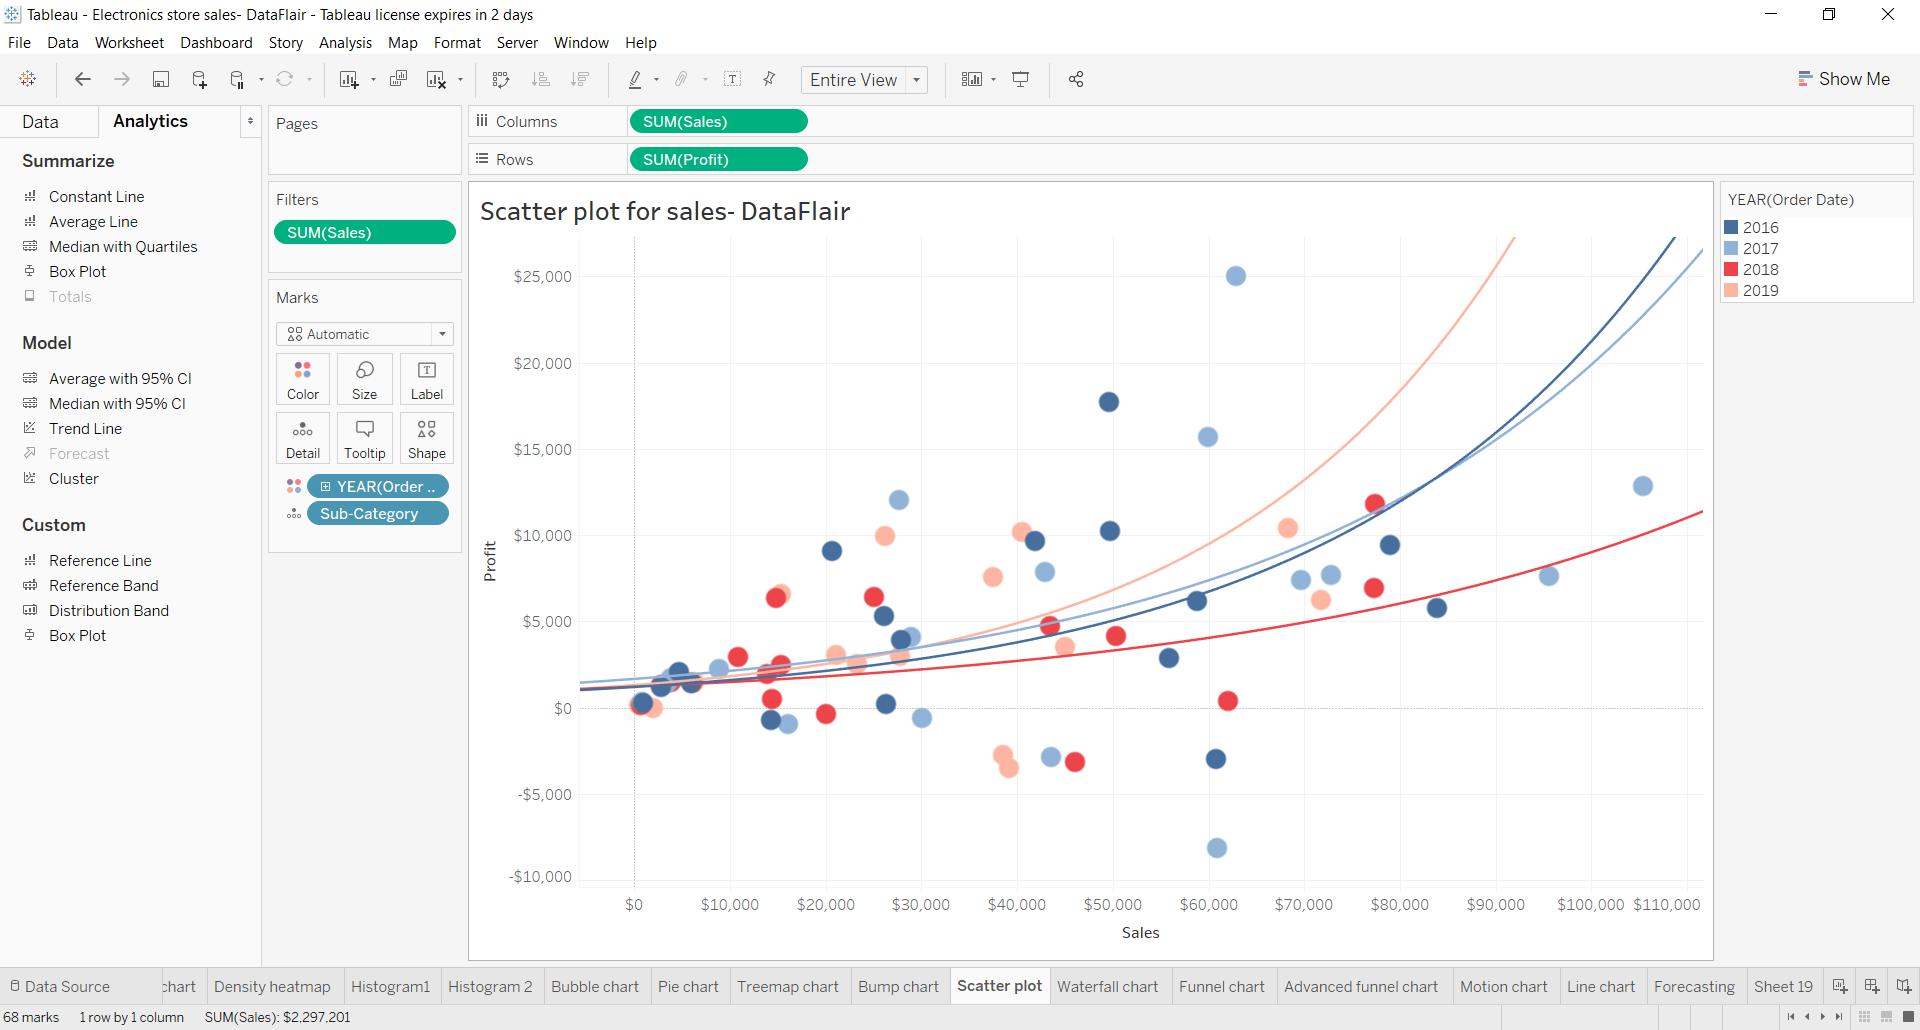
3. Exponential Trend Line
In the exponential trend line model, the natural log of the data values are taken and then those values are plotted after exponentiating them. The equation of an exponential trend line is Y = exp(b0)* exp(b1 * X).
To change the data values into their natural logs, the equation used is ln(Y) = b0 + b1 * X
Like the logarithmic trend line, the exponential trend line also does not take values less than zero. That is why, while calculating for an exponential trend line, Tableau eliminates all the negative values from the set.
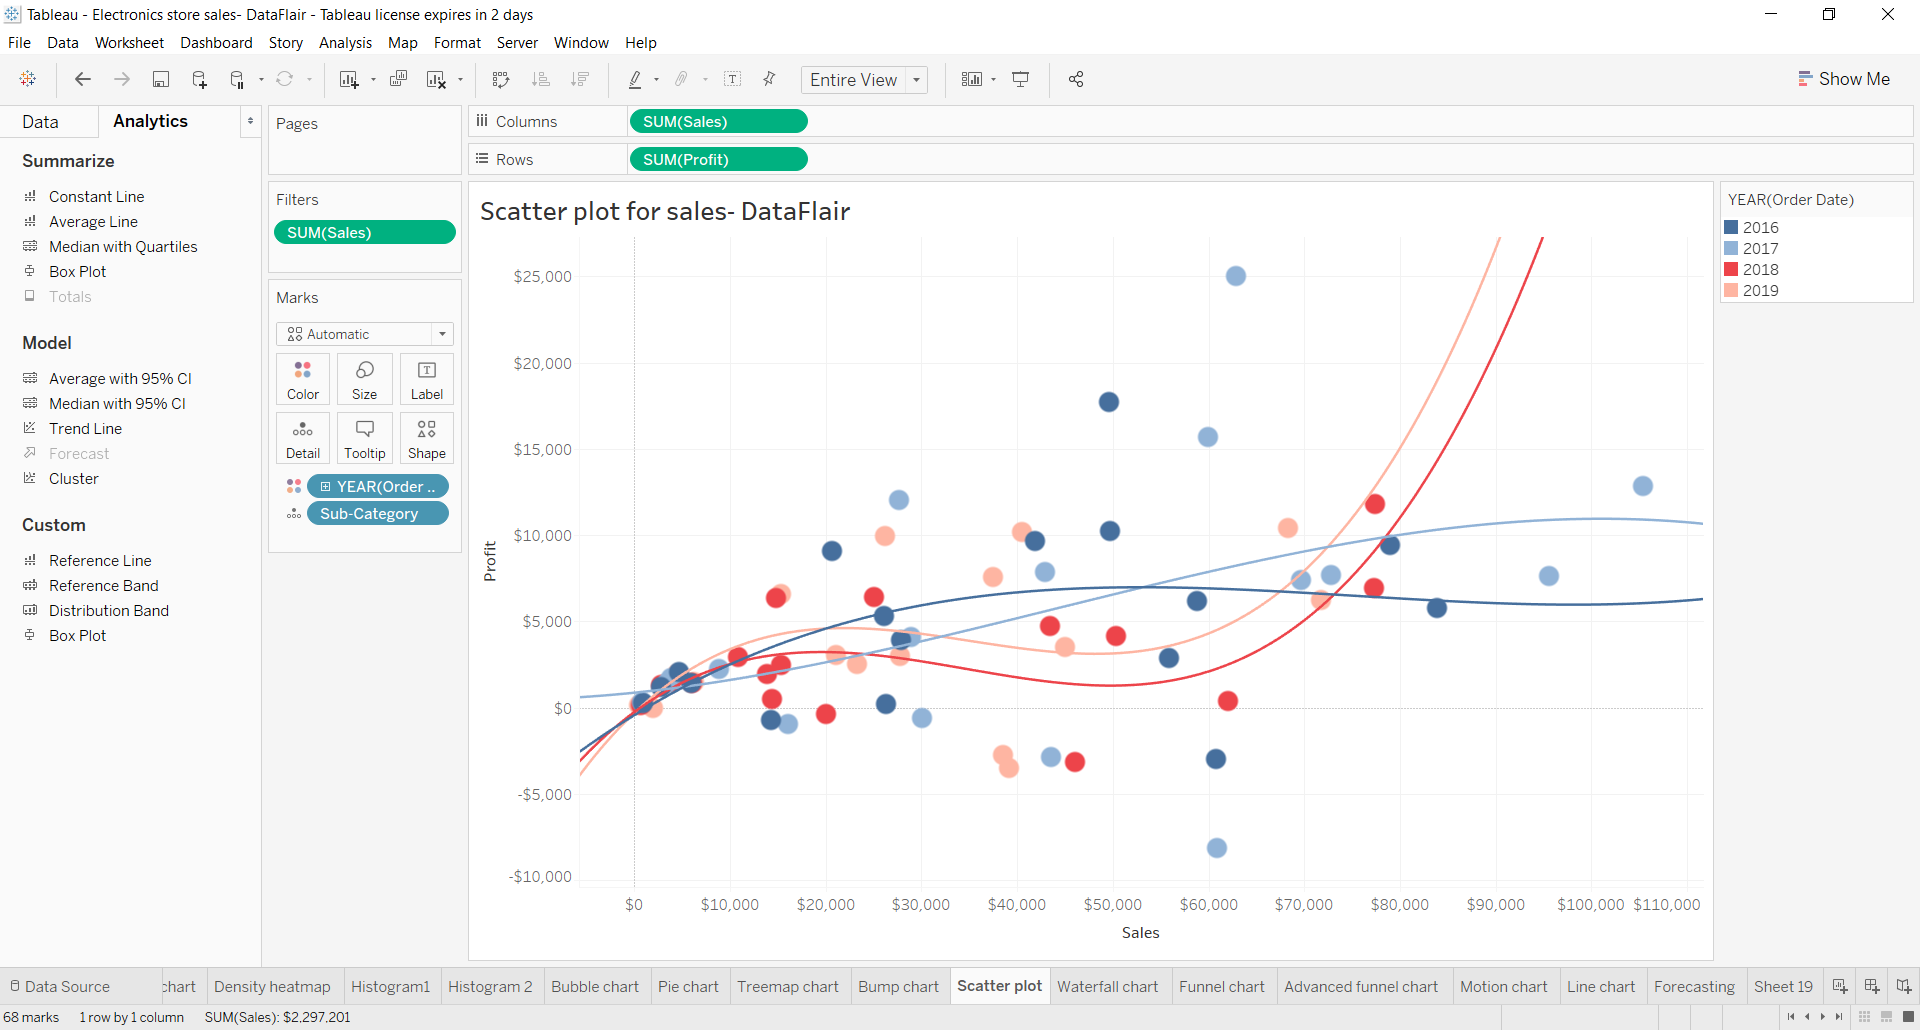
4. Polynomial Trend Line
Tableau creates a polynomial trend line by transforming the variables or data values into a polynomial series of a certain degree. We can select the degree for the polynomial series between 2 to 8. The accuracy of a polynomial model depends on the values taken and the polynomial degree. You can check for a warning message underlined in red in the description of the model to see if your model is accurate or not.
The equation or formula to create a polynomial trend line is Y = b0 + b1 * X + b2 * X^2 + …
5. Power Trend Line
The power trend line model requires field variables or values to convert into its natural log form. Once converted, Tableau exponentiates the values to plot the trend line.
The formula or equation for a power trend line is; Y = b0 * X^b1
Removing Trend Line in Tableau
We can remove the trend line or the entire set of trend lines from the Tableau graph. To remove a single trend line, right-click on a trend line and select the Remove option.
To remove the entire set of trend lines present, go to Analytics, then Trend lines and deselect Show Trend Lines option.
Trend Line Assumptions
Whenever a trend line model is to be created in Tableau, the calculations are based on certain assumptions. They are generally known as trend line assumptions. Every trend line is created by doing computations that depend upon these assumptions.
The trend line assumptions are:
- The model is a functional simplification of the true data generating process and is very accurate.
- All the errors average to zero. Also, the errors are uncorrelated with the independent variable.
- The errors have constant variance and they do not correlate with each other.
- The explanatory variables are not exact linear functions of each other.
Summary
This concludes our tutorial on trend lines in Tableau. Here, we saw what are trend lines, their significance in Tableau, adding, editing and removing trend lines in Tableau. In addition to this, we learned about five types of trend lines available in Tableau.
Your opinion matters
Please write your valuable feedback about DataFlair on Google


Is there any explanation how this equation is used in Data