Tableau Predictive Analysis- Linear Regression with R
We offer you a brighter future with industry-ready online courses - Start Now!!
In our last Tableau Tutorial, we study Tableau Density Map Using Hexbins. In this Tableau Predictive Analysis tutorial, we are going to study about the what is line regression and line regression with R Programming Language in Tableau. Moreover, we will also study the Prerequisites required to get started with Predictive Analysis in Tableau.
So, let us start Tableau Predictive Analysis – Linear Regression with R Programming.
Linear Regression With R
Linear regression is a common technique to find the best fit straight line in a scatter plot. The resulting line can help in Tableau predictive analysis.
What is Linear Regression with R Programming
Linear Regression, according to Wikipedia, is defined as follows:
“… an approach for modeling the relationship between a scalar dependent variable y and one or more explanatory variables (or independent variables) denoted x. The case of one explanatory variable is called simple linear regression.”
The R scripting language is widely popular with statisticians, data miners, and data scientists. There are numerous libraries that can be used within R that support various statistical analyses, such as linear regression and clustering. There are even libraries for high performance computing (Pandas) and interactive web visualizations (Shiny).
Read about R Linear Regression in detail
Prerequisites For Tableau Predictive Analysis
These are some prerequisites that should be followed before Tableau Predictive analysis – Linear regression with R Programming Language.
i. Install R. The R Project for Statistical Computing website is https://www.rorg/.
ii. Optionally, install RStudio from https://www.rstudio.com/, which is an integrated environment for R.
iii. Install the R serve package by running the following in R: packages(“Rserve”); library(Rserve); run.Rserve();
iv. You will get a message that says the connection is blocked:
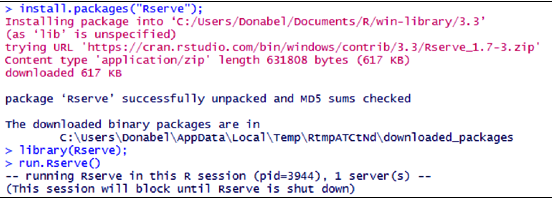
Prerequisites 4 – Tableau Predictive Analysis
v. Go to Help, and under Settings and Performance, select Manage External Service Connection…:
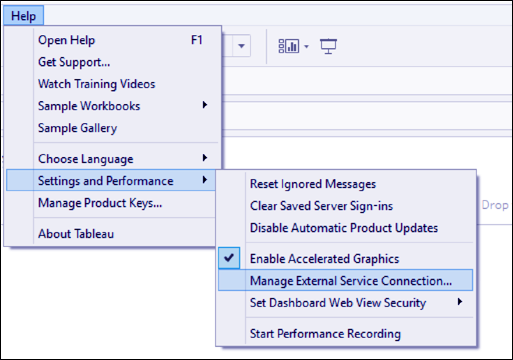
Prerequisites 5 – Tableau Predictive Analysis
vi. Type localhost for the Server:, and leave the Port/API Key: to 6311. Test the connection, and ensure you get a successful connection message before proceeding:
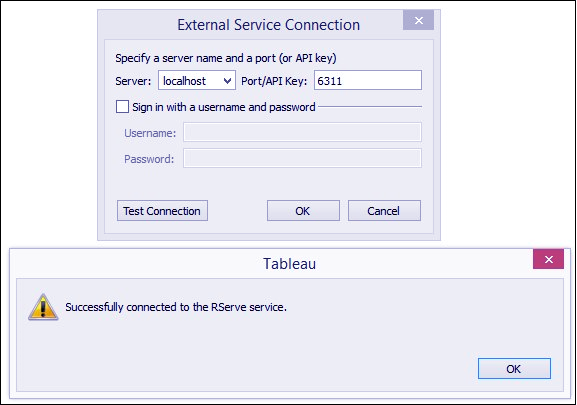
Prerequisites 6 – Tableau Predictive Analysis
Let’s Discuss Tableau Reporting – Tableau Data Analysis Report
Once R is ready and connected, you may proceed with the recipe.
To follow this recipe, open B05527_06 – STARTER.twbx. Use the worksheet called Integrating R, and connect to the CO2 (Worldwbank) data source:
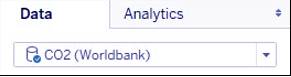
Tableau Predictive Analysis
How to Create R-Generated Trend Lines?
i. From Dimensions, drag Country Name to the Filters shelf.
ii. In the Filters window, choose Canada, China, and United States.
Do you Know How to Create Trend Line in Tableau
iii. From Dimensions, drag Country Name to Columns.
iv. From Dimensions, drag Year to Columns.
v. Right-click on the Year pill in Columns and choose Continuous.
vi. From Measures, drag CO2 Emission to Rows.
vii. Click on the null indicator that appears on the bottom right of the view and select Filter data:
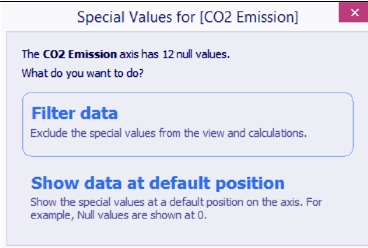
Step – 7 Creating R-Generated Trend Lines
Let’s Explore How to Create a Story in Tableau
viii. Create a new calculated field called Trend Line with the following R formula:
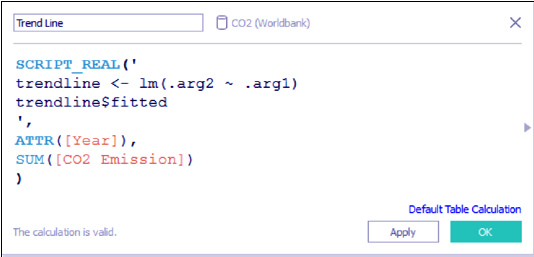
Step – 8 Creating R-Generated Trend Lines
ix. Drag the new calculated field Trend Line from Measures to Rows, to the right of CO2 Emission.
x. Right-click on the Trend Line pill and set Compute Using to Pane across.
xi. Right-click on the Trend Line pill and select Dual Axis
xii. Right-click on the Trend Line axis and select Synchronize Axis.
xiii. Right-click on the Trend Line axis and unchecked Show Header.
Let’s revise How Data in Tableau Export to PowerPoint and Word
Conclusion
In this tutorial, we studied about the Tableau Predictive Analysis – line regression with R, a few basics about it and creating a view. Hope you enjoyed the session. Share your feedback in the comment section.
Did you like our efforts? If Yes, please give DataFlair 5 Stars on Google


