Tableau Charts – Tableau Share Axis Chart
Placement-ready Courses: Enroll Now, Thank us Later!
In our last tutorial, we saw Tableau Joins. In this tutorial, we are going to study what is share axis Chart and how to create these charts. So, let us start with Tableau Share Axis Chart.
Tableau Share Axis Chart
A shared axis chart in Tableau is that shares one axis among multiple measures. This chart can be used when the measures have similarly ranged values and can be presented using one mark and one scale.
Create Share Axis Chart in Tableau
Following is the procedure to make share axis chart:
i. From Dimensions, drag Team Name to the Filters shelf.
ii. Under the General tab, check Suns.
iii. From Dimensions, drag Year to the Filters shelf.
iv. Under the General tab, choose 2009.
v. From Dimensions, drag League to the Filters shelf.
vi. Under the General tab, check N for NBA.
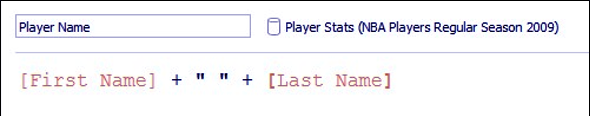
vii. If it doesn’t exist yet, create a calculated field called Player Name, and provide the following formula that concatenates [First Name] and [Last Name]:
viii. From Dimensions, drag Player Name to the Rows shelf.
ix. From Measures, drag Field Goals Made to the Columns shelf. This creates a horizontal axis for your view.
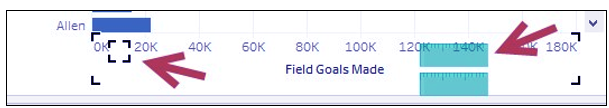
x. From Measures, drag Field Goals Attempted to the horizontal axis created by the Field Goals Made measure. Do not let go of the mouse until you see the double ruler icon appear on top of the axis.
xi. Right-click on the Field Goals Attempted field header in your view, and Edit alias.
Let’s discuss Tableau Date Functions with Examples
Change the alias to Attempted.
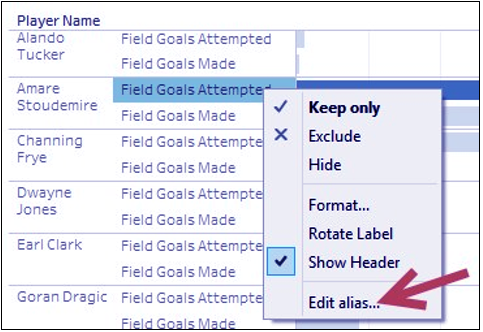
xii. Right-click on the Field Goals Made field header in your view, and Edit alias. Change the alias to Made.
xiii. Manually drag the Made field header and move it to before the Attempted field.
xiv. Control-drag the Measure Names field in your Rows shelf to the Color shelf.
xv. Click on the drop-down arrow beside the color legend and choose Edit colors….
xvi. Change the colors of your bar. Assign a red color to Made, and gray to Attempted. Close the edit box when done.
Conclusion
In this tableau tutorial, we learned about the share axis chart in Tableau, how to create tableau share axis chart and how to use them, thus completing another table on our list. Furthermore, if you have any query, feel free to ask in the comment section.
If you are Happy with DataFlair, do not forget to make us happy with your positive feedback on Google


