Tableau Box and Whisker Plot
Job-ready Online Courses: Dive into Knowledge. Learn More!
In this Tableau tutorial, we are going to learn about Tableau box and whisker plot and various steps to create them with examples. Let’s start!!!!
Tableau Box and Whisker Plot
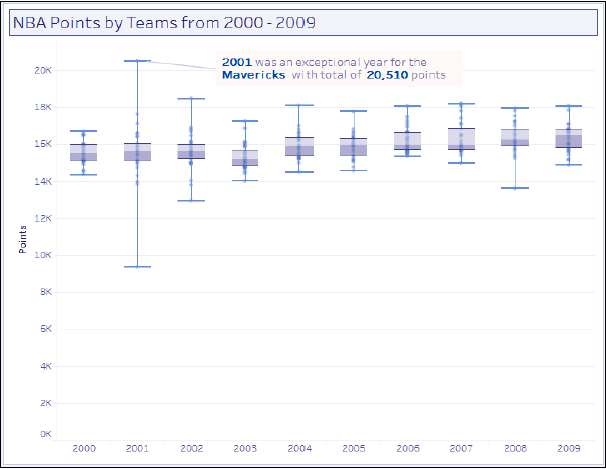
Tableau Box and whisker plot, also called box plots, are charts that divide their data points into quartiles. It is great at comparing distributions of data for different groups or categories side by side.
Let’s see Tableau Scatter Plot & Tableau Bar Chart in detail.
In this recipe, we will create a Tableau box and whisker plot that shows the spread of points garnered by NBA teams from 2000-2009.
How to Create a Box and Whisker Plot in Tableau

i. From Dimensions, drag League to the Filters shelf and filter to N for NBA.
ii. From Dimensions, drag Year to the Filters shelf and choose years 2000-2009.
iii. Ctrl + click Year from Dimensions and Points from Measures to select both data fields from the sidebar.
Follow this link for Tableau Save, Reorder and Delete Worksheet in detail.
iv. While Year and Points are still selected, expand Show Me.
v. Select the Box and Whisker plot icon in Show Me, as shown in the following screenshot. This will place Year in the
Details property in the Marks card, and SUM(Points) in the Rows shelf.
vi. Move Year from the Details in the Marks card to the Columns shelf.
vii. From Dimensions, drag Team Name to Details on the Marks card. 8. Click on Size in the Marks card to make the Circle marks smaller.
Read about Adding Worksheets And Renaming Worksheet In Tableau.
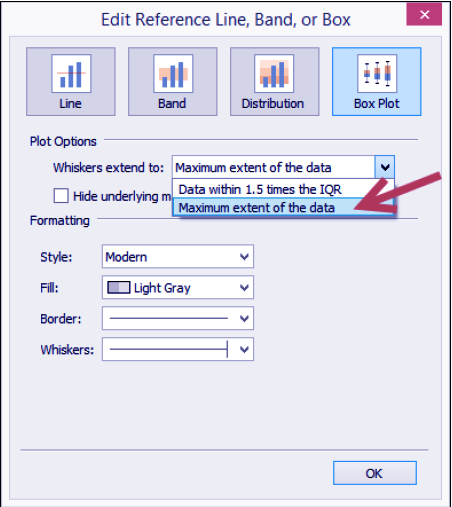
viii. Right-click on the box and whisker plot that gets created, and select Edit….
ix. Under Plot Options, choose the maximum extent of the data option for the Whiskers extends to a setting. Click OK when done.
Conclusion
In this tutorial, we learned about what Tableau Box and Whisker Plot are, how to create them with examples.
If you have any queries, feel free to ask in the comment section.
Your opinion matters
Please write your valuable feedback about DataFlair on Google


