Hierarchies in Tableau – A step by step guide to create Tableau hierarchy
Job-ready Online Courses: Knowledge Awaits – Click to Access!
In this tutorial, we are going to learn how to create hierarchies in Tableau. Hierarchies play a very important role in using the data fields in an organized manner. So, let us learn in a stepwise manner how to create and use hierarchies from your data set in Tableau.
What are Hierarchies in Tableau?
Before we start learning how to create hierarchies in Tableau, let us have a better understanding of hierarchies. The term hierarchy is not specific to Tableau and you might have heard and used it in many places before.
In the context of data, hierarchies are a logical arrangement of relevant unique attributes in a data set. Hierarchies arrange data fields in a level, for instance, a Geography hierarchy would have a region, country, state, city, area levels. Or, a Time hierarchy has a year, month, week, day as its levels.
By creating hierarchies in Tableau, we set our data on different levels of detail and organize it. Tableau can automatically create hierarchies by detecting relevant fields or you can create custom hierarchies.
Before moving ahead, have a quick revision of reporting in Tableau.
Creating Hierarchies in Tableau
Follow the steps given below to create hierarchies in Tableau.
Step 1: Drag a Field in Tableau Hierarchy
To start with creating a hierarchy in your data set, select a field from the list of dimensions and measures. Select and hold the field and drag it on to or on top of another field. By doing this, we add a field at a sub-level in the hierarchy.
Another way of adding a field in an existing hierarchy is to right-click on a field name, then select Hierarchy from the list. Then select Add to hierarchy option and select the name of the hierarchy in which you wish to add the field.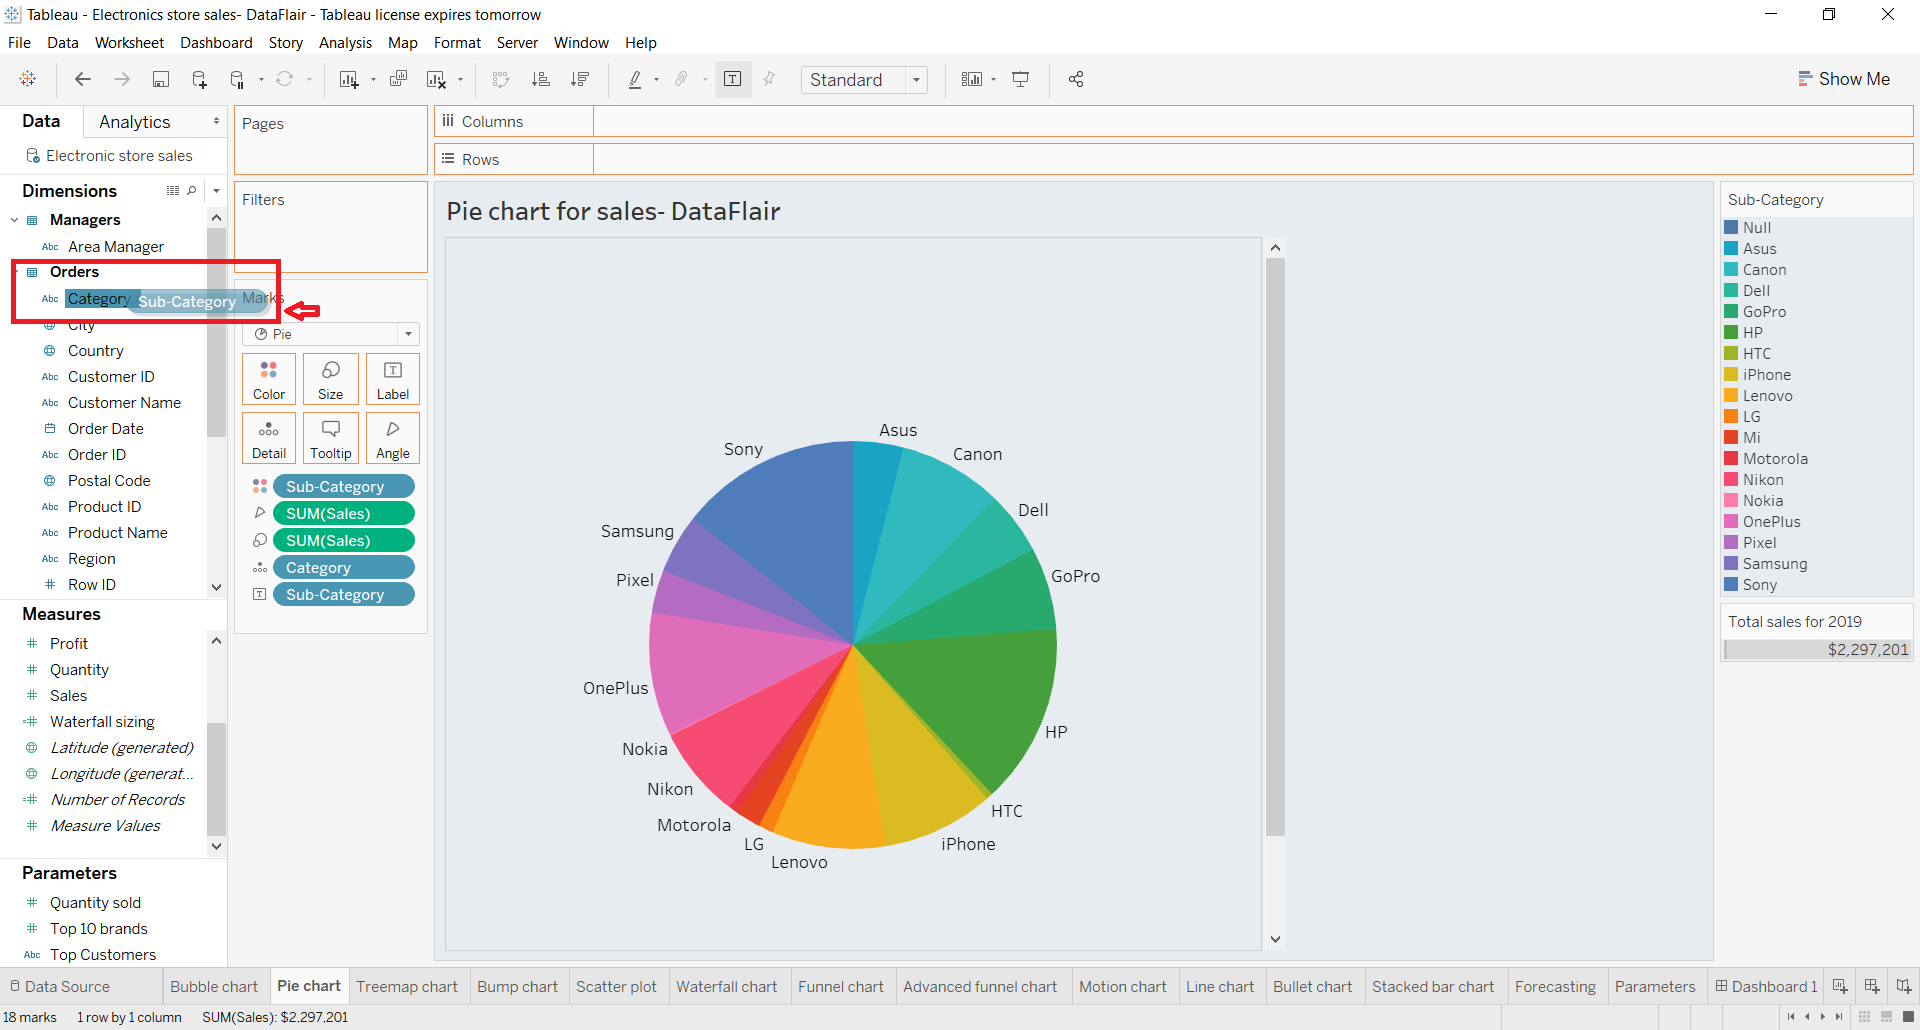
Step 2: Name the Hierarchies in Tableau
As soon as you add a field on the top of another field, a window pops up where you need to enter the name of the hierarchy. Enter a suitable name for the hierarchy and click on OK.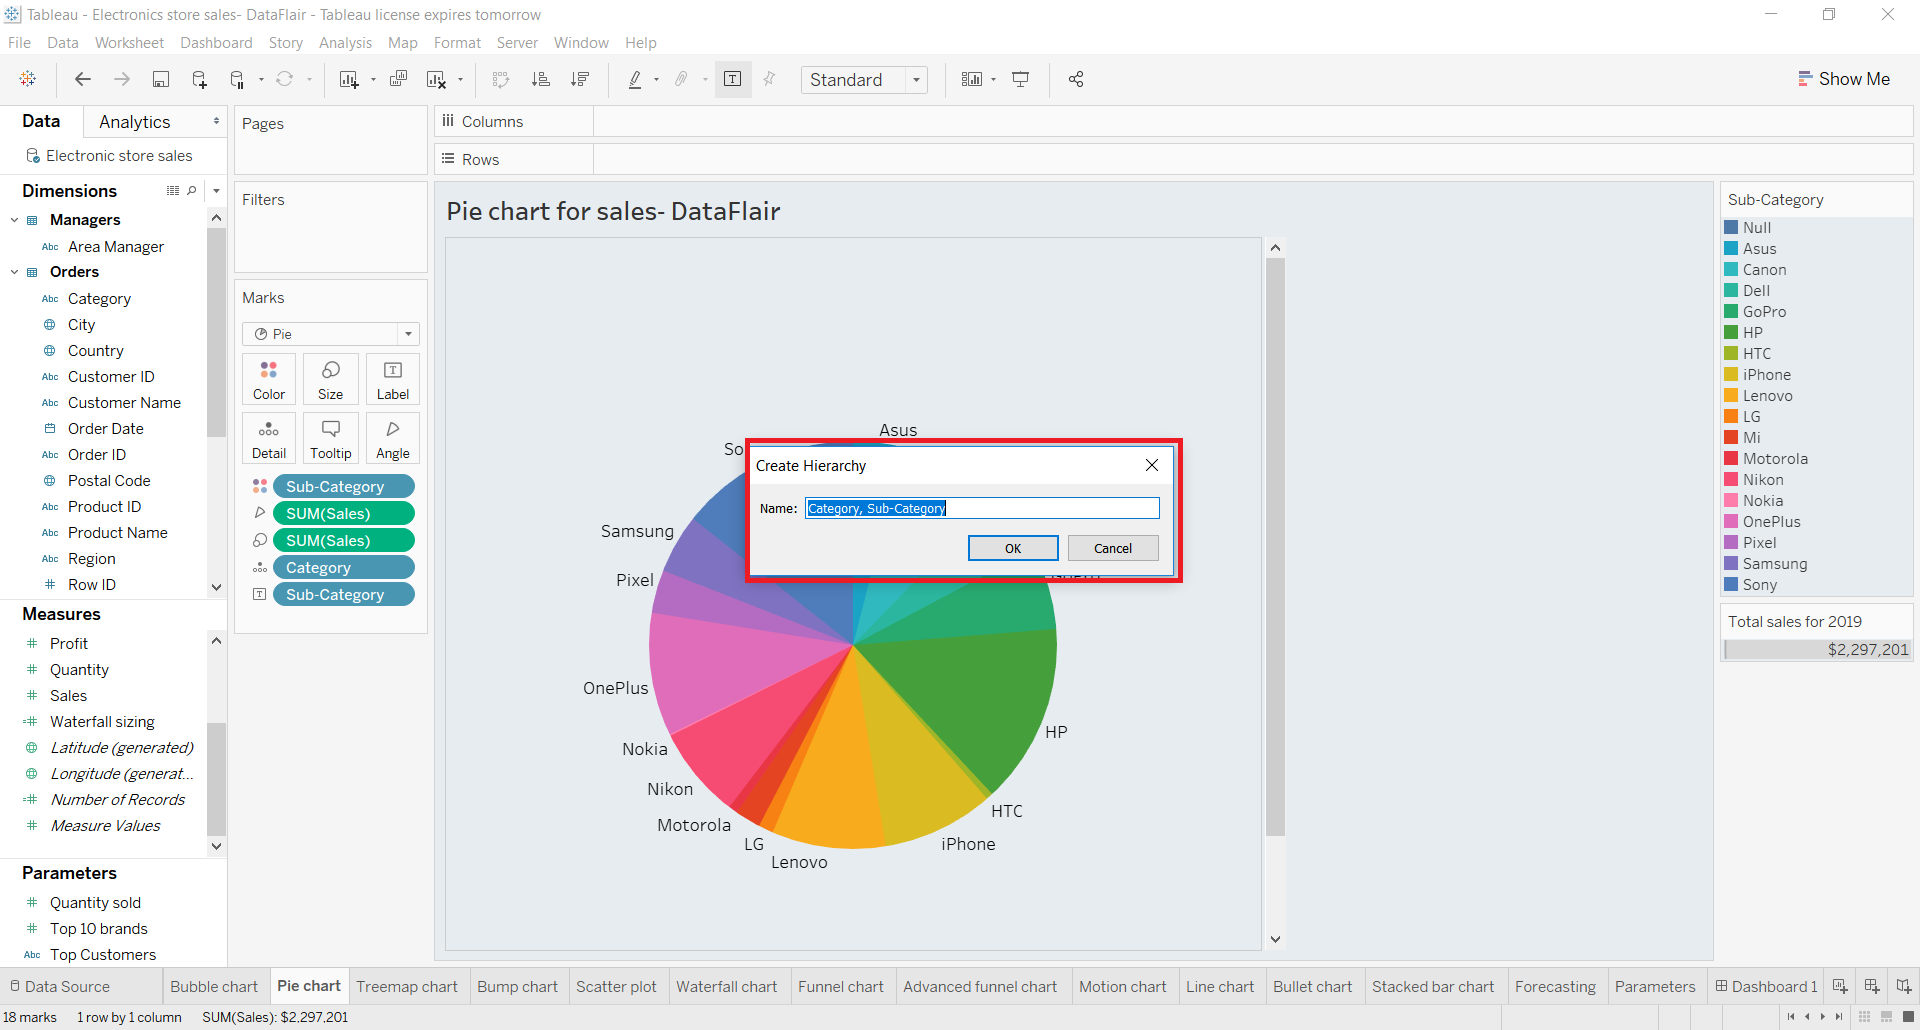
Step 3: Add More Fields in Tableau Hierarchy
Once you enter a name, your hierarchy can be seen on the left Data panel as shown in the screenshot below. We put the Sub-category field under the Category field. That is, Category is on the first level of the hierarchy and Sub-category is on the second level. Following step 1, you can add more fields under a field in a hierarchy.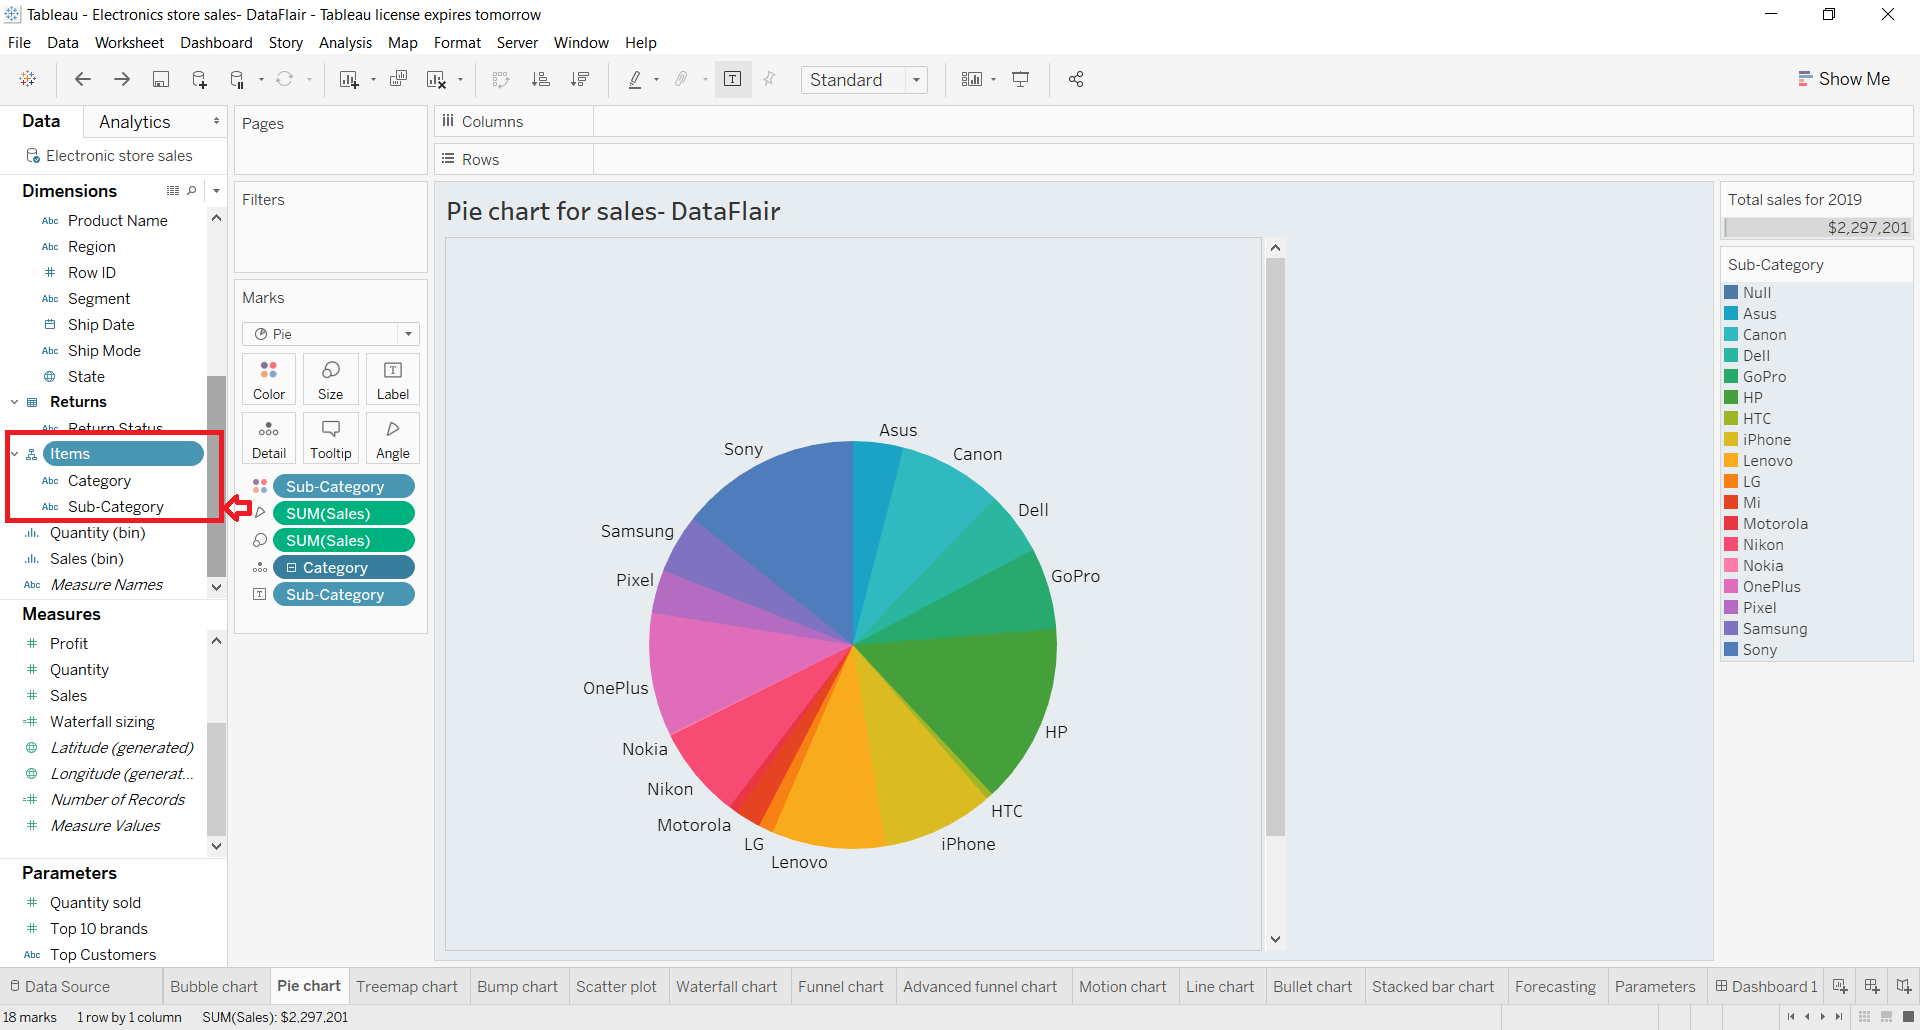
Step 4: Drill Down Hierarchy in Tableau
Now, you can use this hierarchy into visualization by putting it in a Rows or Columns section. To drill down in a hierarchy, click on the plus + sign given right next to a field name. As you can see in the screenshot below, our field Category is on the top of the hierarchy. When we click on the + sign near the field name, the field on a lower level in the hierarchy will be shown.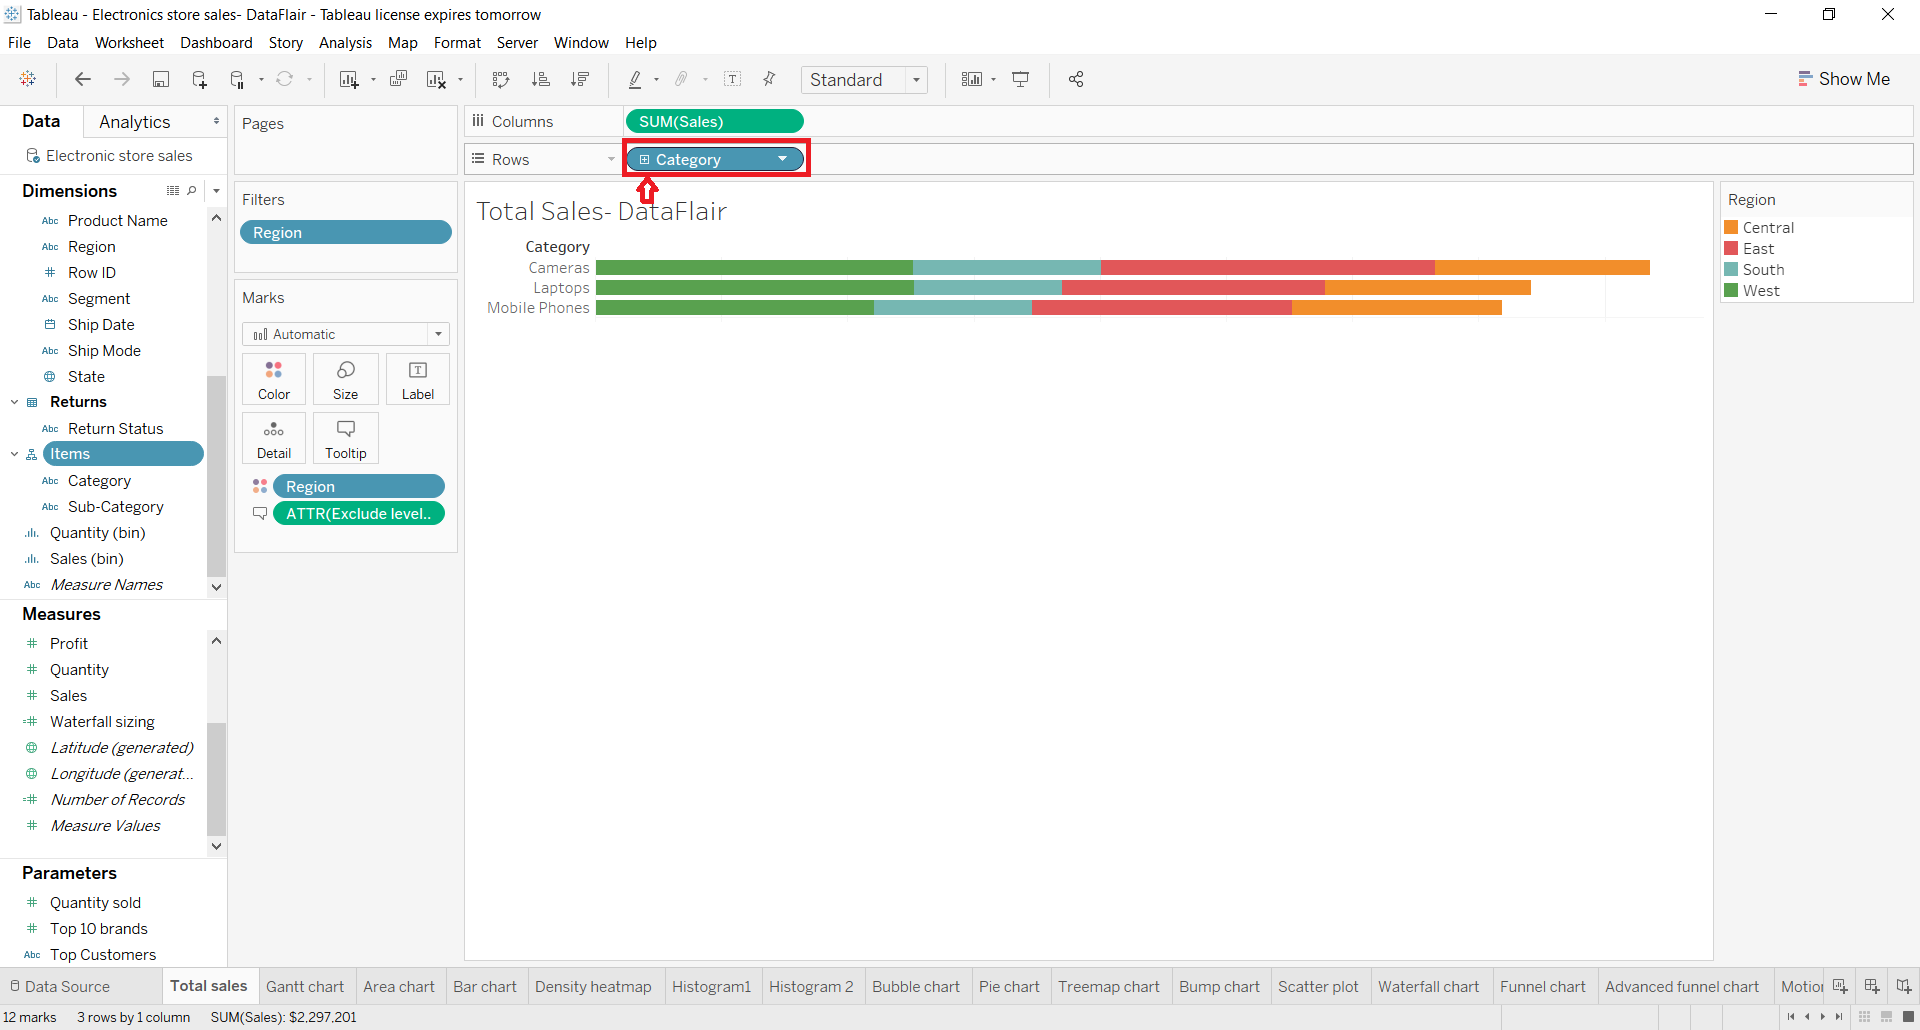
Step 5: Analyze Data in Tableau Hierarchy
As shown in the screenshot below, the field Sub-category and its contents are also visible in the bar chart now. This is after drilling-down the hierarchy by one level. To go back to the top or a preceding field in the hierarchy, click on the minus – sign present near a field name. In this way, you can easily drill up or down a hierarchy to see and analyze data at different levels of detail.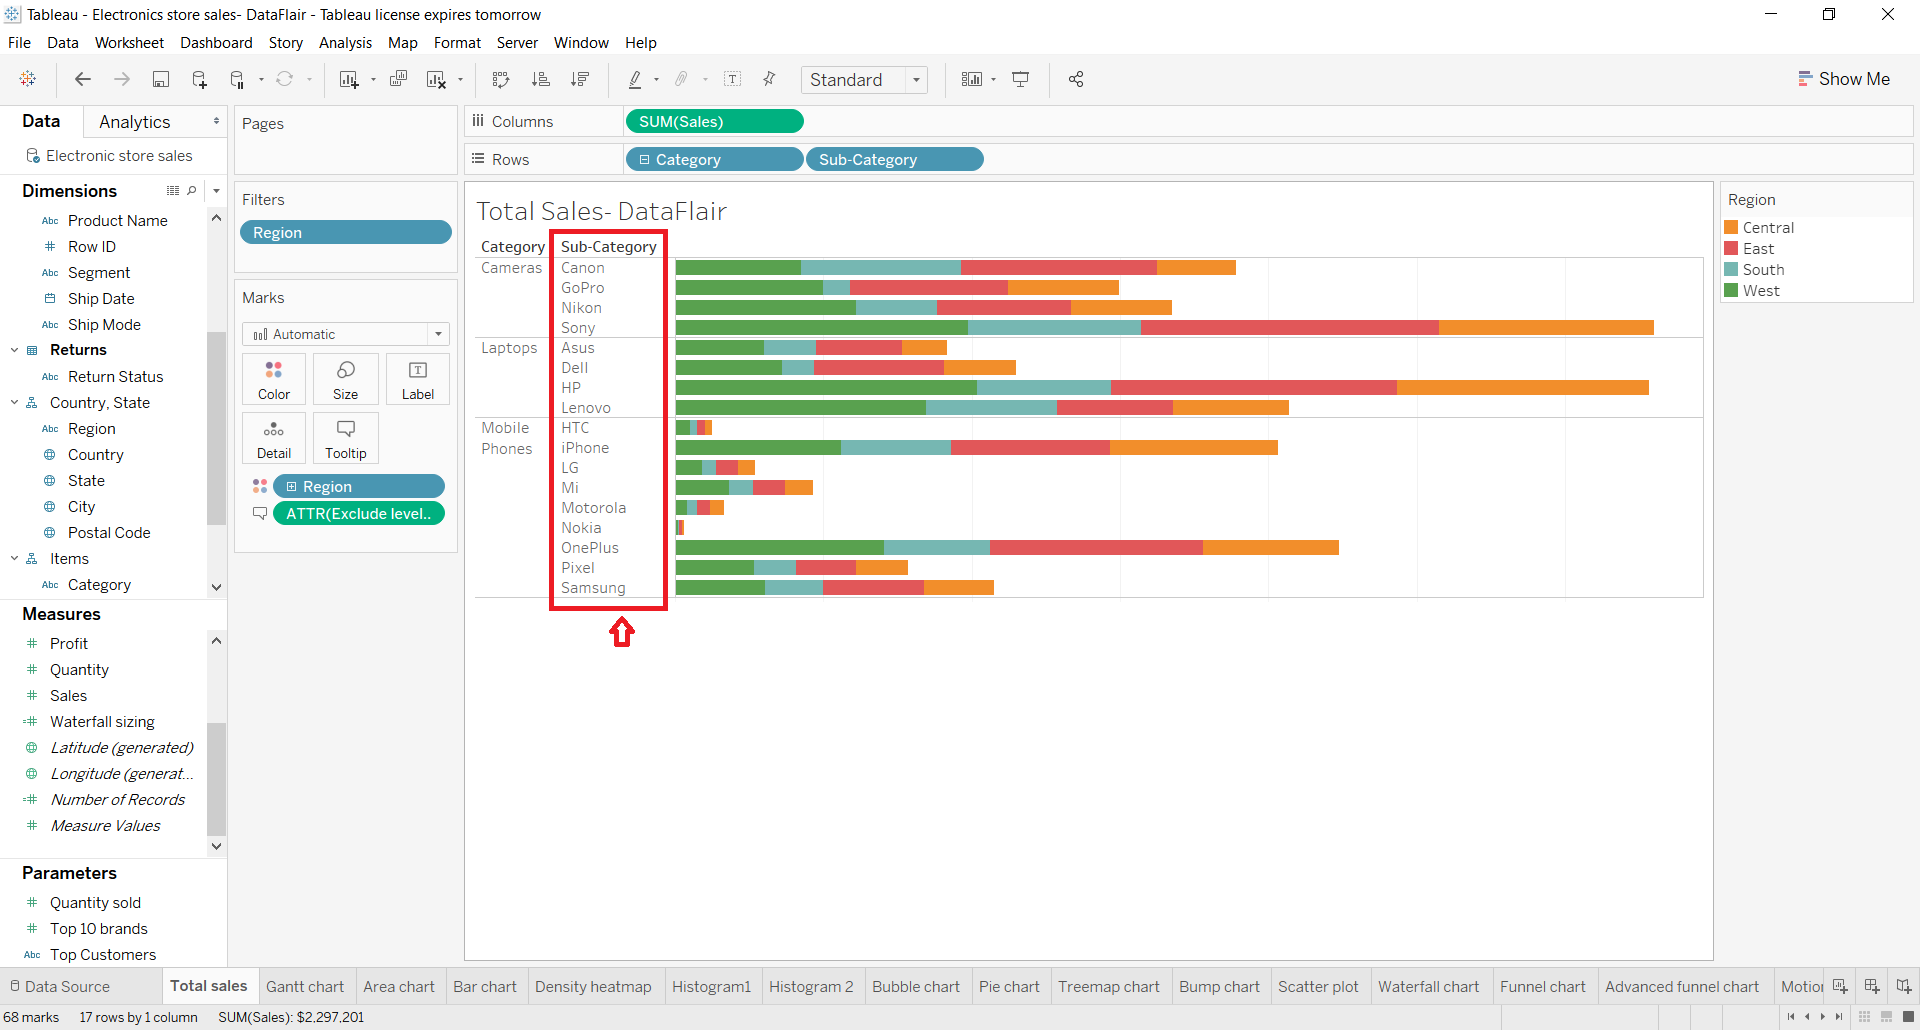
Step 6: Geo Hierarchy in Tableau
The screenshot below shows a geo hierarchy where hierarchy with the name Geography is created. Under it, there are fields at sub-level such as Region, Country, State, City, etc.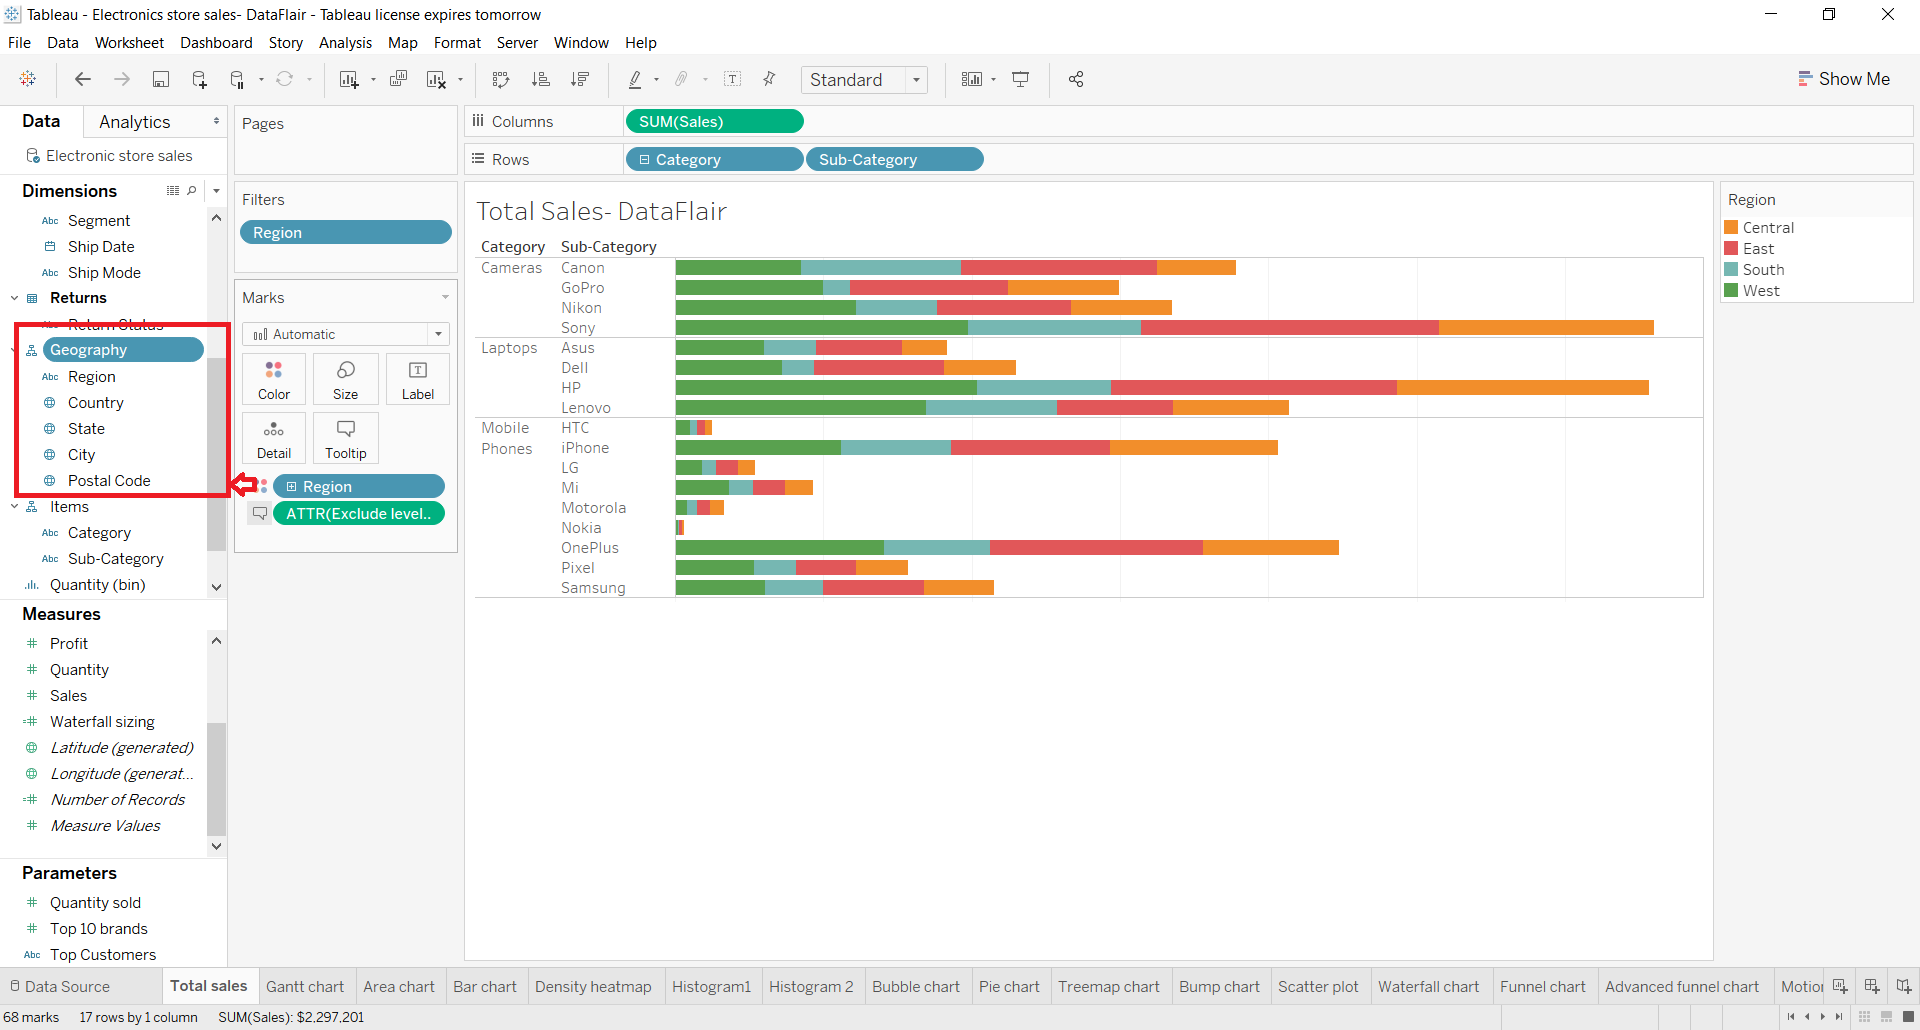
How to Remove a Hierarchy in Tableau?
To remove a hierarchy in Tableau all you need to do is right-click on the hierarchy name (present in the Data pane) and select the option Remove Hierarchy. This will remove all the fields from that hierarchy and its name will no longer show in the Data pane.
Summary
Finally, we learnt everything about Hierarchies in Tableau. We hope you were able to understand the concept behind hierarchies and how to create them in Tableau.
Now!! Learn how to create Trend Lines in Tableau with DataFlair.
Still if you have any queries, feel free to ask in the comment section. Our team will help you.
Happy Learning😃
Did you know we work 24x7 to provide you best tutorials
Please encourage us - write a review on Google


I want to create hierarchy such that when user click on categories, user only see data aggregated by subcategories. And dont want category in view.
Absolutely this. Basic Power BI function in Matrix visualization — this is a huge gap if Tableau cannot do it.
How do I use the hierarchy (drill down or roll up) when in Presentation Mode using Tableau Desktop (and not in Edit Mode as you have illustrated)?
“Before moving ahead, have a quick revision of reporting in Tableau.” I think you mean to say “review” instead of “revision”. The latter would imply changing something.