Tableau Tutorial for Beginners – A Comprehensive Guide
Job-ready Online Courses: Knowledge Awaits – Click to Access!
Let us start to learn a new Business Intelligence technology; Tableau. This chapter is an introductory chapter providing the fundamental knowledge of Tableau. In our complete Tableau tutorial for beginners, you can gradually progress towards learning the software fully, starting from topics of low difficulty and moving on the expert level chapters. However, for now, let’s focus on the basis so that you can have a solid foundation to lay your further knowledge on.
This Tableau tutorial for beginners starts from data visualization because data visualization plays a major and important role in a Tableau. Moving on we will discuss features, advantages, and architecture of Tableau to know it well. In addition, we will explore the list of companies using Tableau with different applications of a Tableau.
What is Data Visualization?
Data visualization plays a crucial role in the entire business intelligence dynamic. In simple terms, data visualization is a pictorial representation of a given set of data. A text-based data is visualized graphically in charts, graphs, tables, infographics, maps etc. So that new insights and hidden patterns can be detected in it. The motive of data visualization is to detect patterns, trends, and a correlation between different data sets and attributes that can’t be otherwise studied in data in a simple (non-graphic) form.
It helps users gain a better understanding of the market’s current situation and evaluate customer needs. This helps an enterprise to evolve through new strategies and techniques to enhance and foster the business. And this is precisely why all the data science software companies focus on making their BI tools best in data visualization capabilities as it helps in unveiling the hidden information in the huge reservoirs of raw data.
What is Tableau?
Tableau is a potent business intelligence and data visualisation tool that enables users to connect, visualise, and exchange data in a dynamic manner. It is often used in many different sectors to visually explore, analyse, and display data, making complicated datasets more approachable and clear to non-technical consumers.
Data Connectivity, Interactive Visualisations, Data Blending, Dashboards and Storytelling, Advanced Analytics Integration, Real-Time Data Analysis, Data Collaboration, and User-Friendly Interface are some of Tableau’s key features and traits.
Tableau is extensively used for data analysis, reporting, and decision-making across a variety of industries, including banking, marketing, education, and government. It is a top tool for data visualisation and business intelligence because of its capacity to produce interesting and engaging data visualisations.
Tableau’s Popularity
Tableau proves its efficiency and potential, which cannot deny as it has made users curious and drawn enough attention towards it ever since it was launched. It is currently one of the leading business intelligence tools.
The key factors behind its enormous popularity is its easy drag-and-drop functionality, it is faster than other BI tools, high scalability as it adapts to individual as well as enterprise needs easily, it has mobile compatibility, an online version, connectivity to a huge number of data sources without needing to buy connector license, big data analytics capabilities etc.
Also, Tableau specially designs for all kinds of users and does not require any specific skill set or knowledge to work on it. Users from all over the enterprise can easily perform all the data analysis and visualization capabilities.
Tableau Features
In this section of the Tableau tutorial for beginners, we will discuss all the available features and capabilities of Tableau. Some features like “ask data”, “Tableau prep connector” and “new mobile app design” are added in the 2019 version of Tableau.
1. Ask data: This is a very unique feature of Tableau, where the user can type a query in a natural language (English) and the system will respond immediately with the search result. Ask data can be used in data sorting, filtering, and aggregations.
2. Tableau prep conductor: It is an add-on feature for especially for Tableau Server and Tableau Online. The conductor helps in delivering prepared data in a secure, scalable and reliable server environment.
3. Tableau mobile for iOS and Android: A redesigned mobile app compatible for iOS and Android platforms with better functionalities of searching, favorites, offline previews etc.
4. Connectors and connections: The latest Tableau version comes with a lot of data connectors like Google Ads, Microsoft Azure SQL data warehouse, snowflake connector, etc. Also, you can establish secure connections with Dropbox, OneDrive, Google drive, Google Big Query, Secure RServe etc.
5. Data sharing: You can export the Tableau reports, visualization and dashboards as presentations on PowerPoint. You can also share the Tableau results with a link redirecting the user to the source workbook. Also, improvements for Okta integration are done.
6. Install and deploy: Features such as mobile layout preview on the web, nested sorting improvements, tableau mobile for Workspace ONE, etc. enhance the efficiency of Tableau.
7. Design view and visualization: Heat map, vector map, set actions, transparent worksheet backgrounds, navigation buttons for dashboard and Tableau navigation actions are all latest additions.
Tableau Products
This part of the tableau tutorial for beginners covers all the products offered by Tableau:
Tableau offers a range of products specific to user groups and the purpose of use. The products offered by Tableau can be classified into two or three main categories i.e. the products that are used for preparing data for analysis like Tableau Prep. The products that are used for the creation of dashboards, reports using graphs, charts etc.
Tableau Desktop and Tableau Public fall into this category. The third category is of the tools that are used to share the reports and workbooks created using developer tools with other users. Tableau Online, Tableau Server and Tableau Reader fall in this category.
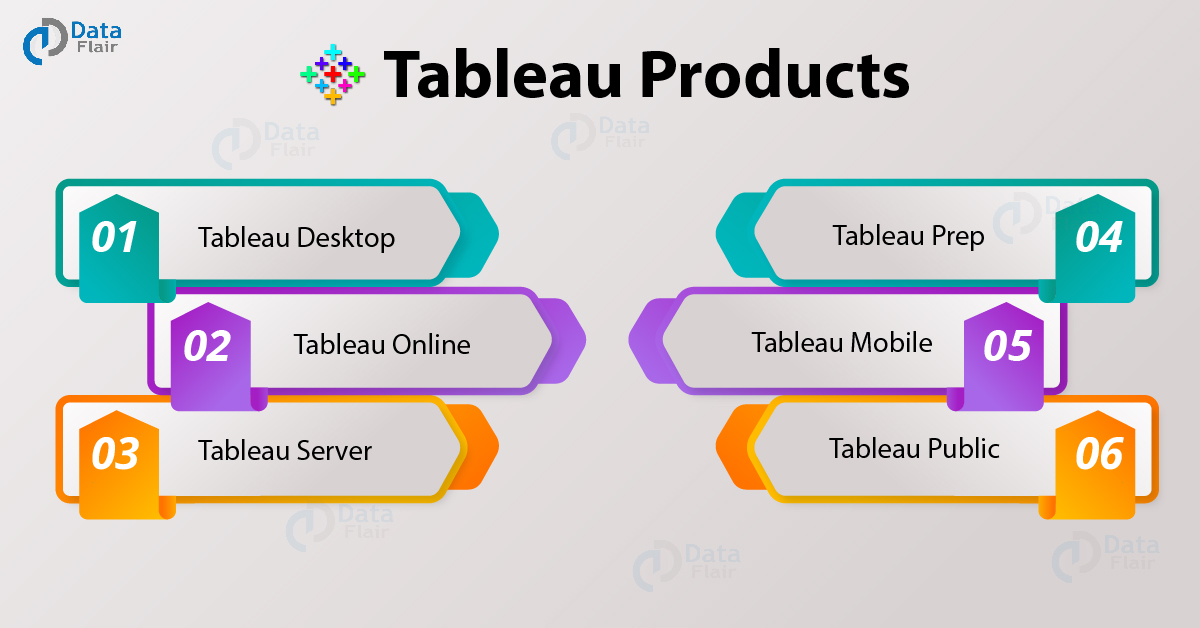
1. Tableau Desktop
Tableau Desktop is the ultimate data analysis and visualization tools used to create analytical dashboards and conduct self-service analytics. You can use all sorts of visualization tools like charts, graphs, maps, and tables to create dashboards using the prepared data in Tableau. Also, using Tableau Desktop you can get fast actionable insights, connect to many data sources like Google Analytics, big data sources, SQL databases, Salesforce etc, use advanced maps for visualizing geographic data, share and collaborate securely, etc.
There two versions of Tableau Desktop; Tableau Desktop Personal edition and Tableau Desktop Private edition. The personal edition is for personal use and offers limited data access and sharing capabilities. Whereas, the professional edition is made for enterprise use and allows full data access and sharing capabilities.
2. Tableau Online
Tableau Online is primarily a data sharing tool deployed on the cloud. Users can connect to about 40 data sources online like Spark SQL, Hive, Amazon Aurora and MySQL etc. Also, the workbooks and reports create on Tableau Desktop can share via the cloud to others.
In Tableau Online, the data store on cloud servers and maintained by Tableau groups. This tool requires no hardware installation and thus, no maintenance costs. It offers functionalities such as ask data, interaction, editing and authoring via the web, data access, and analysis anywhere, anytime, data management capabilities etc.
3. Tableau Server
Like Tableau Online, Tableau Server is also a workbook and dashboard sharing tool. Basically, any workbook/report/dashboard that is required to be shared must first be published on the Tableau Desktop. Once it is published there, it automatically gets loaded in the server.
From the server, any authorized user or licensed service can use the uploaded report. It is not necessary for the user, on the other hand, to have a server installed, as the workbooks can be accessed just by a simple login on any Tableau platform. The Tableau Server can be centrally managed from the admin of the organization.
4. Tableau Prep
Tableau Prep is a unique product of Tableau. Using Tableau Prep, one can prepare the raw data and make it ready for presenting and analysis. It provides interfaces and tools to combine, filter and transform raw data from data sources into a usable form. All kinds of users across the organization can easily use this tool. There are two editions of Tableau Prep; a Tableau Prep Builder that helps you build your data flows and Tableau Prep Conductor which manages, schedule and shares the flows built in Prep Builder.
5. Tableau Mobile
Tableau Mobile is for using Tableau on mobile devices such as mobile phones and tablets. It is scalable and adjusts to the screen dimensions. You can interact using touch gestures with the workbooks and dashboards created on Tableau Desktop and Tableau Public and shared via Tableau Server and Tableau Online. You can select, filter, drill-down and draw insights instantly with the data on your fingertips on your mobile device. Along with this, Tableau Mobile is loaded with dashboard designing, security, sharing, searching and alerts capabilities.
6. Tableau Public
Tableau Public, as the name suggests is a public platform where anything a user creates (a workbook or a dashboard), it will share publicly on a public cloud sever from where it is accessible to everyone and anyone. Thus, there is a huge Tableau Public community where anyone can view and analyze any piece of information shared across the globe. Users are providing a storage space of 10GB where they can save their dashboards and workbooks.
7. Tableau Reader
Users may see and interact with Tableau workbooks made by others using the free desktop application Tableau Reader. However, He cannot publish or edit the content.
8. Tableau Embedded Analytics
Tableau gives developers the ability to embed Tableau visualisations into other online apps or portals, enabling them to include robust analytics right into their applications.
Advantages of Tableau
Let us now shine some light on all the advantages of Tableau –
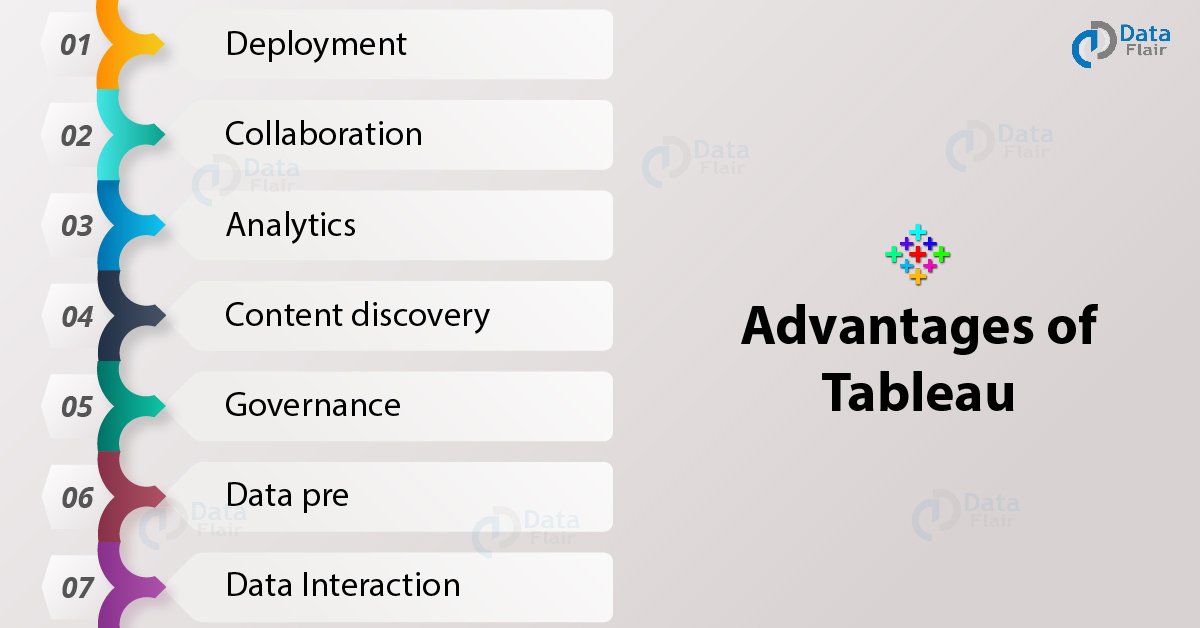
1. Deployment
You can deploy Tableau on many platforms, on-premise or on-cloud. It supports Hosted, multi-tenant deployments as well as platforms like Linux, Windows, and Mac.
2. Collaboration
Data collaboration is a smooth experience in Tableau as it allows the integration of data from a wide range of data sources. You can fetch data from an Excel worksheet, a PDF file, a database like Microsoft SQL Server, Microsoft Azure SQL database, data warehouses like Oracle, or big data sources like Cloudera Hadoop, or cloud data sources such as Salesforce, Amazon Web Services etc. Also, you can easily connect to live data sources and do real-time analysis.
3. Analytics
Tableau offers one of the best analytical functionalities with a state-of-the-art visual interface, statistical capabilities, advanced analytics, calculations, intelligent search capabilities like Ask data.
4. Content discovery
Content discovery is made easier by functionalities like revision history, ask data that search relevant data and shows an association, recommendation of relevant data, resource organizing by a project.
5. Governance
Data management, monitoring and security provisions are intact and improves with every new version of Tableau. In tableau data manage centrally, along with this, licenses and certifications, user authorization, row-level permissions, usage analytic make working in Tableau environment well-organized and proper.
6. Data prep
Tableau wins good points for its data prep capabilities as a user can prepare data for analysis by transforming and manipulating it according to one’s requirement. An interactive user interface makes the process easier. Along with this, smart grouping algorithms help in organizing the data. You can use the prepared data in dashboards and workbooks.
7. Data interaction
You can interact with your data, analyze data on dashboards and shared/published workbooks on any type of device. The devices supported are desktop, mobile, browser, and web-based or embedded platforms.
Architecture of Tableau
The Tableau tutorial is incomplete without the Tableau architecture. Behind any efficient tool, is its well-designed architectural framework and services. Same is the case with Tableau which proves to be one of the best BI tools because of its architecture.
The architectural components of Tableau are such that they ensure scalability, availability, governance, security, and management of data and reports created using Tableau. It is a multi-tiered, multi-user, multi-thread and multi-process architecture that you can run on both physical and virtual environments/machines.
The architecture has got components that efficiently manage data flow (in any form) between the data sources and the clients. The core component is the Tableau Server which hosts different services working in tandem.
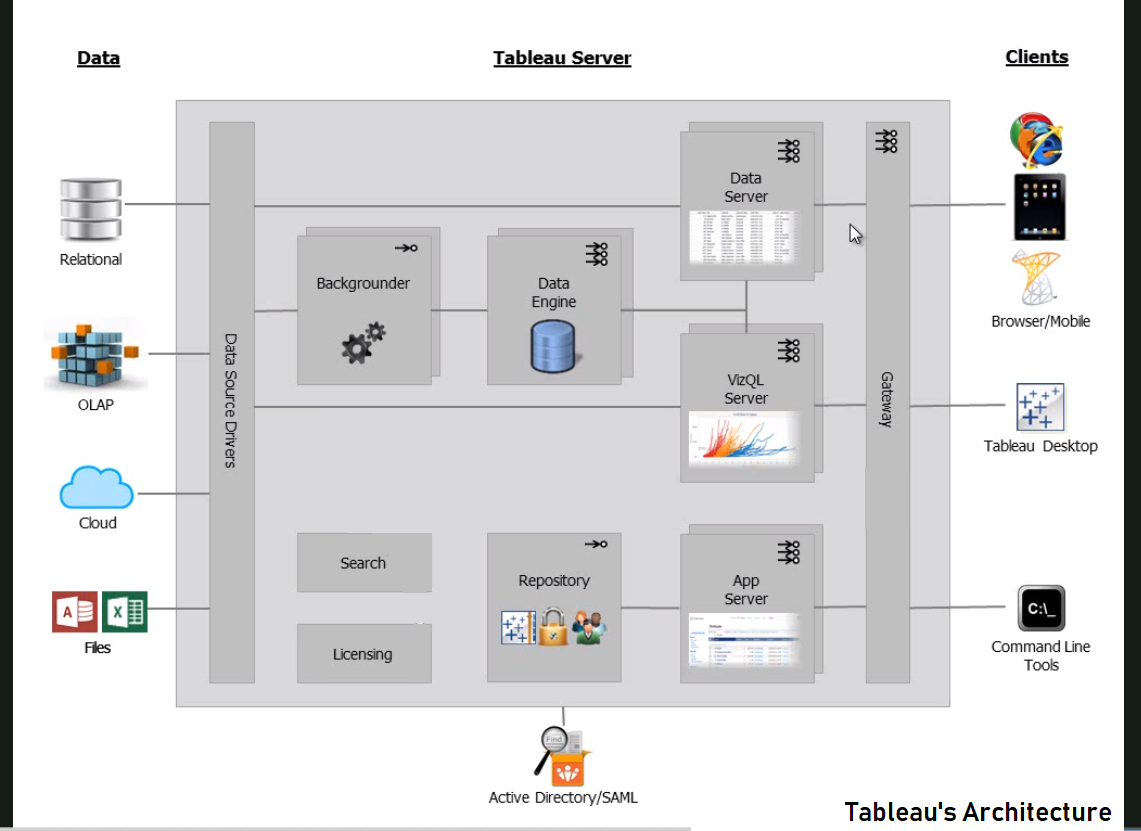
Tableau Applications
Tableau finds its applications in a broad range of industries such as,
- Healthcare analytics
- Education analytics
- Government sector
- Marketing analytics
- Insurance analytics
- Hight technology analytics
- Loan risk analysis
- Public sector
- Communication, media, and technology
- Energy and resources
- Retail and consumer goods
- Financial services
- Manufacturing
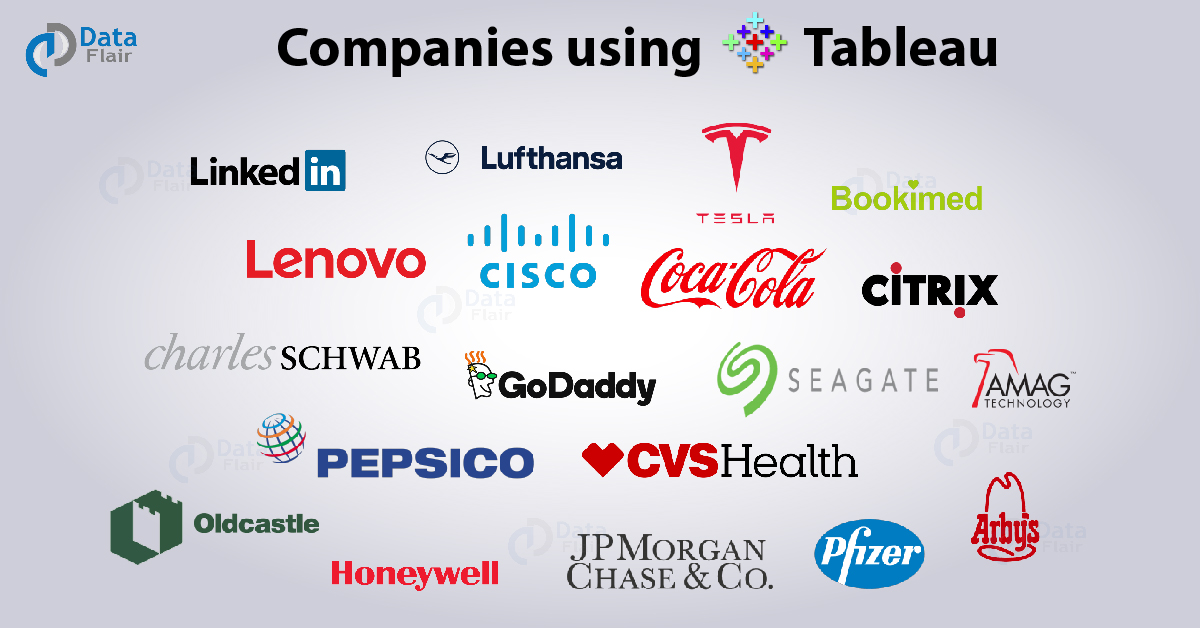
Companies Using Tableau
We end this tableau tutorial for beginners with this list of Companies using Tableau throughout the world.
- Cisco
- Pepsico
- CVS Health
- Coca-Cola
- Lenovo
- Bookimed
- JPMorgan
- Lufthansa
- Pfizer
- Charles Schwab
- Honeywell
- Arbys
- Oldcastle
- AMAG
- Seagate
- GoDaddy
- Citrix
- Tesla
Summary – Tableau Tutorial for Beginners
- Tableau provides better security than other BI tools and respects your existing security protocols.
- Tableau server helps to reduce network traffic and gives you smooth functioning.
- It provides great support to the end-users, so the professionals can focus on strategic issues.
- There are minimal hardware requirements of Tableau Desktop.
Hope you liked the explanation of Tableau Tutorial for beginners. Stay with us, as we unravel this amazing BI tool topic by topic, in our full-length Tableau tutorial. If you have any suggestions and queries, do write to us in the comment section below. If you like this Tableau tutorial for beginners, please share with your friends.
Your 15 seconds will encourage us to work even harder
Please share your happy experience on Google


Hello,
Where can I find the raw data being used in your tableau tutorials? BTW, there are some some excellent tutorials! Not just tableau, but other technologies too.
THANK YOU!!
Yea.. I can’t find them either. These tutorials would be very useful with the data, but I can’t do anything without it.