LOD in Tableau – Exploiting Data bit by bit
Job-ready Online Courses: Click, Learn, Succeed, Start Now!
Moving on with our Tableau learning spree, in this tutorial we are going to learn about another interesting topic, that is, Level of Detail or LOD in Tableau. In this tutorial, we are going to learn about the types of LOD expressions, how to create LODs in Tableau with examples. So let’s start!!!!
What is LOD in Tableau?
Level of Detail (LOD) are expressions that give a user the freedom to control data computations on different levels of granularity in Tableau. We can perform simple or complex computations at a more granular level (INCLUDE LOD), or at a less granular level (EXCLUDE LOD), or at an independent level (FIXED LOD).
Thus, based on your choice of level of granularity or detail, you can either compute data directly at the data source or at the visualization level. In a way, LOD expressions allow us to perform calculations at different levels of data granularity where we can apply it on a row-level (unaggregated) or on a view level (aggregated).
Let us learn more about LOD in Tableau and how to use it in Tableau in the sections to follow.
Types of LOD in Tableau
Now that we know a fair share about LODs. Let us understand and learn more about the different types of LODs used in Tableau for the purpose of analysis.
1. FIXED LOD in Tableau
The FIXED type of LOD expression involves calculations that only considers the dimensions specified by the user. Whenever we are writing or forming a LOD expression, it can consist of more than one dimension as a part of a calculation. So, some dimensions will be the dimensions that the user enters specifically and some dimensions are already going to be present in the view.
Therefore, in the FIXED LOD type, the calculation only considers or computes the data values based on user-specified dimensions. It does not take into account the dimension present in the view.
For instance, if we wish to calculate total sales by Region without calculating it for each state present in the regions, we can use FIXED LOD expression. Here, the LOD expression { FIXED [Region] : SUM( [Sales] ) } will only calculate the sum of sales for each Region ignoring the States present on the view which is related to the Region dimension.
2. INCLUDE LOD in Tableau
As the Fixed LOD type was not taking into account the dimensions present in the view, the INCLUDE LOD in Tableau does exactly the opposite. It takes including the view dimension into the calculation. This means that the INCLUDE expression will include an additional dimension along with the one specified by the user.
If the user wants to calculate region-wise sales such that it shows sales per state along with the region-wise sales. To achieve this, one has to use INCLUDE expression.
3. EXCLUDE LOD in Tableau
The EXCLUDE level of detail or LOD in Tableau is used when we wish to omit a dimension from the view level of detail. As opposed to what we saw in the INCLUDE type of LOD in Tableau where a dimension from the view level of detail was being added with the user-specified dimension.
In the EXCLUDE type, the dimension from the view level of detail is subtracted or omitted from the user-specified dimension. We will understand it better with the help of an example.
LOD Expression Syntax
The Level Of Detail or LOD expression has a syntax that you need to keep in mind while using the LOD expressions in Tableau data analysis.
The LOD expression syntax is given below,
{[FIXED | INCLUDE | EXCLUDE] <dimension declaration > : <aggregate expression>}
This expression syntax is made of smaller elements if we try to break it down.
- { } : The first important part of the entire expression is to put it inside the curly braces.
- [ FIXED | INCLUDE | EXCLUDE ] : The next element is to mention the type of LOD in Tableau that we wish to use as per our requirements depending upon our analysis.
- < dimension declaration > : The next element is where we declare the dimensions that we wish to use in our calculation. You can mention more than one dimension here by simply separating them using commas such as [Region], [State], [City], etc.
- < aggregate expression > : The last element in a LOD expression is the aggregate expression where we apply an aggregation condition on a dimension. We must always keep in mind to separate the dimension declaration and aggregate expression elements.
Working with LODs in Tableau
In this section, we are going to learn about creating and applying LOD expressions in our work with data in Tableau. Here, we have shown how to create all three main types of LODs which are FIXED, INCLUDE and EXCLUDE with our sample data.
STEP 1: Setting Up a Visualization
In order to create LOD expressions in Tableau, we first need to select a chart or visualization in which we need to use the created LOD. In our sample, we have taken a stacked bar chart for sales as you can see in the screenshot below. The stacked bar chart has Sales plotted against Region.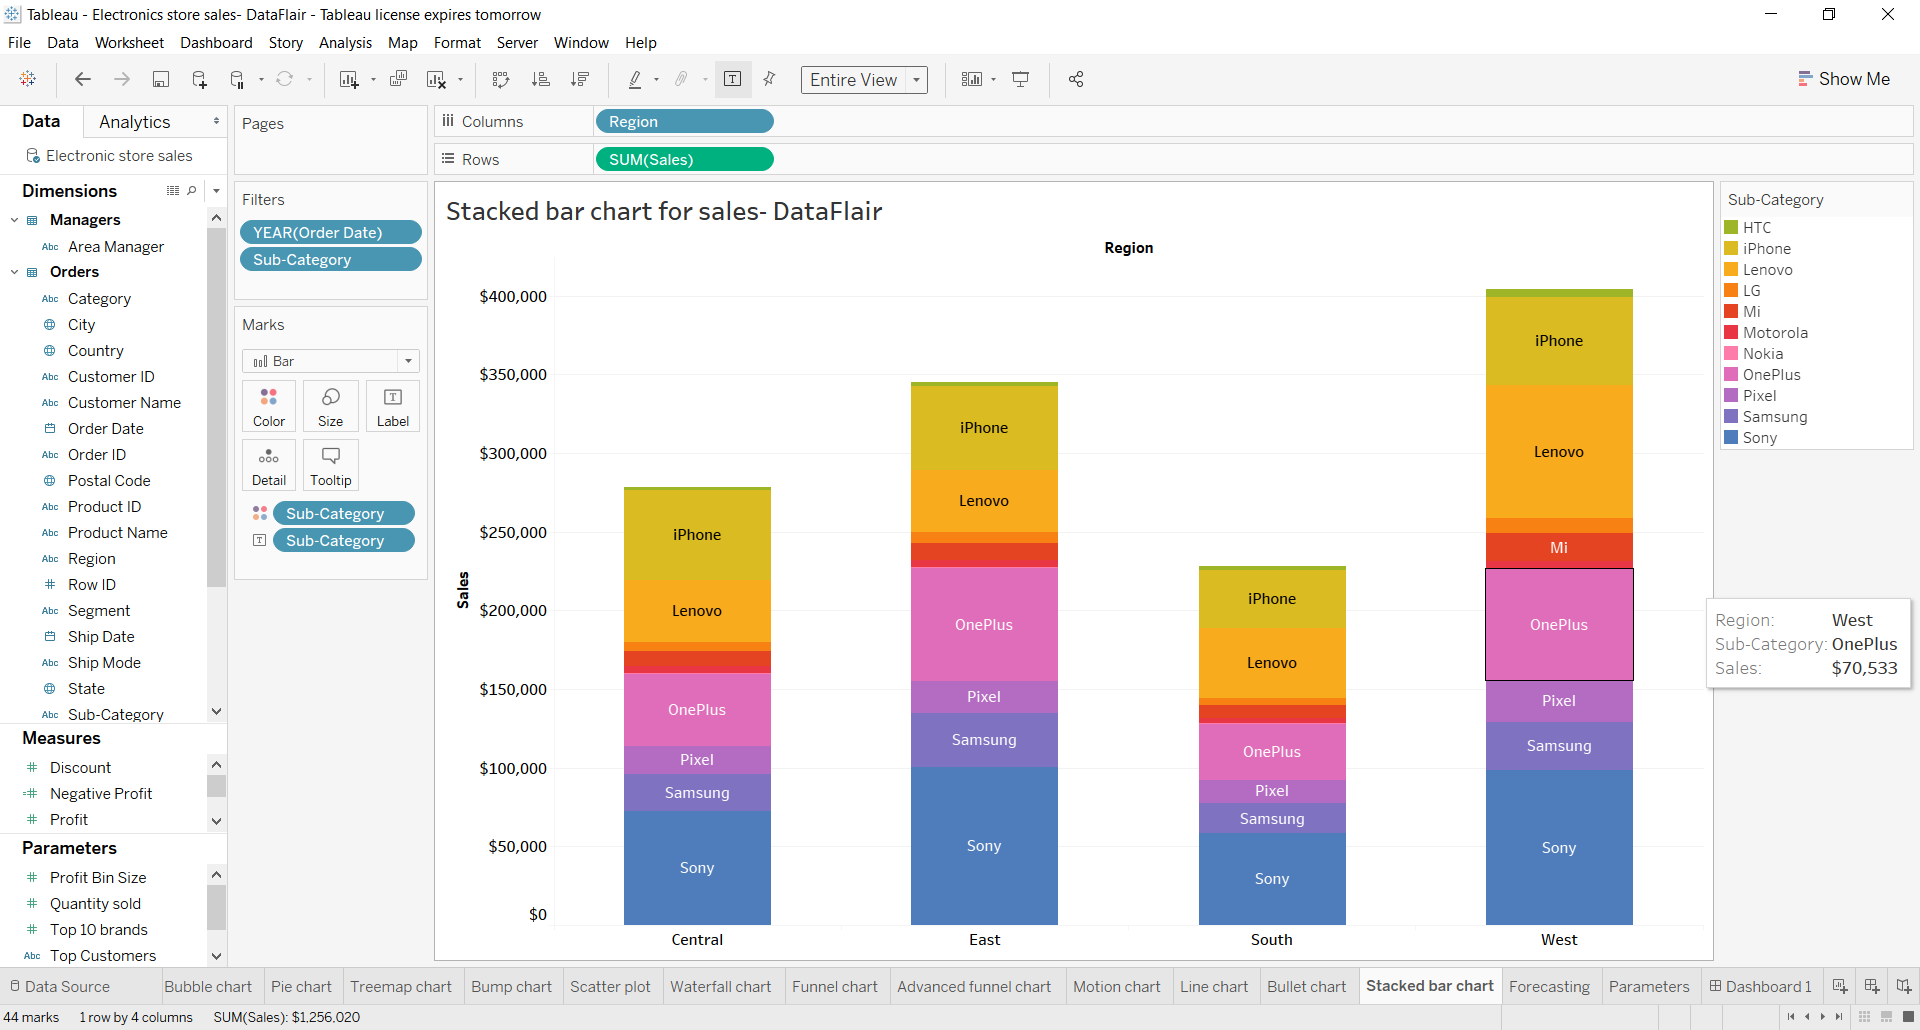
STEP 2: Creating a LOD Expression
The first step of creating a LOD expression is to create a calculated field. To do that, right-click on the Dimension section and select Create Calculated Field.. option.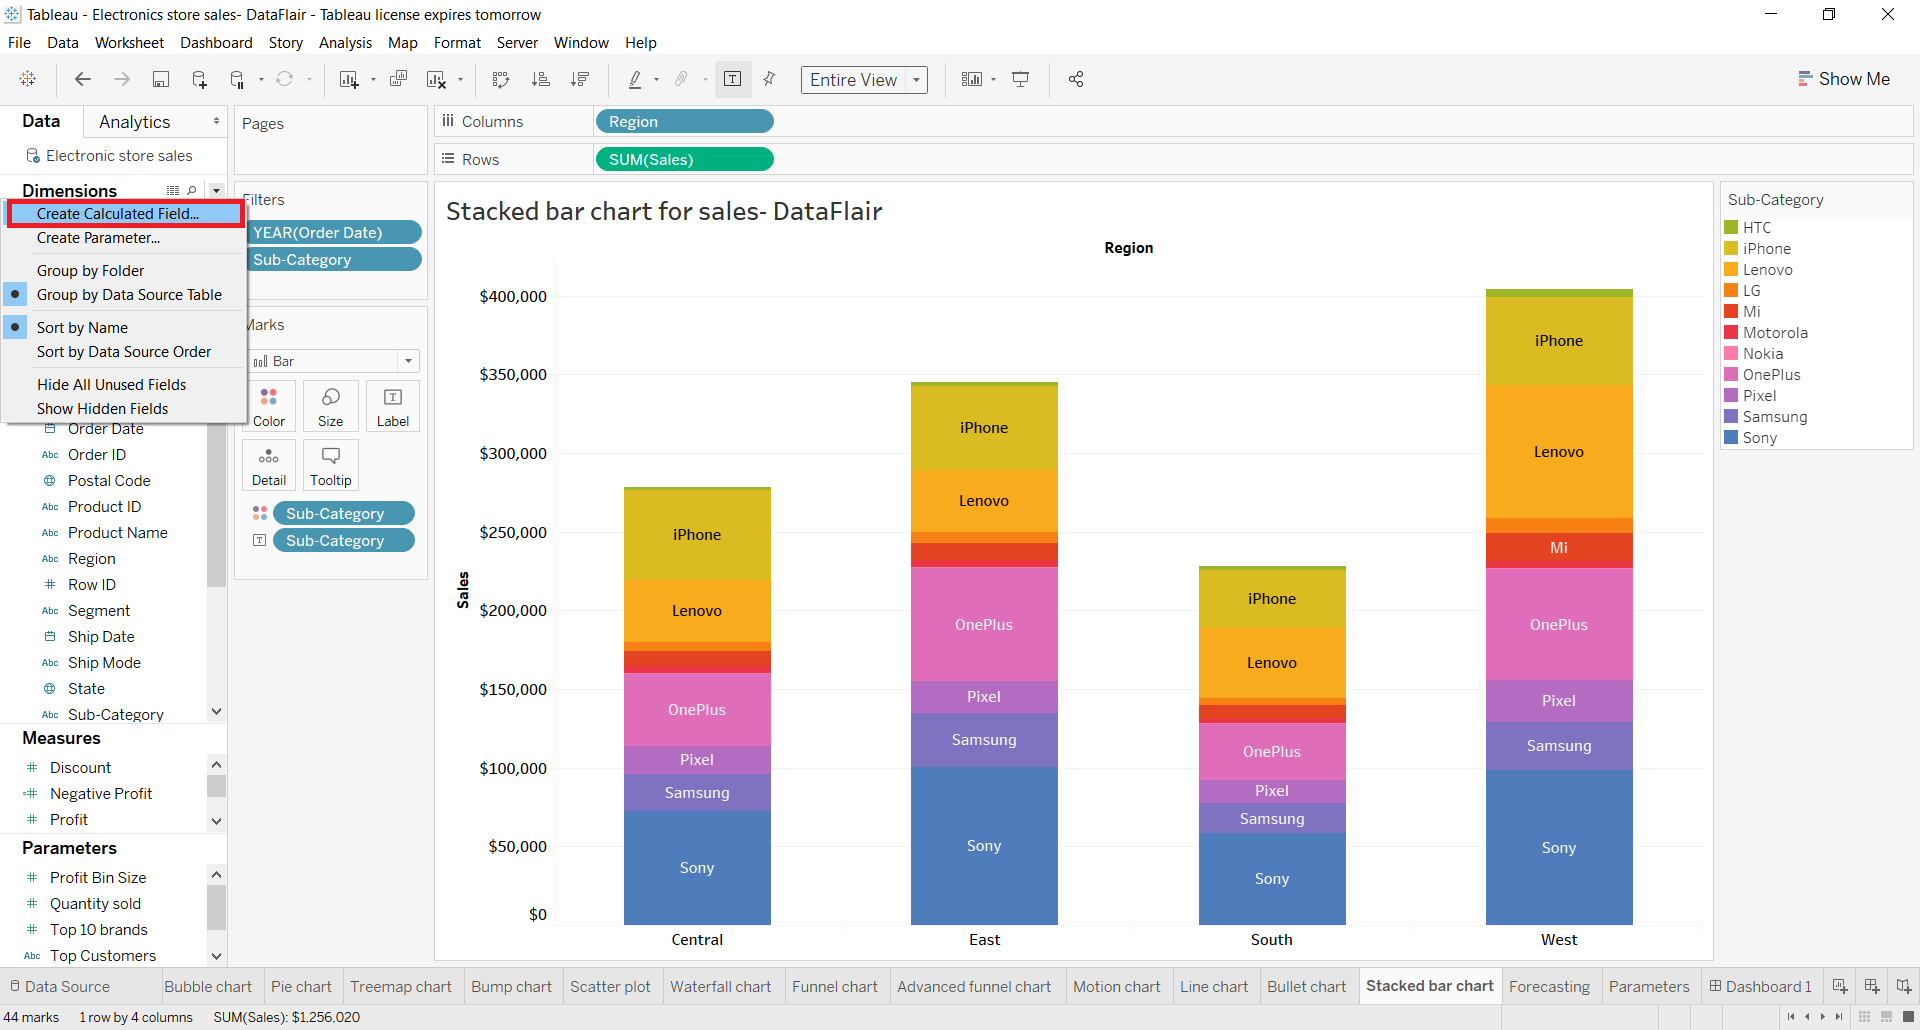
Upon selecting the option, you will find a dialog box that opens from where you can create the LOD expression by entering it in the empty space given. As you can see, we are entering the expression for FIXED type LOD, that is, {FIXED [Category]: SUM ([Sales])}
Click on Apply once you enter the expression and get the message “The calculation is valid” at the bottom.
STEP 3: Using the LOD Expression in Visualization
Now that we have created our calculated field having our LOD expression, the next thing we need to do is, add that field into the tooltip so that the calculated values can be seen as additional information on the chart. To add the fields on the tooltip, drag and drop the fields on the Tooltip card in the Marks section.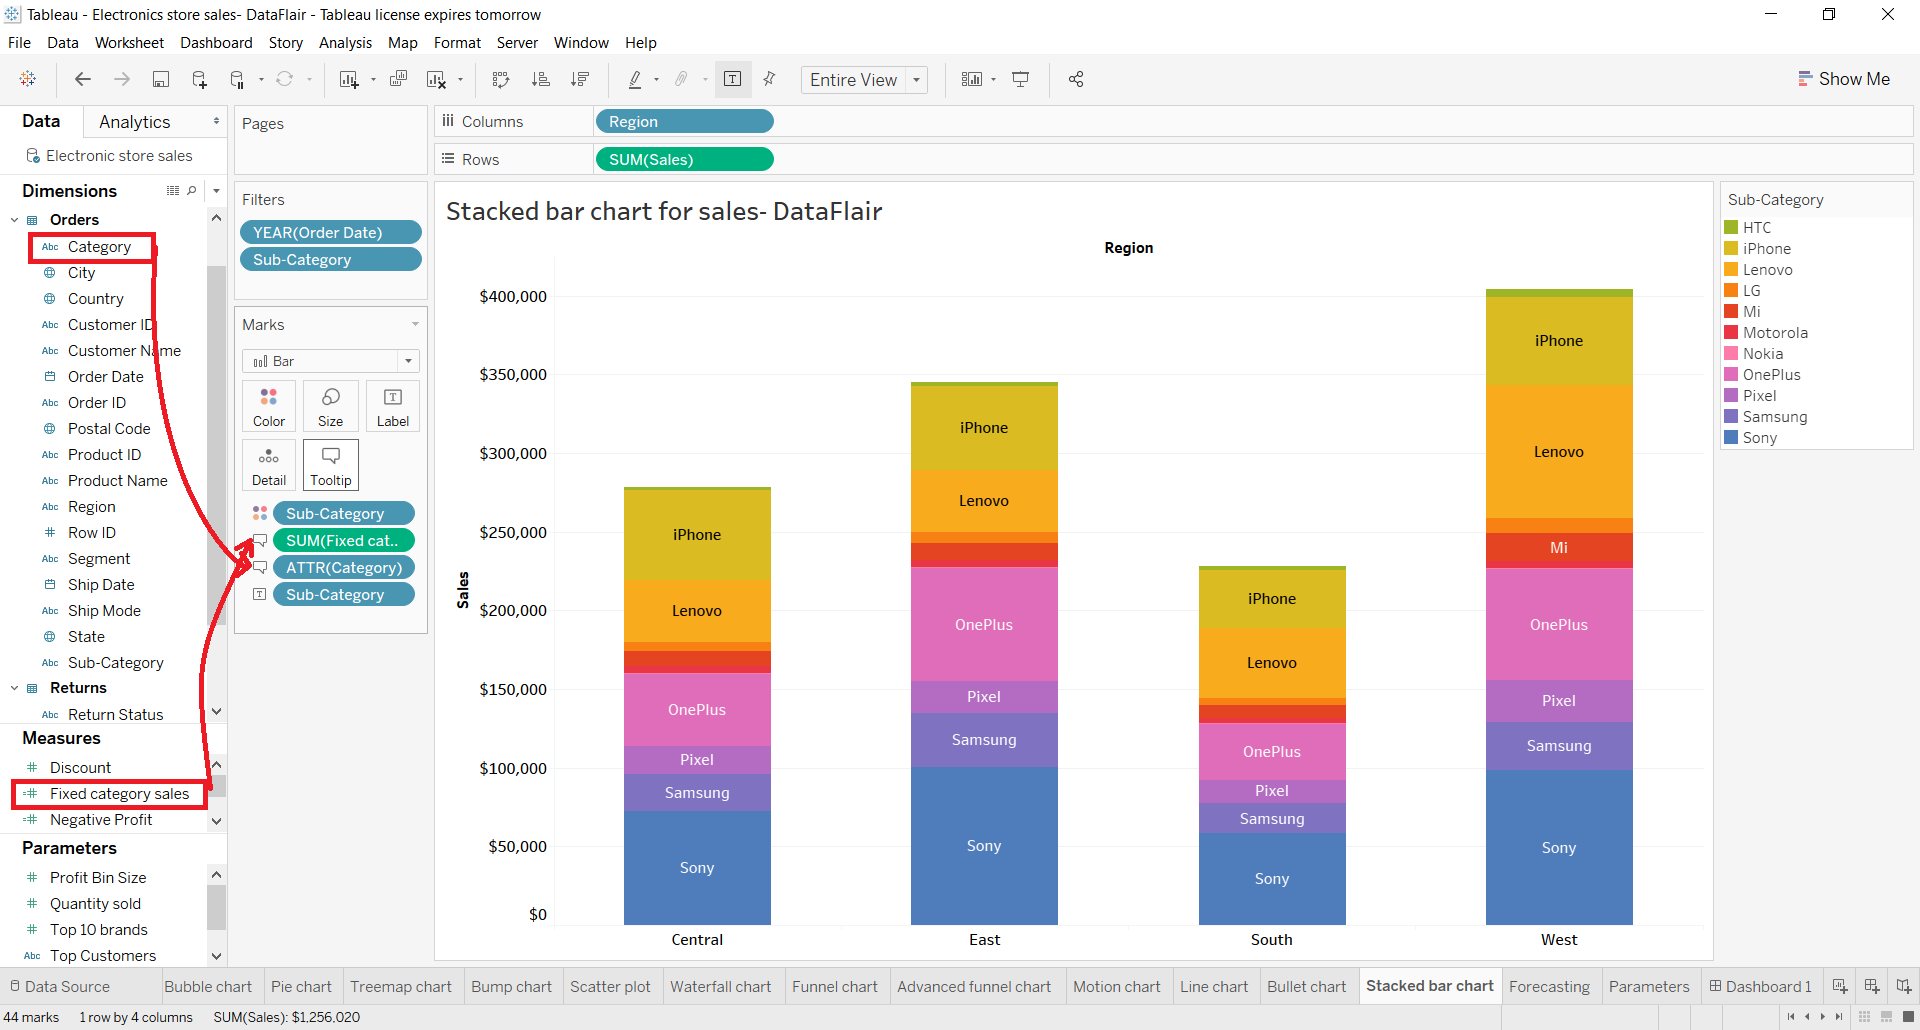
STEP 4: Editing the Tooltip to Show LOD
We can also enter our LOD expression or calculated field from the Edit tooltip option as shown below.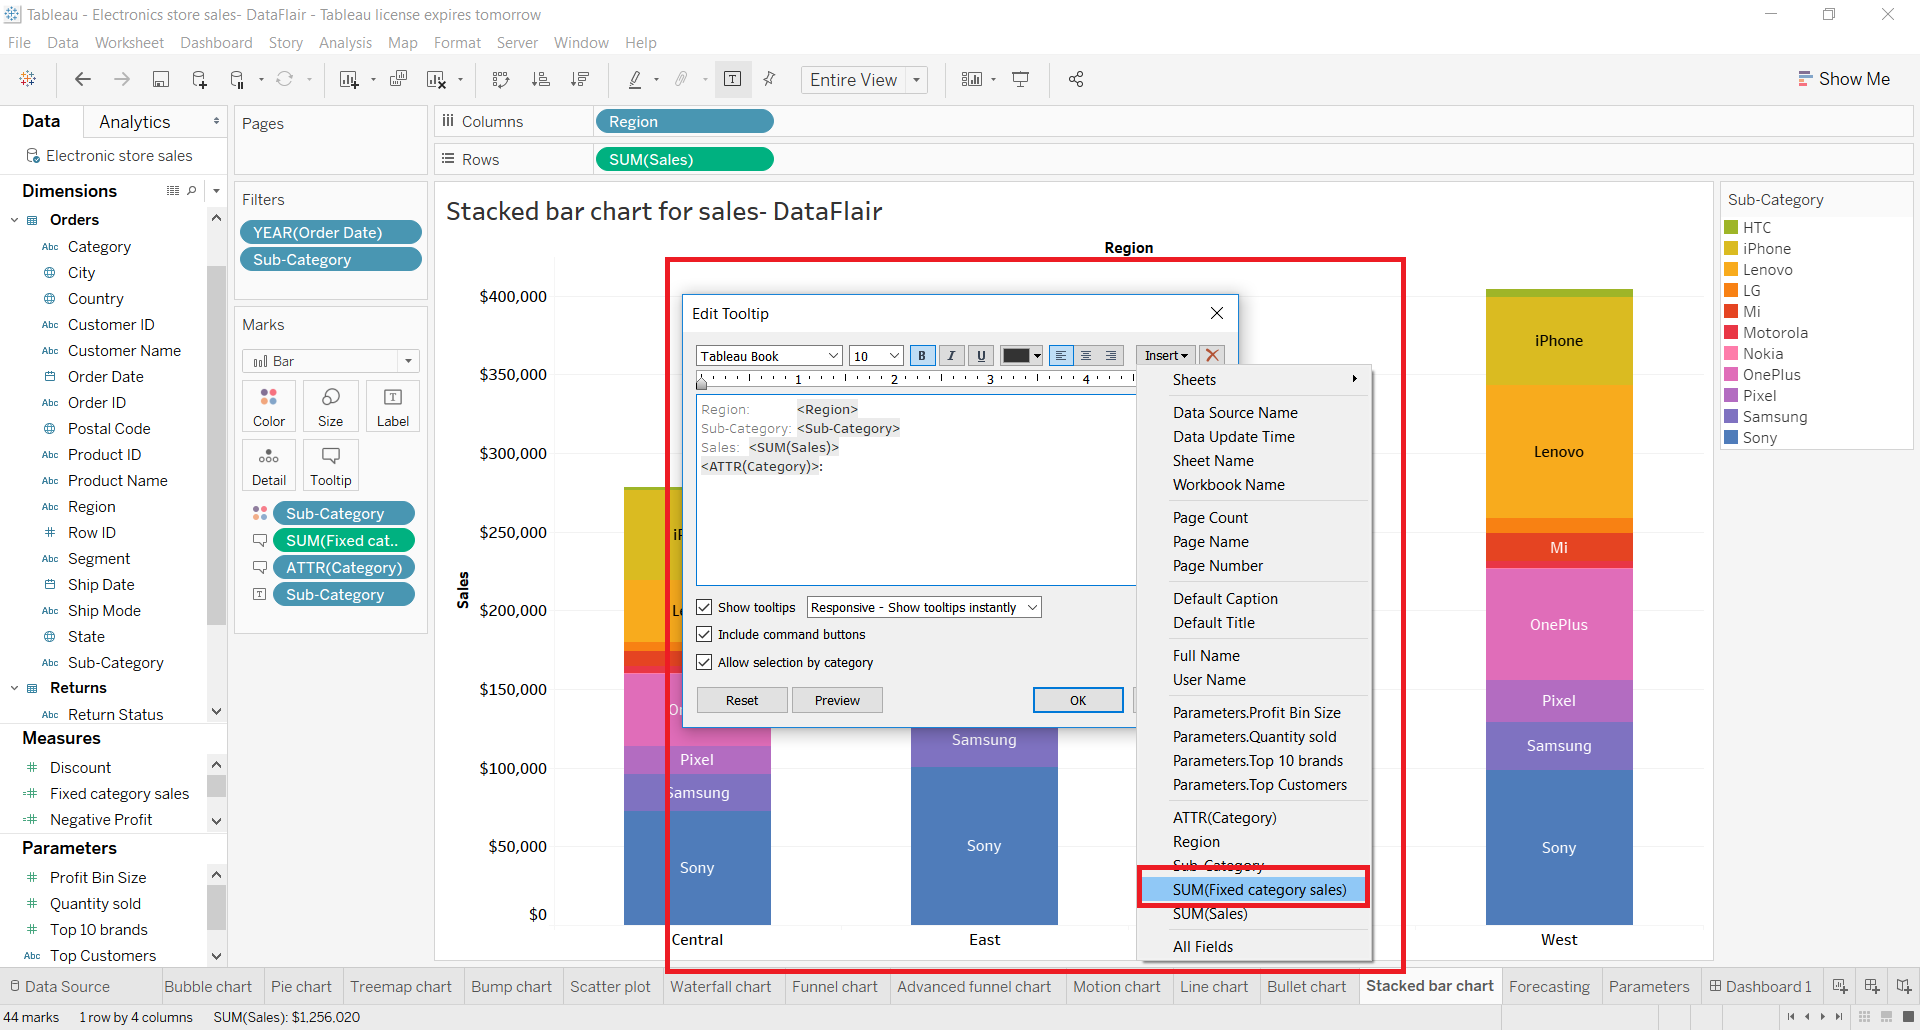
Our FIXED LOD in Tableau field is now finally in use as we can see in the screenshot below. In the stacked bar chart that we see it is showing region-wise sales for each sub-category. These sub-category items such as GoPro, Canon, Lenovo, OnePlus, etc belong to a certain category.
The purpose of our fixed LOD expression is to show total sales for the category corresponding to a sub-category in the tooltip. As the tooltip for the option GoPro shows the sub-category name, its sales value for the East region. And, the total sales value of the category which it belongs to, that is, Camera.
You can see the total sales value for the category of every sub-category item for a particular region in the same way on the tooltip.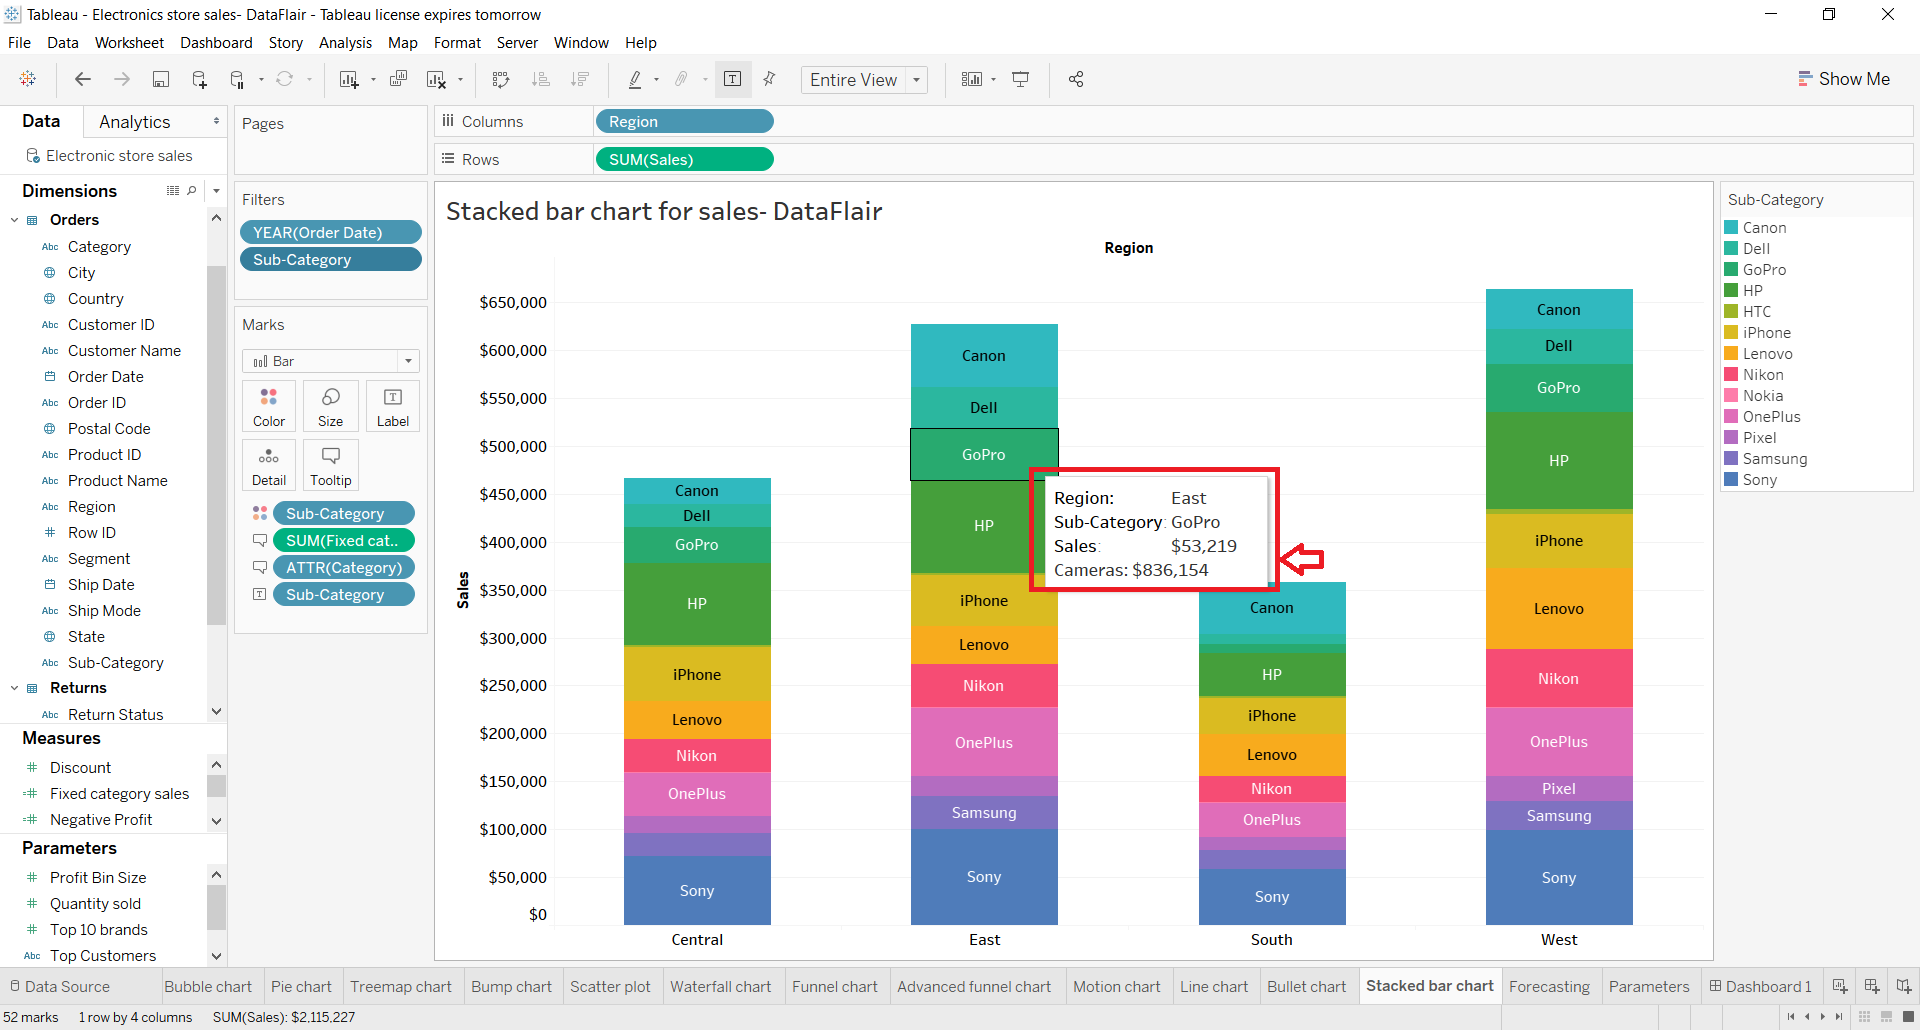
INCLUDE LOD Example
Just as we entered a FIXED LOD expression in the calculated field, we can create an INCLUDE LOD expression field. Suppose we have a dual-axis chart where Region is plotted against average sales and average customer sales. What we can do from the Include LOD option is, we can include the average customer sales into the average of total sales in a single graph.
To do this, we need to create a calculated field with a relevant INCLUDE formula and click on Apply.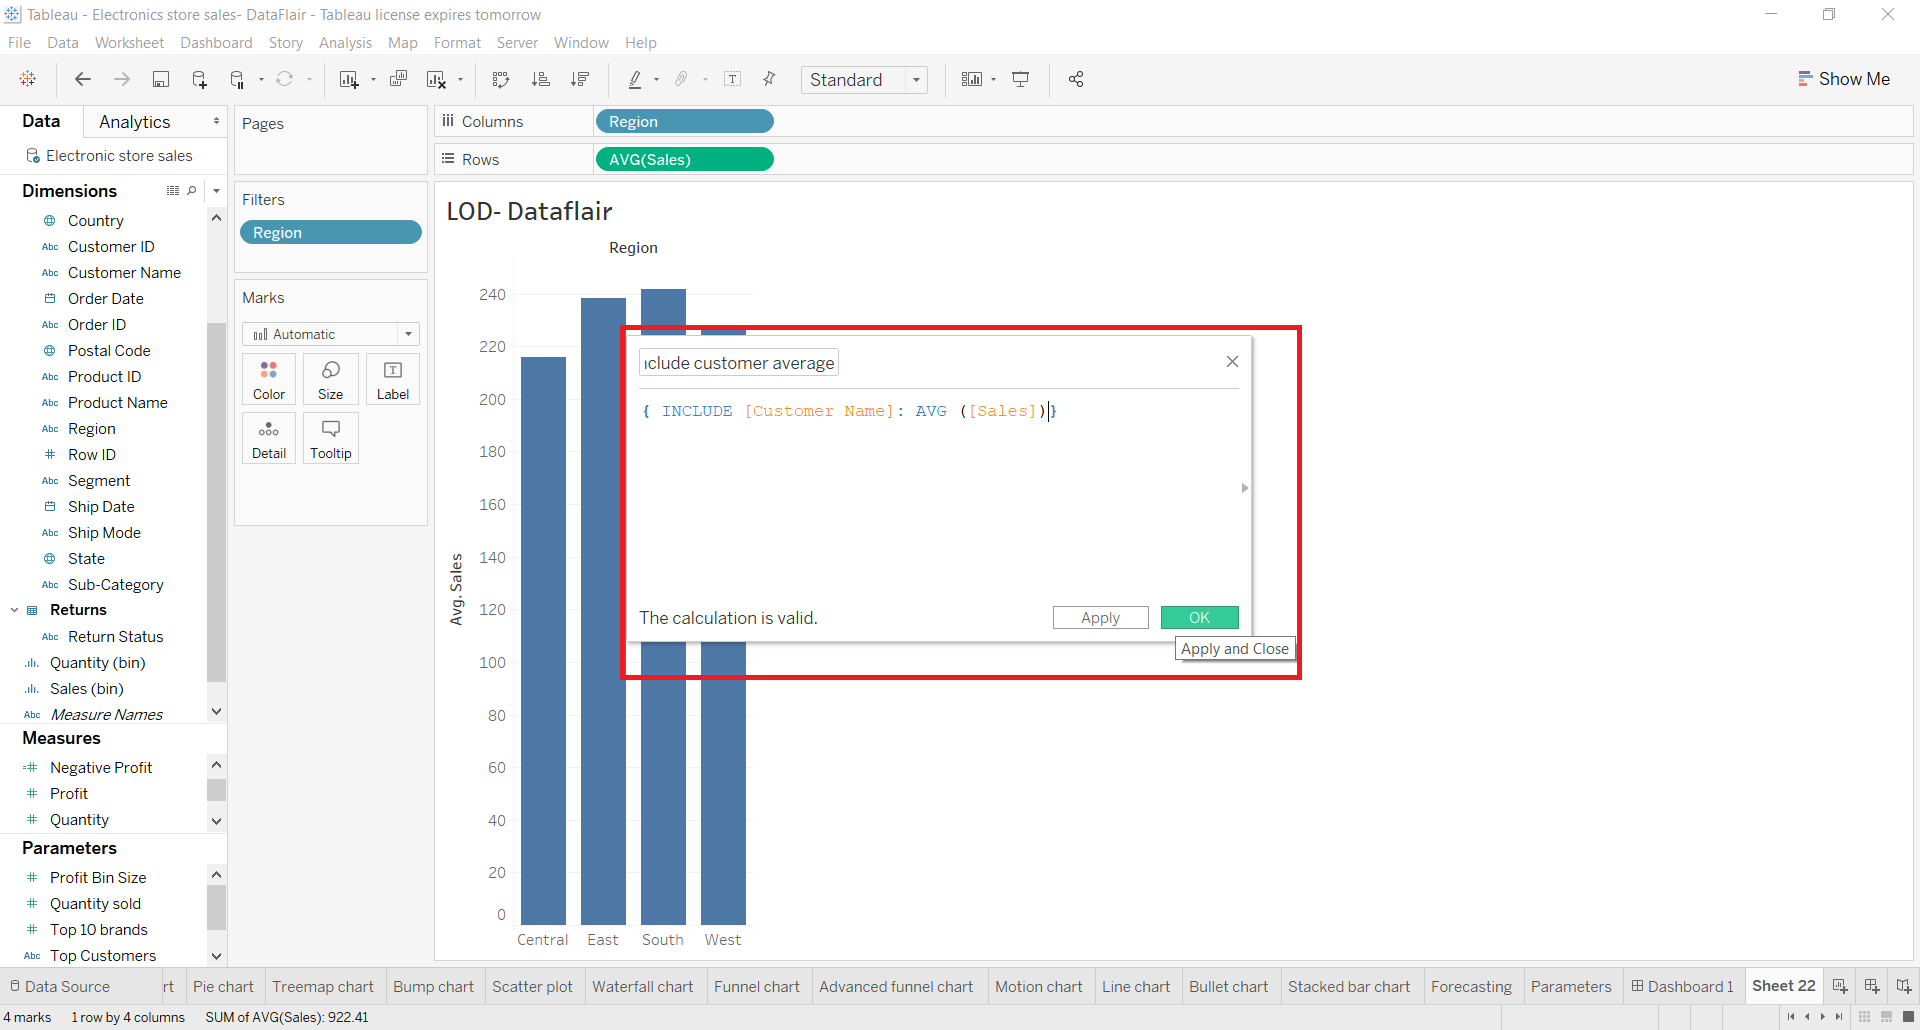
As we can see in the final bar chart below, we have both the values for Average total sales and Customer average value for each region in a single bar graph.
Exclude LOD Example
We can create a calculated field having an EXCLUDE LOD expression. We can use these LOD expressions containing fields directly on the visualization by dragging and dropping them into the Columns or Rows sections.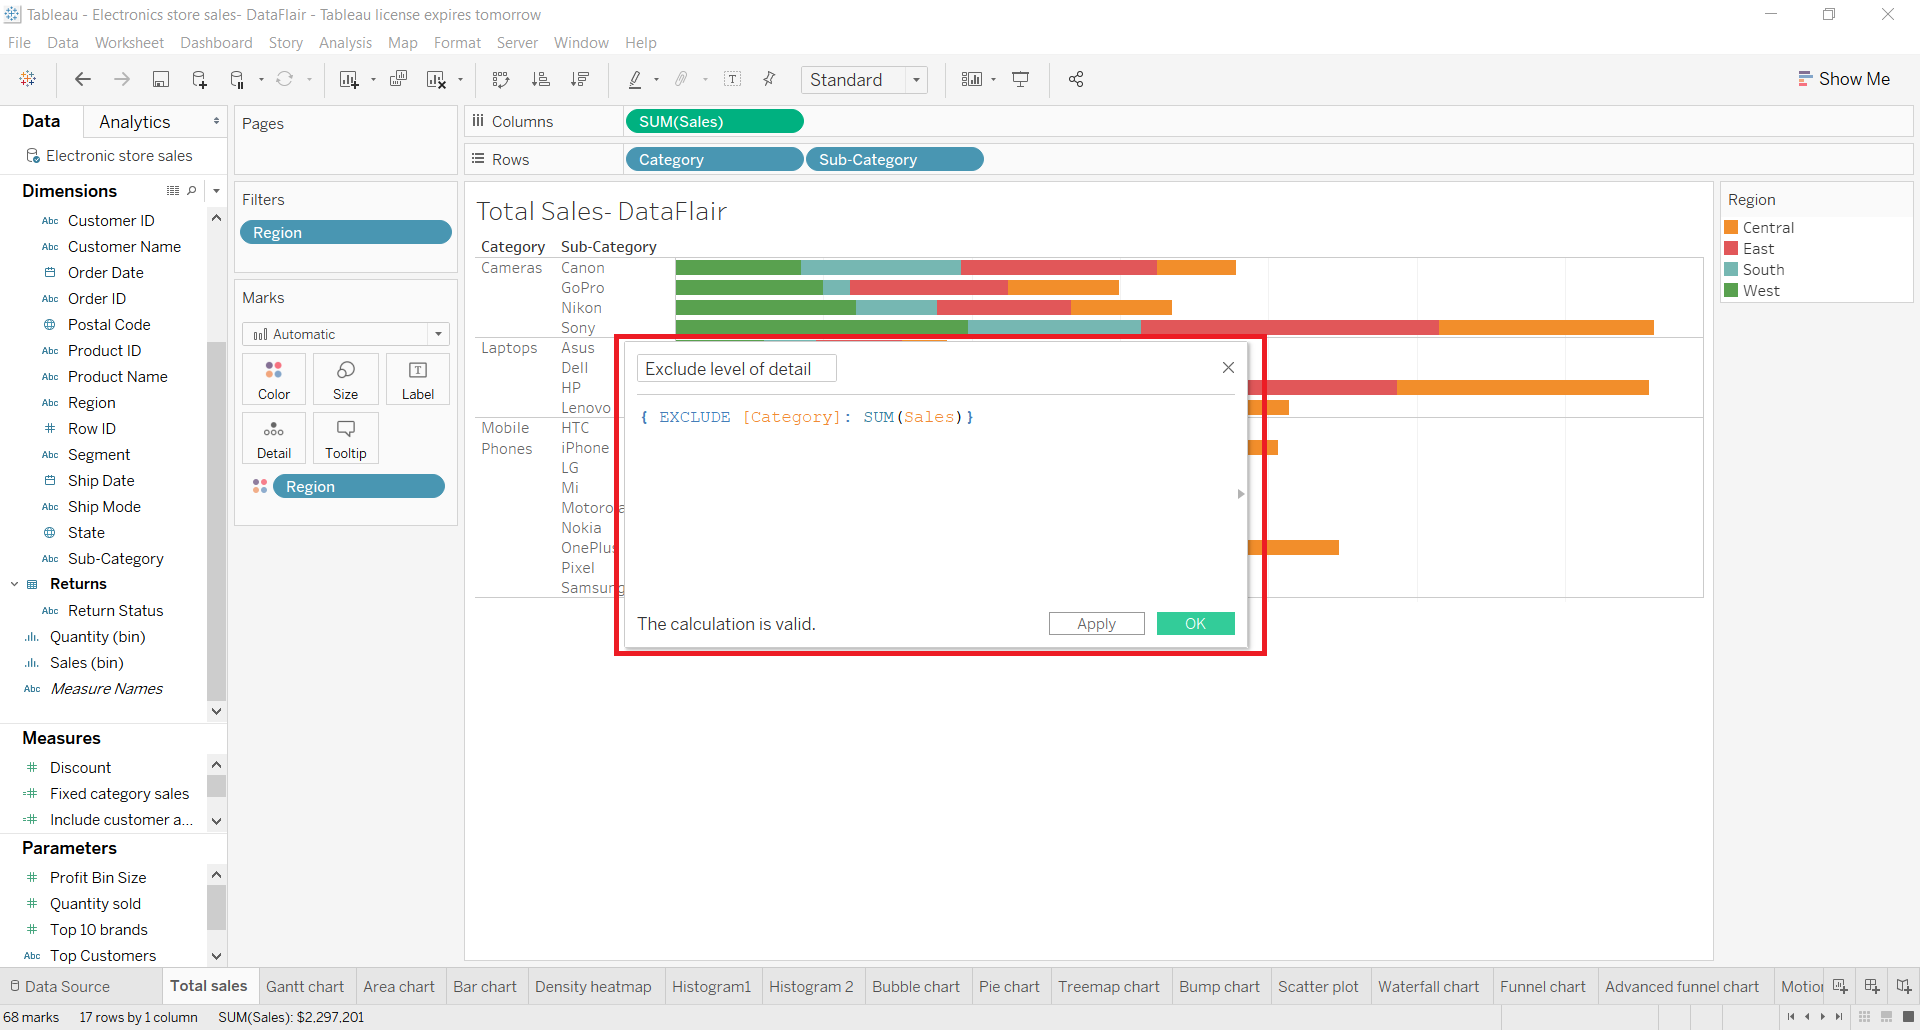
Summary
This concludes our lesson on LOD in Tableau. We hope you learnt everything about LOD now. So now that you know how to create different types of LODs in Tableau. Try it for yourselves and use them for analysis wherever required in your calculations.
Dig in the next DataFlair’s Tableau tutorial – Gantt Chart in Tableau.
If you have any doubts in DataFlair’s LOD in Tableau article, mention in the comment section.
Happy Learning😃
Did you like this article? If Yes, please give DataFlair 5 Stars on Google


