Tableau Population Pyramid – Create Population Pyramid
Expert-led Courses: Transform Your Career – Enroll Now
In this Tableau tutorial, we are going to discuss Tableau Population Pyramid with examples. We will also see how to make Population pyramid in Worksheet. So, let us start the learning.
What is Tableau Population Pyramid?
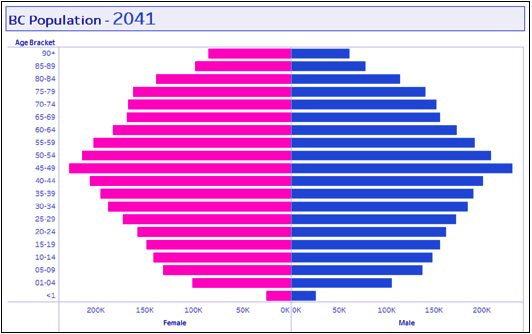
A Tableau population pyramid is a chart that shows population distribution by age and gender. Age is typically distributed using five-year age groups. The youngest groups are located at the base and the oldest groups at the top. This pyramids can indicate how slow or fast the population ages, and can also be used to forecast how the population will change in the future.
Read about Data source in a tableau
How to Make a Population Pyramid in Tableau?
i. From Dimensions, drag Age Bracket to the Rows shelf.
ii. Hover over the Age Bracket column header until you see a sort icon, and click on the sort icon. Click on the sort icon twice to sort the Age Bracket values descending.
Let’s study a full concept of Tableau Show Me Menu- Part I, Tableau Show Me Menu- Part II and Tableau Show Me Menu- Part III
iii. Right-click on Total value for Age Bracket and select Exclude.
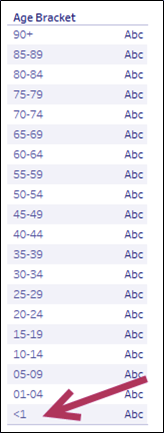
iv. Manually drag the <1 header for Age Bracket so that it is the last value. This should be placed after the value 01-04.
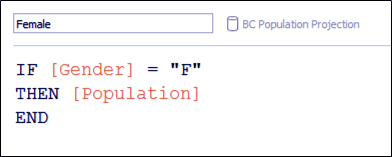
v. Create a calculated field called Female that returns the Population value if the gender is female.
vi. From Measures, drag the newly created Female calculated field to the Columns shelf. This creates a bar chart that represents the female population.
vii. Using the Marks card for Female, click on Color and change the color of the bars to pink. Feel free to change this color to a color of your choice.
Take a tour to Tableau Data Blending and How to do Data Extraction in Tableau
viii. Create a calculated field called Male that returns the Population value if the gender is male. You will need to check the value of Gender and return the population if the value is M. Use the formula for the Female calculated as a reference.
ix. From Measures, drag Male to the Columns shelf, to the right of the Female pill.
x. Using the Marks card for Male, click on Color and change the color of the bars to blue. Feel free to change this color to a color of your choice.
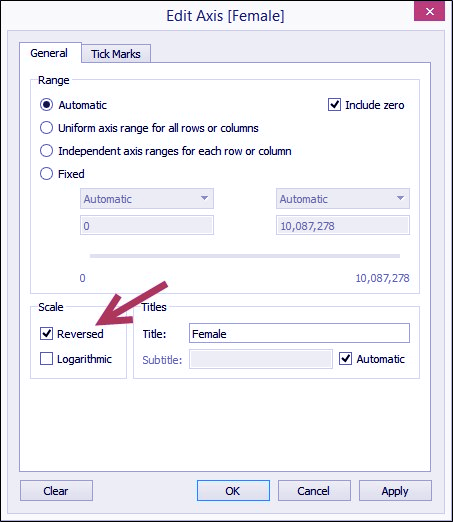
xi. Right-click on the axis for the Female, and select Edit Axis.
xii. Under Scale, select Reversed. Click OK when done.
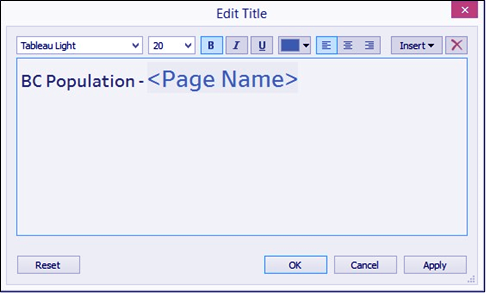
xiii. Double-click on the worksheet title, and using the Insert dropdown, add the Page Name to the worksheet title.
xiv. From Dimensions, drag Year to Pages.
xv. Using the Year play control, click on the forward arrow to play.

So, this was all about Tableau Population Pyramid. Hope you like our explanation.
Conclusion
In this tutorial, we studied What are the population pyramid and various steps involved how to make a Tableau population pyramid. Thus, completing another milestone in our journey of mastering Tableau. Furthermore, if you have any query, feel free to ask in a comment section.
Did we exceed your expectations?
If Yes, share your valuable feedback on Google


You should have a link to the data source