Tableau Reference Band – Creating Time Series Graph in Tableau
Job-ready Online Courses: Click, Learn, Succeed, Start Now!
In this tutorial, we will study about what is Tableau reference band and various steps in creating time series graph using the reference band in Tableau. So, let’s start our session.
Tableau Reference Band
Tableau reference band creates a banded or shaded area in a chart and can show if other points fall within a RA in Tableau, we can drag Reference Band from the Analytics pane and drop it onto our view.
If we have different groups in the view, we will be presented with the scope options Tableau, Pane, and Cell. If there is more than one axis, we also have the option of creating the band on one of the axes or both.
Let’s Discuss How to Add Them Constant Line in Tableau
With a reference band, we need to supply the range – the Band From and the Band To value. Before we can select this in the Edit Reference Line, Band, or Box window, we need to make sure the fields for the boundary values are already in the view. If it is not yet there, and it does not need to be placed in a way that affects the overall view, we can place these fields in the Details property in the Marks card.nge or interest or not.
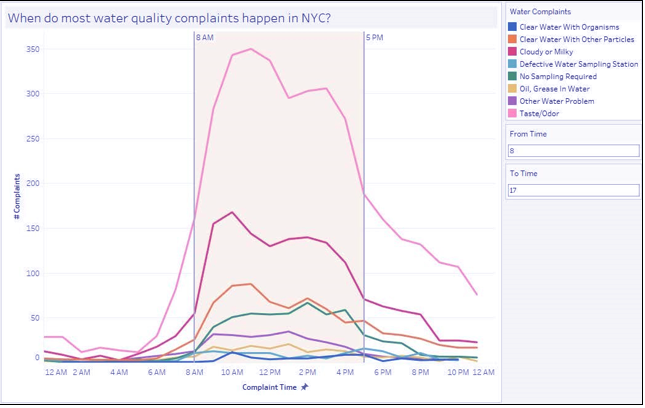
Create Time Series Graph with Reference Band in Tableau
Following steps guide us to create Tableau Time series Graph:
Do You How to Create a Story Line in Tableau
i. From Dimensions, right-click and drag Created Date DT to Columns and select Discrete Hour:
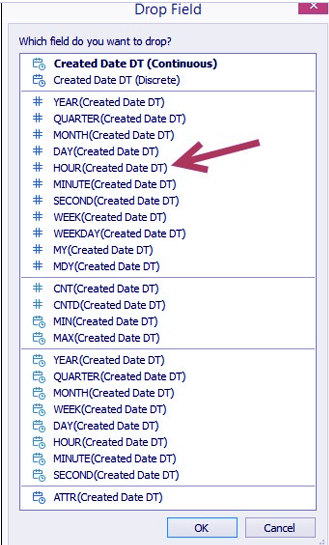
Step-1 Creating Tableau Time Series Graph
ii. Right-click on the HOUR(Created Date DT) field in Columns and select Continuous.
iii. Right-click on the HOUR(Created Date DT) field in Columns, and select Format. On the sidebar, under Scale, choose 12-Hour format for Dates:
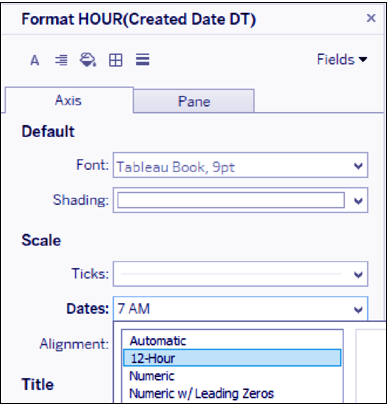
Step-3 Creating Tableau Time Series Graph
iv. Right-click on the Created Date DT axis to edit axis. Change the axis title to # Complaints.
Read about Tableau Trend Line in detail
v. From Measures, drag Number of Records to Rows.
vi. Edit the Number of Records axis and change the axis title to Complaint Time.
vii. From Dimensions, drag Descriptor (group) to Color in the Marks card.
viii. On the sidebar, click on the Analytics tab to activate it.
ix. Under Custom, drag Reference Band from the Analytics tab and drop it onto Table in the HOUR(Created Date DT) placeholder:
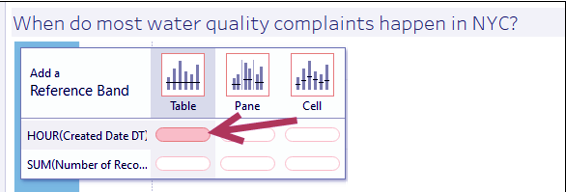
Step-9 Creating Tableau Time Series Graph
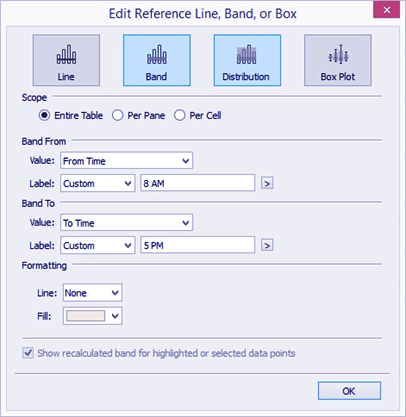
x. In the Edit Reference Line, Band, or Box window, use the following settings:
- Scope is Entire Table
- Tableau Reference Band From Value is From Time
- Reference Band From Label is Custom, and type in 8 AM
- Band To Value is To Time
- Band To Label is Custom, and type in 5 PM:
xi. Click OK when done.
Let’s Explore Tableau URL Action – How to Create URL Action
xii. Right-click on the Reference Band and select Format.
xiii. Set the Alignment for the Reference Line Label to top.
Conclusion
Hence, in this tutorial, we studied what is reference band in Tableau and how to create the time series graph with Tableau Reference Band. Furthermore, if you have any query feel free to ask in a comment section.
We work very hard to provide you quality material
Could you take 15 seconds and share your happy experience on Google


