Business Intelligence Tutorial – Learn Latest BI Features & Applications
Expert-led Online Courses: Elevate Your Skills, Get ready for Future - Enroll Now!
Today, we are exploring the term Business Intelligence or BI which is becoming popular with each passing year. It is important for the management and employment of data.
So, in this Business Intelligence Tutorial, we will explore the history, versions, features, and functions of BI. Moreover, we will cover the applications and the advantages & disadvantages of Business Intelligence.
So, let’s start a Business Intelligence tutorial.
What is BI?
Since the advent of technology, man has been doing technological wonders. One such technology is data science which surfaced during mid-1900sand has been spreading its roots since then.
With increased data load emerged the need of organizing, storing and drawing useful insights from it in order to enhance business value. Which introduced concepts of Business Intelligence in the picture.
The term Business Intelligence refers collectively to the tools and techniques used for the collection, integration, analysis and visualization of raw data.
The raw data collected and processed through the Business Intelligence processes is then transformed into comprehensible data or meaningful information.
This information is then interpreted strategically by looking for trends and patterns in order to make business decision supported by facts.
To simplify the concept, raw data is collected from various sources and with the help of Business Intelligence tools and is transformed into meaningful information, stored in data warehouses in predefined manners.
From the data warehouses, we can retrieve stored data in the form of a report, query or conduct an analysis. This can also be explained using ETL (Extract, Transform, Load concept).
It helps in analyzing business trends from past and help in taking lucrative business steps in future. BI is a dynamic approach, that means it’s output changes and evolves with time and trends in business.
Business Intelligence Examples
Let’s understand it better with an example of a retail store, say ‘Westside Store’ selling products of various brands both in-store and online. All the customers are offered a loyalty card which has a unique ID.
These cards are used while shopping from Westside stores or Westside’s online portal. All your purchase details associated with your unique account ID are stored into the Westside’s database.
Now, the manager of Westside will use BI methods and software to run analytical reports on huge amounts of customer information to identify consumer trends like their favorite brand, do they prefer in-store shopping or online shopping? What price range is the most affordable? and during which months or seasons of the year, they shop the most.
Thus, giving the organization valuable information like customer preferences, needs, and habits.
Using which the organization could anticipate new opportunities, deliver better service and come up with new marketing campaigns like releasing offer coupons, launching a sale etc., serving the ultimate goal of growth of the business.
BI History
The concept or the term ‘business intelligence’ was first mentioned in the mid-1800s in a work published by Richard Miller Devens.
He observed this in the way of working of a banker named Henry Furnese who simply used to gather important business information to come up with effective business strategies.
This concept however lingered on and got adopted by the world of computer technology.
With the increase in amounts of data and thus in the storage capacity of devices, emerged the need for good database management tools and techniques.
- By the 1960s came a DBMS called Decisions Support Systems (DSS) which was a collection of software. However, the software coming at this time did conduct all BI functionalities but just a few like data accumulation and organization. One major problem faced was difficulty and complexity in the usage of this service.
- Later, in 1988, after a Multiple Data Analysis consortium in Rome, the picture of BI changed. There came tools with simpler functioning.
- In 1989 and early 1990s there were various such software in use like Executive Information System (EIS), Online Analytical Processes (OLAP) and the term Business Intelligence (term used by Howard Dresner of Gartner Group) started getting used as a general term encompassing all such methods and applications.
BI Versions
With modifications happening in the technologies of business intelligence, there are two versions or phases of it. Which we will discuss in brief here:-
a. Business Intelligence 1.0
With the evolving technologies under Business Intelligence during the late 1990s and 2000s, the BI software also became abundant. The main functions provided were data collection, analysis, and visualization.
However, some problems face like limited employees having the technical expertise to operate the software.
The software could not use by a non-technical person because the data collected was complex and performing operations on it were time-consuming. This problem was later acknowledged and certain changes in software came, hoping it to make it more user-friendly.
b. Business Intelligence 2.0
This version brought with it new Business Intelligence techniques. Addressing the issue, the software was made so that any non-technical employee could work with Business Intelligence tools without relying on IT professionals.
Along with much-required changes, many new features were added. There came cloud supported programs, real-time data access and processing. These gave companies insight into the most recent data and helped them maintain a spot in the highly competitive market.
Features of Business Intelligence
Here, we will explore the benefits of BI, let’s discuss them one by one:
- Self-service Reporting
- Dashboard
- Interactive Reporting
- Data Visualization
- Data Warehouses
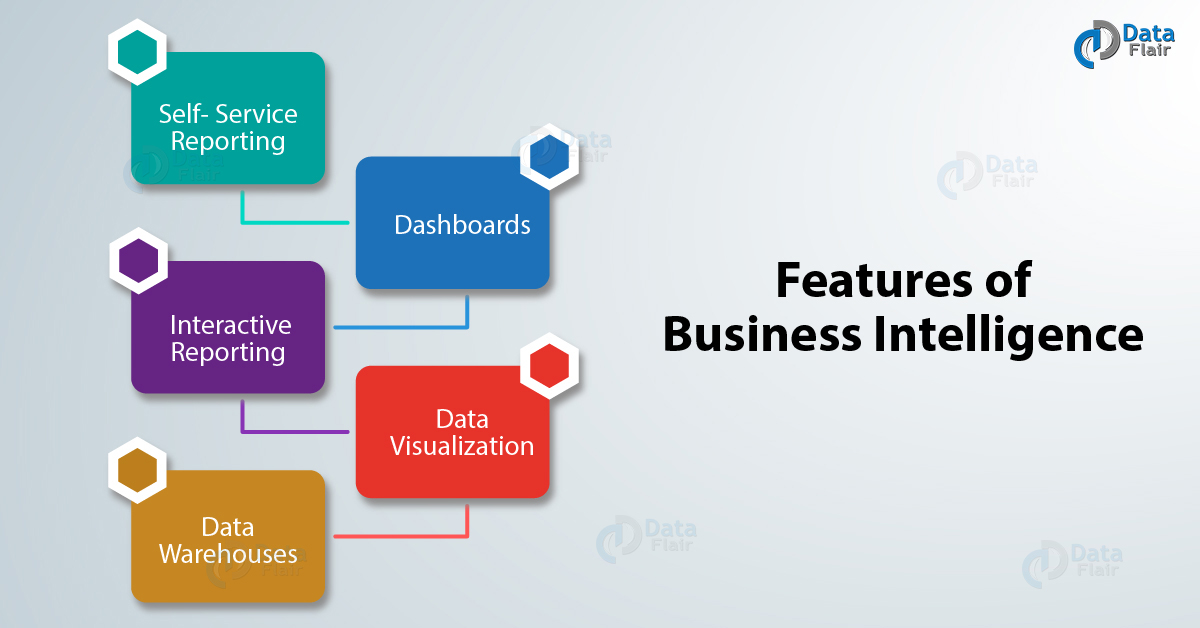
Features of Business Intelligence
a. Self- Service Reporting
As we already know the problem faced in earlier versions of BI was that it needed professionals or technical IT experts to prepare data reports.
Now, with the introduction of ‘Self- service reporting’, a non-technical employee can also easily generate reports using the latest BI tools. Users only have to interact with the Meta-data layer while analyzing or creating reports.
b. Dashboards
The BI software provides the user with a personal executive dashboard (CEO Dashboard). On this dashboard, a user can view all the statistical analysis of the company.
Through this dashboard, an executive can monitor KPIs, future events and get regular data summary. This helps in the smooth and efficient functioning of the enterprise.
c. Interactive Reporting
The reporting offered by Business Intelligence tools is interactive, which means that it presented in such a way that users can easily draw inferences from it.
It also allows flexibility in many ways, like you can get data reports based on the geographical terrains, analyze data in dynamic or changing conditions, set alerts and data limits which tells you any data exceptions.
d. Data Visualization
This feature holds a very important place in the BI concept because it allows enterprises to customize their own apps and displays data analytics reports in a very easy to understand manner.
e. Data Warehouses
As discussed earlier in the tutorial, we know that all the collect and integrate raw data is stored in cubes in data warehouse.
It stores all the dispersed data coming from different sources in one central location. The data here standardize using ETL process so that upon a query request it could systematically search through data.
Business Intelligence Tutorial – Functions
The functions or services provided by Business Intelligences comes mainly under three categories:
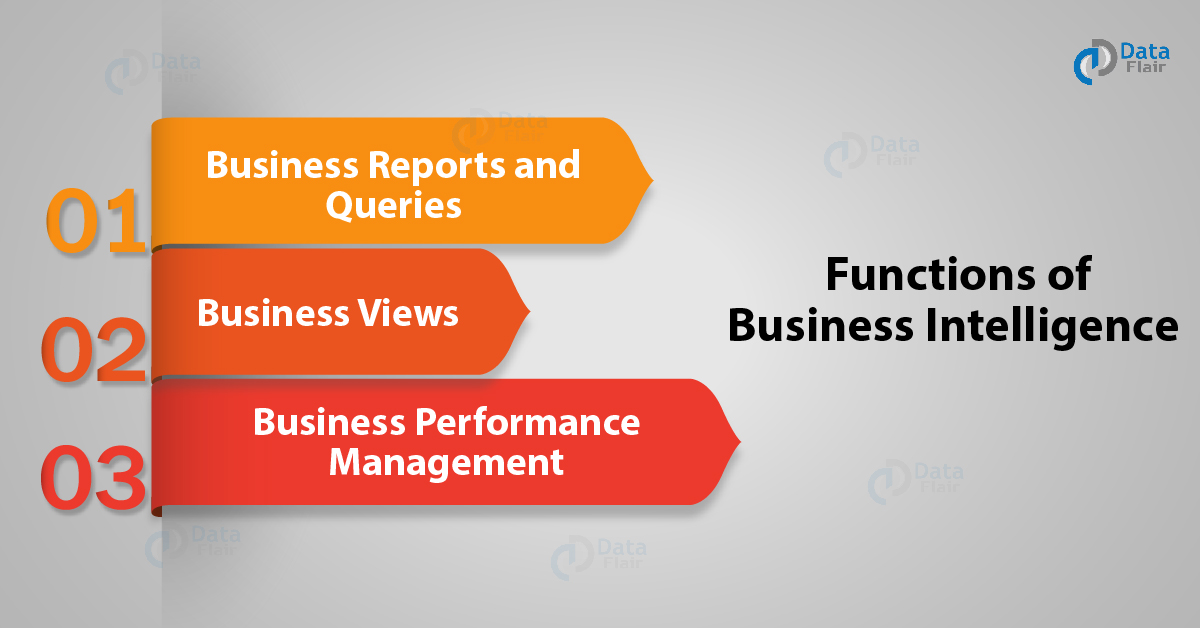
a. Business Views
All the raw data collect and transform into meaningful information then analyze using BI technical approaches. The data results view in from three-time frames, the past views, current views and future or predictive views.
b. Business Performance Management
This function operates around the concept of Key Performance Indicators (KPIs), which as the name suggests reveals the health and stability of the enterprise. KPIs are basically ratios of different business entities like death to equity etc. The monitoring and analysis of KPIs done with the help of BI software.
c. Business Reports and Queries
After receiving the analyzed data, reports generate and share using specific BI tools. The software also supports batch reporting. A user can view ready-made reports and send queries to retrieved collected and organized data stored in data warehouses.
Technical Approaches
In order to provide all three functionalities, the framework of Business Intelligence requires the help of certain technical approaches. Without these, the functionalities can’t be provided. Let us understand them one by one:-
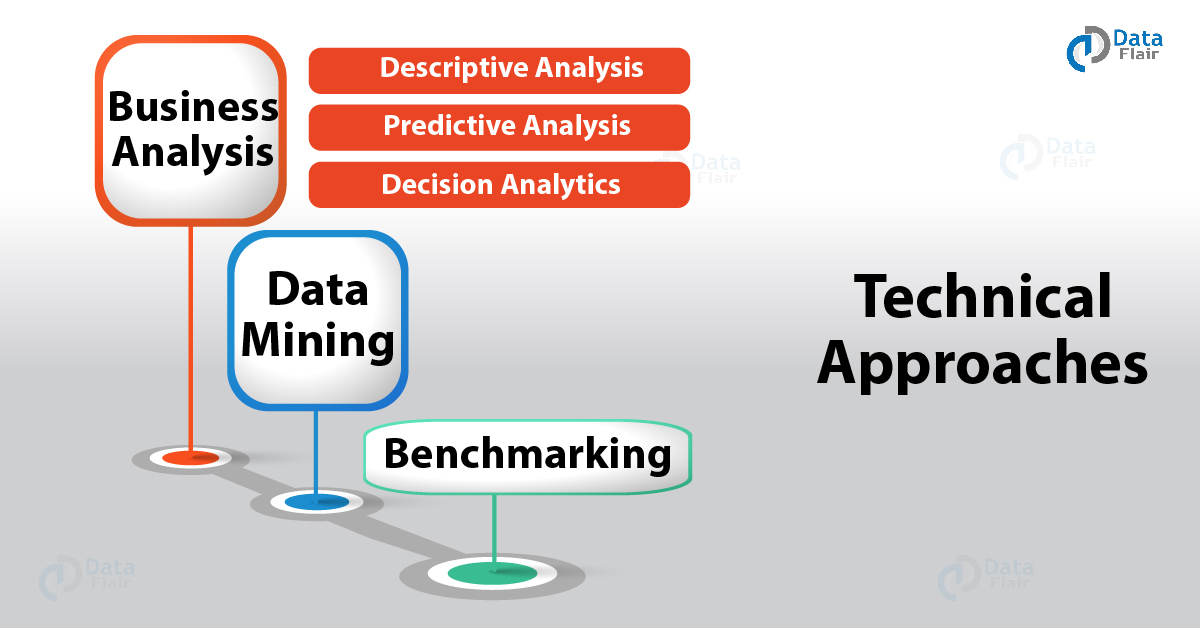
a. Benchmarking
This is a process of comparing and analyzing one’s own data or business trends and stability from that some of the tops in the industry.
b. Data Mining
Data Mining is an analysis of massive sets of data from the past in order to find patterns and correlations. It serves as the backbone of the entire framework of BI.
Text analysis or mining also perform in a similar way. In this case, what the analyst looks for is the tone or public sentiment on social media platforms.
c. Business Analysis
Business data analysis is the most important technical approach. It can be classified into three types, namely, Descriptive, Predictive and Decision Analytics.
There are several advantages to Business Analysis. It helps in predicting future business trends, detect problems in the current functioning of business and give a competitive edge to the enterprise.
Now, let us go through the three analytics types in brief-
- The Descriptive Analysis provides the basis for all further analysis as it gives a detailed description of the data analyzed. Using this information we can further analytical concepts like predictive and decisive.
- Predictive Analysis uses detailed information on current data trends and predicts future possibilities and trends. In such an analysis the software is designed so that it searches for patterns and correlations between vastly spread data. It then offers the most likely trends based on past and current data.
- Decision Analytics uses an enterprise’s internal data and compares it with the outside conditions. It then offers the suggestion of what steps the enterprise could take in the immediate future.
Applications of Business Intelligence
Any business domain or sector in which data utilizes an application of BI. Several examples are-
- IT sector
- Marketing and finance
- Retail and e-commerce
- Tourism and Hospitality
- Manufacturing
- Education
Advantages and Limitations of BI
These are pros and cons of business intelligence:
a. Advantages of Business Intelligence
- Efficient use of data.
- Fast analysis of data.
- Deeper insights into the business.
- User- friendly.
- Accurate analysis, reporting and fact-based decision making.
- Increased business profitability.
- Reliable future predictions in business trends.
- Increased flexibility in business.
b. Limitations of Business Intelligence
- Business Intelligence tools can only use to integrate and analyze structured data, which in reality is only 10-20% of the entire data. The rest of the data is unstructured like the data from social media platforms etc does not come under the accessibility of BI technology.
- The sole emphasis for future prediction and decision making is laid on data. This is not always accurate because it ignores many other factors and just focuses on what data is suggesting. This often creates a problem when the enterprise needs to take complex decisions.
- Cost and complexity of Business Intelligence often come across as a limitation.
Top Business Intelligence Tools
These are popular BI Tools
- Power BI
- SAP Business Intelligence
- SAP HANA
- Microstrategy
- Sisense
- Tableau
- SAS Business Intelligence
- Dundas BI
- TIBCO Spotfire
- QlikSense
So, this was all about BI Tutorial. Hope you like our explanation.
Summary for BI Tutorial
Hence, we studied a comprehensive account of Business Intelligence. With the advancing technology, more and more companies are buying in for BI services.
Business Intelligence tools no longer an accessory tool but has become a necessity for a proper functioning of businesses.
It also caters to many career opportunities like BI Analyst, BI Project Manager, BI Administrator and consultant, BI software developer etc. Hence it proves to be a promising field.
Hope this BI Tutorial, helps you to understand it better. Share your feedback with us!
Did we exceed your expectations?
If Yes, share your valuable feedback on Google


A very informative blog that not only explains the concept of Business Intelligence but also connects it with real-world applications. The emphasis on self-service reporting and data visualization shows how BI tools have become more accessible for decision-makers across different levels of an organization.
Your encouragement and ideas are key to helping me create more impactful.