Tableau Tutorial For Beginners – Learn What is Tableau Data Visualization
Job-ready Online Courses: Click for Success - Start Now!
In this Tableau tutorial for beginners, we will learn about Tableau basics: what is Tableau and its history. A tableau, a tool used for complex visualization and simplification of complex data. It was designed to help the user to create visuals and graphics without the help of any programmer or any prior knowledge of programming.
Furthermore, we will see the Advantages and Disadvantages of Tableau. So, to understand why Tableau is needed, we should learn what is Tableau data visualization. At last, we discuss different products by Tableau Software, to understand Tableau.
So, let us start with our first Tableau Tutorial.
What is Tableau?
A tableau, a tool use for complex visualization and simplification of complex data. It was designed to help the user to create visuals and graphics without the help of any programmer or any prior knowledge of programming.
Tableau was designed with the aim to get a business software that was amazingly responsive and easy. It is an intelligent platform by which business is made to move faster and easy to comprehend by clients and consumers. It is a highly scalable easily deployable and efficient business framework.
Do you know the Features of Tableau?
History of Tableau
Tableau software was developed by an American software company which is situated in Seattle, WA, USA. Professor Pat Hanrahan and Ph.D. student Chris Stolte who specialized in visualization techniques created the software in the department of computer science with the aim to explore and analyze relational database and datacubes. They led research in which they studied and analyzed the use of table-based displays to browse multi-dimensional relational databases.
These founders basically combined the structured query language (SQL) with graphics and invented a database visualization language called VizQL, i.e. Visual Query Language. VizQL is responsible for the basic foundation of the Polaris system, Polaris is an interface for exploring large interface data.
In 2003, Chris Stolte, appointed his former business partner and friend, Christian Chabot as the CEO for Tableau. Tableau was taken out anonymously.
Tableau converts relational databases, cubes, cloud database, and spreadsheets to dashboards and shares over the internet. Revenue collection of Tableau in 2010 was reported to be $34.2 million dollars, it grew to $64 million dollars in the year 2011.
Different Products by Tableau
In this Tableau Tutorial, we will study three products of Tableau.

Tableau Tutorial – Different Products by Tableau
a. Tableau Server
It is a business intelligence application that provides analysis based on a browser which anyone can use. It is an alternative which anyone prefers, because of its fast pace as compared to the traditional business software. No scripting is required for Tableau, this makes it very user-friendly, and one can become a business analyst, grow deployment or even train for free.
b. Tableau Online
Tableau is a hosted version of Tableau server, it makes the analysis for business super fast. It provides the user to share dashboards on multiple platforms in minutes. It provides the user and the company to share views live, and it also provides a secure and hosted environment. There is also no need to buy, set up or manage any architecture, it can scale up as much as you want.
c. Tableau Public
Tableau public was designed basically for anyone who wanted to share and tell stories or data with interactive graphics on the web, it runs overnight, with it you can create and publish data without the help of any programmers of IT.
The premium version is for organizations that want to scale up their websites and keep the underlying data hidden.
Why Tableau?
Let us now study various reasons to learn Tableau. It is very easy to use as you don’t need to know any sort of programming the only requirement with tableau is to have some kind of data to create reports that are enchanting. It’s drag and drop feature is revolutionary. It helps you to create a story or reports by using your imagination and a mouse. As tableau has VizQL all these features are possible in tableau.
Tableau data engine is a revolutionary breakthrough in-memory analytics, which was designed to overcome the limitations of existing databases and data silos. The tableau is capable to run on ordinary computers, it puts data into the hand of everyone no fix data model requires and there is no requirement for any fix data module.
Have a look at – Tableau Applications
The other analytic software that is available in the market guarantee a lot of fancy features, but fails as soon as it comes to memory, when the user needs to deal with a large amount of data, tableau here comes as a saviour and is capable and deliver efficient results even with a large amount of data.
Advantages of Tableau
This part of the Tableau Tutorial covers the following Tableau benefits:
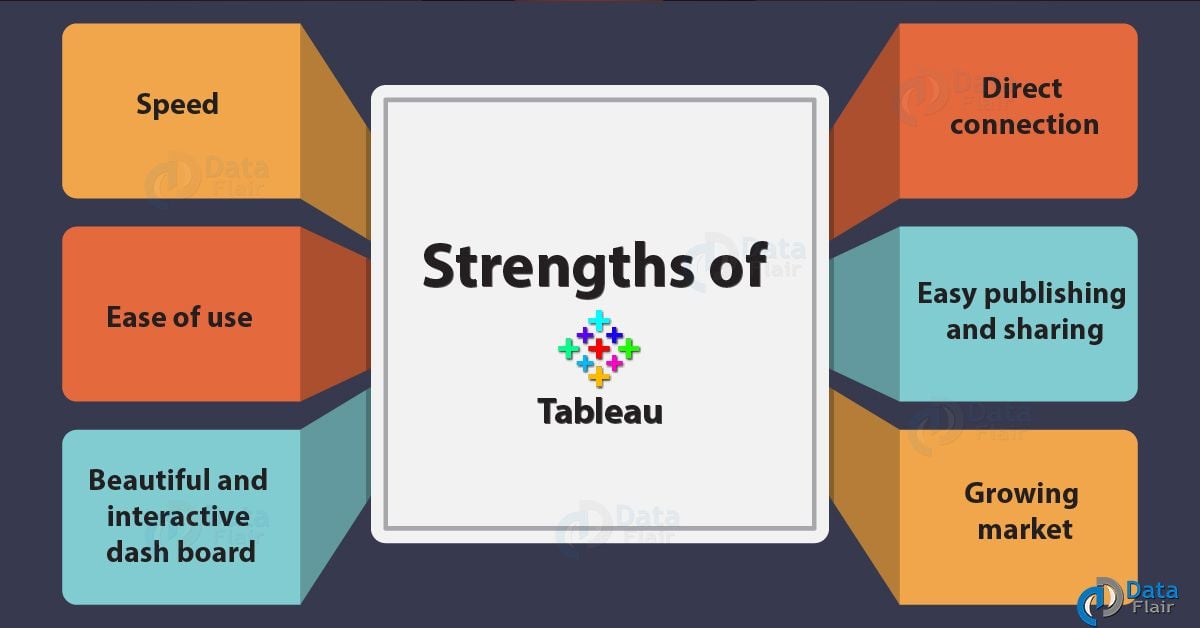
Tableau Tutorial – Advantages of Tableau
a. Speed
Tableau is capable of analyzing hundreds of millions of rows and give the required answer in seconds. Speed is the greatest asset of a tableau. This feature of Tableau is most useful while you taking a fast business decision.
b. Ease of use
Tableau is very easy to use because of its drag and drops feature. The only prerequisite is basic MS Excel skills and that is all, no prior programming knowledge requires for it.
c. Beautiful and Interactive Dashboard
The dashboard of tableau gives dynamic and very interactive results. Images, web pages will incorporate into the dashboard very easily for smart and beautiful graphics and charts. The beautiful and interactive dashboard helps in easy storytelling, which gives a deep insight into the data.
d. Direct Connection
Tableau allows database, data warehouse, and cubes directly connect to the users. To upgrade tableau, no need to advance setup, update on its own, this makes data access very easy. For example, one can easily pick tables from spreadsheets, then data from Hadoop, which therefore makes a perfect mash-up and thus helping in getting results quickly.
e. Easy Publishing and Sharing
After the analyzing of data is done, quick sharing can be easily done, the dashboard publishes to share on web and mobile devices. This quality makes it very user-friendly and helps in getting results efficiently and quickly.
f. Growing Market
Tableau is new to the market, so it still growing day by day, i.e., its market share is growing on a daily basis. It is in almost every industry, healthcare to transportation, everywhere. It has a very strong client base, which includes companies like Nokia, Deloitte, Microsoft and many more. These companies use Tableau on daily basis to meet the requirement for business intelligence.
Follow the link to know more about Tableau Pros and Cons
Tableau Disadvantages
This Tableau Tutorial describes following drawbacks of Tableau.
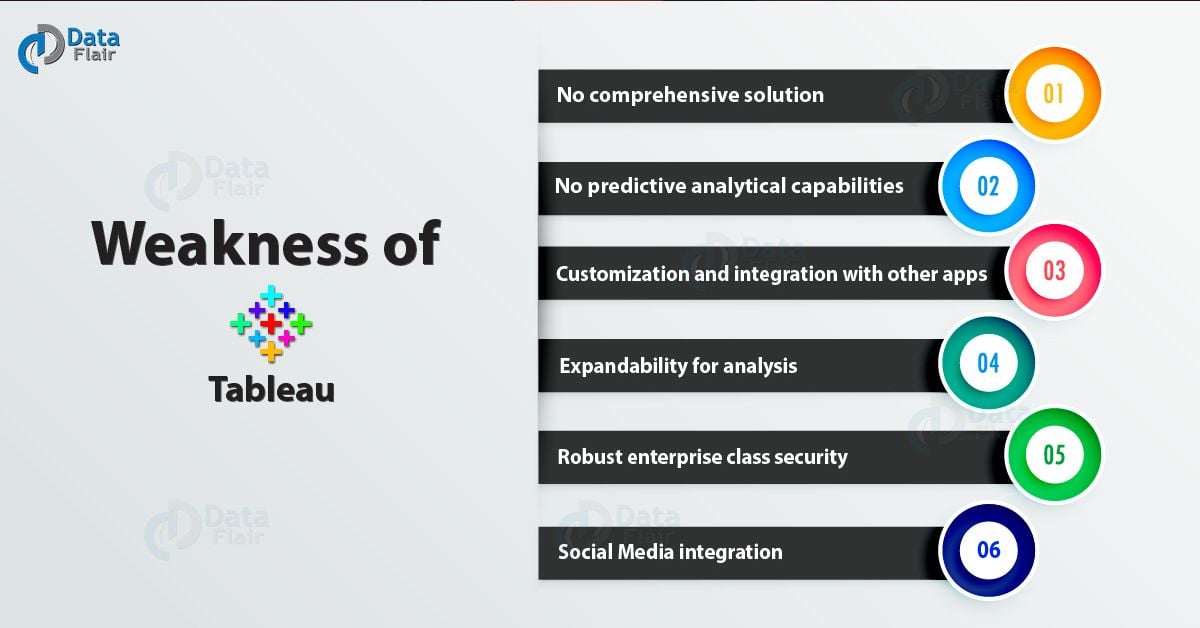
Tableau Tutorial – Tableau DIsadvantages
a. No Comprehensive Solution
Tableau, specialize BI application, which is very easy to use but still, it is not a platform which develops analytical applications that can share broadly. Tableau is not for the enterprises that have wide deployments and have broad business and population of a technical user.
b. No Predictive Analytical Capabilities
Tableau allows its user to only analyze the situation, it also does not have any predictive or statistical capabilities, and it does not support SAS, S+, etc. as other tools do. Therefore users cannot project or model the best available opportunities, it extremely limited and statistically challenged.
c. Customization and Integration with Other Apps
Tableau is an open source software, which makes it incapable of customizing or integrate with other applications, there is no way to extend it.
d. Expandability for Analysis
It does not support any kind of extensions for any extended analytics such as network graphs, box plots etc. which allows users to build relationship better with any other software would provide.
e. Robust Enterprise-Class Security
Not equipped to serve any enterprise customers as it lacks robust enterprise-class security, which is why post-sale support for customers and training quite limited.
f. Social Media Integration
It does not integrate into any collaborative capabilities into social platforms such as Facebook, Twitter, etc. Although it has integrated google analytics because of the present needs of the users.
So, this was all about Tableau Tutorial. Hope you liked our explanation.
Summary
Hence, in this tableau tutorial, we learn tableau, what is tableau, tableau basics, history tableau, tableau evolution, advantages of a tableau, and tableau disadvantages. Furthermore, if you have any query regarding Tableau tutorial, feel free to ask in the comment section.
Did you like our efforts? If Yes, please give DataFlair 5 Stars on Google


Where’s the data used in all these examples? This is useless without the Data.
Tableau tutorial for beginners, we will learn about Tableau basics: what is Tableau and its history. A tableau, a tool used for complex visualization and simplification of complex data
your tableau training blog is very good
your machine learning training blog is very good
your tableau training blog is very informative just like the machine learning blog. To know more you can go through the official website of CETPA Infotech for the best Data Analytics Online Training in Noida.