QlikView Webview Components – QlikView AJAX / WebView
Job-ready Online Courses: Click, Learn, Succeed, Start Now!
QlikView AJAX/WebView
Apart from the standard desktop mode that we’ve worked in so far in QlikView. There is one more mode in which QlikView can use that is a WebView. QlikView WebView is slightly different from the standard view in terms of the functionality it provides the users with.
In this tutorial, we’ll understand about a unique process called QlikView AJAX and explore the components of QlikView WebView.
So, let’s start QlikView Webview/AJAX Tutorial.
What is Qlikview AJAX?
As we know from our previous tutorials that all the documents finally get loaded into QlikView Access Points. From the access point, documents or applications can access for use by different clients like web clients, IE plug-ins and AJAX clients in QlikView.
QlikView AJAX is not a web application, a software or a language. Rather, AJAX is a more like a part of a process and a set of developmental techniques which helps in building a website or a web application.
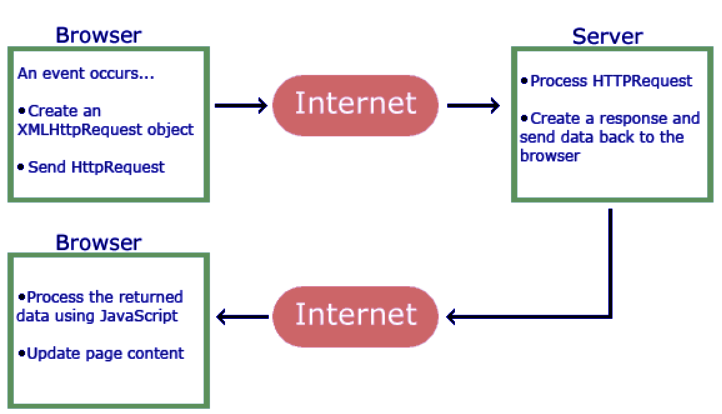
AJAX stands for Asynchronous JavaScript And XML, which use in web applications to update web content asynchronously. By asynchronous updating, it is meant that when a part of a web page’s content change, only that part of the webpage updates without reloading the whole web page which is unnecessary.
Do you know What is QlikView Distribution Service?
At its core, QlikView AJAX function is composed of two parts,
One component is a built-in XMLHttpRequest object in the browser, which use to request data from the web server.
JavaScript and HTML DOM, which is sent back by the server to the browser as a response to display or use the data.
Introduction – QlikView AJAX
In QlikView, AJAX clients that have deployed WebView as the mode to work on QlikView. The AJAX clients communicate with the components at the back end by first getting connected to the QlikView Web Server (either QlikView’s Web Server or Microsoft’s IIS) which connects it to the QlikView Server.
The QlikView Documents retrieve from the back end using the QlikView Server. No client-side installation of any kind require and it can run on any browser like Chrome, Safari, Firefox. To the users, especially AJAX clients QlikView is available in QlikView WebView.
What is QlikView Webview?
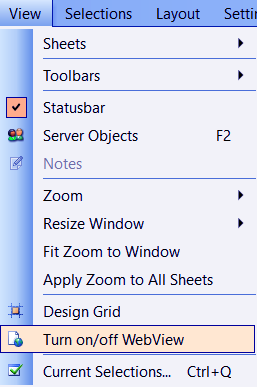
The QlikView WebView deploys from the View menu. Select On/Off WebView and your document’s current mode will switch to QlikView WebView mode.
Introduction – QlikView Webview
However, the QlikView WebView looks much similar to the traditional layout, there are a few differences in the sheet and sheet objects which we will discuss below. There are many options available in the drop-down menu which comes upon right-clicking anywhere on the sheet.
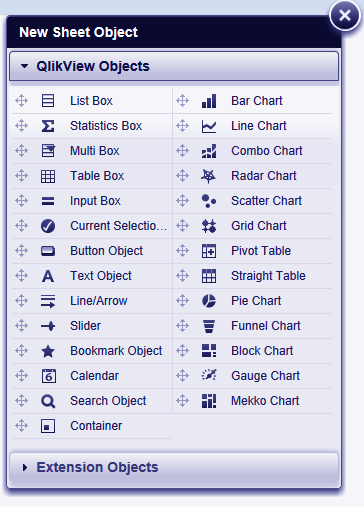
As you can see, there are many options given in this drop-down list. We can select sheet objects from the New Sheet Object option, which opens a dialog displaying all the available sheet objects as shown in the image below.
Webview in QlikView
To use a sheet object, all you need to do is select the sheet object you want, put the cursor on this icon and drag it to the sheet and drop it wherever you want. If you want to change any properties of the sheet object you can edit it through their Properties dialog. Let us discuss some components and sheet objects in QlikView WebView in detail.
Let’s Learn QlikView Database Connections & Inline Data
Components of QlikView WebView
i. Sheets
The sheets in QlikView WebView similar to that in traditional viewing. The sheets and the sheet objects can be managed by the operations available in the drop-down menu.
QlikView Webview Components – Sheets
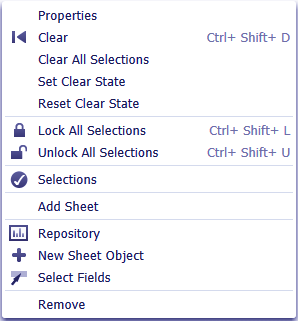
You can perform many operations on the items residing on the sheets. You can set the sheet properties from Properties option, manage selections from Clear, Clear All Selections, Set Clear State, Reset Clear State, Lock or Unlock All Selections. Now, you can view the current selections from the Selections option.
You can use the Add Sheet option to add a new sheet. The Repository option shows the details of all the objects existing in a document. You can add sheet objects using the New Sheet Object. Lastly, you can select the fields using Select Fields option and remove the current sheet by Remove option.
ii. Toolbar
The QlikView toolbar contains the following icons. The table given below describes the function of each icon.
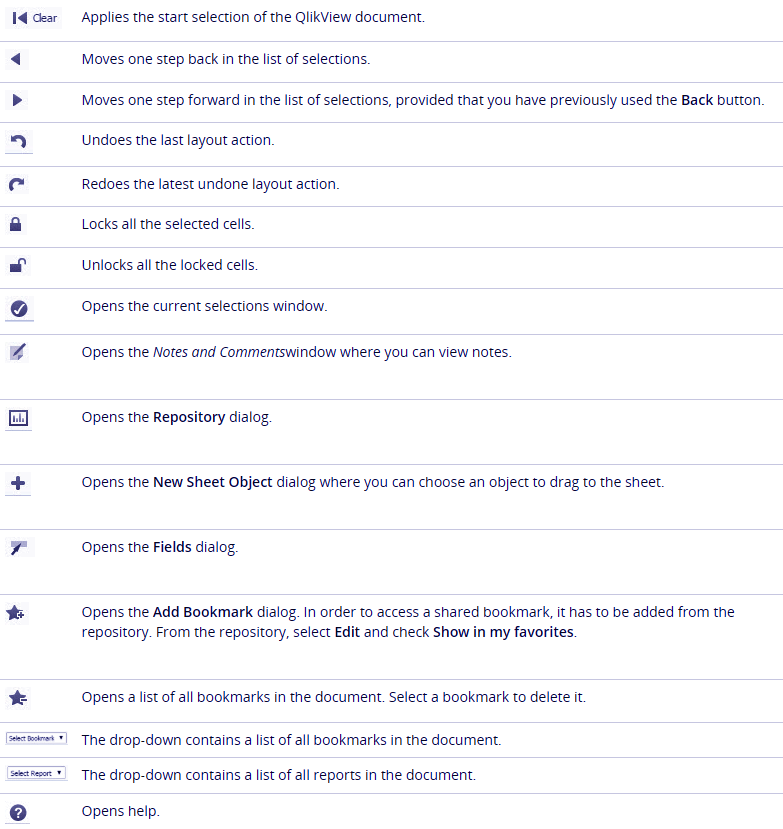
QlikView Webview Components – Toolbar
Do you know how to create QlikView Data Files (QVD)?
iii. Repository
The QlikView Repository option opens a dialog which has a list of all the objects, dimensions, expressions and bookmark that are present in your QlikView Document. You can sort the list by type or by name and select what objects, dimensions, expression and bookmarks you want to see i.e. created by you, show document items and few more criteria.
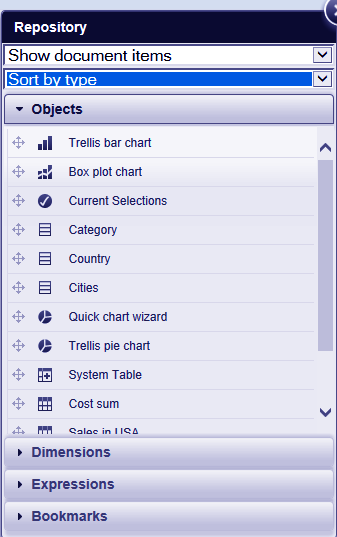
QlikView Webview Components – Repository
iv. List Box
We can create QlikView list box by dragging it onto the sheet. You can manipulate the list box through the properties option when you right click on the list box. Upon right clicking, the object menu drop-down list appears having many options.
The properties dialog has four sections; List box, Presentation, Caption and Option.
From the List box tab, you can select the field whose value is to display in the list box in QlikView. Also, you can set an expression to apply on the field and its values. The add icon lets you add a new expression and you can delete an expression by remove icon.
Through the settings option, you can go to the expression settings window where you can set a conditional expression, set alignment for text and numeric data and change the representation of the data. From the icon, you can edit the expression.
If you click on the ‘More’ option, you will get two additional tabs, Sort and Number, where you can set the sorting criteria and set number settings. Refer to the image below, as you can see, the changes you make in the properties dialog will immediately show in the list box.
This feature of QlikView webview is very useful as you can instantly check how the sheet object is changing and looking when you manipulate it from the properties dialog.
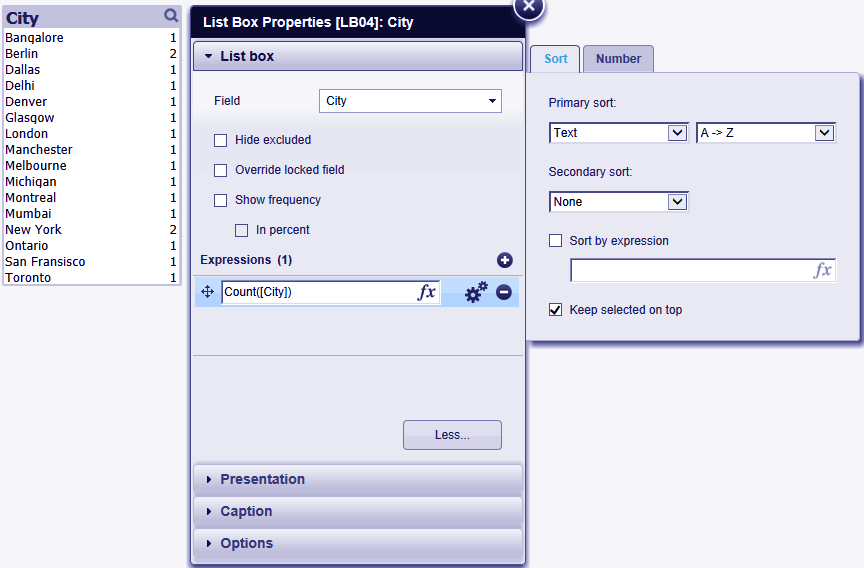
QlikView Webview Components – List Box
In the Presentation tab you can edit the selection style, number and text alignment, set background image or colour. From the More option, you can select the Styles for the text. this icon lets you select the font style, this lets you select the font color and also, you can select the background for captions through this icon. To close this extra window, click on Less.
Have a look – QlikView Star Schema
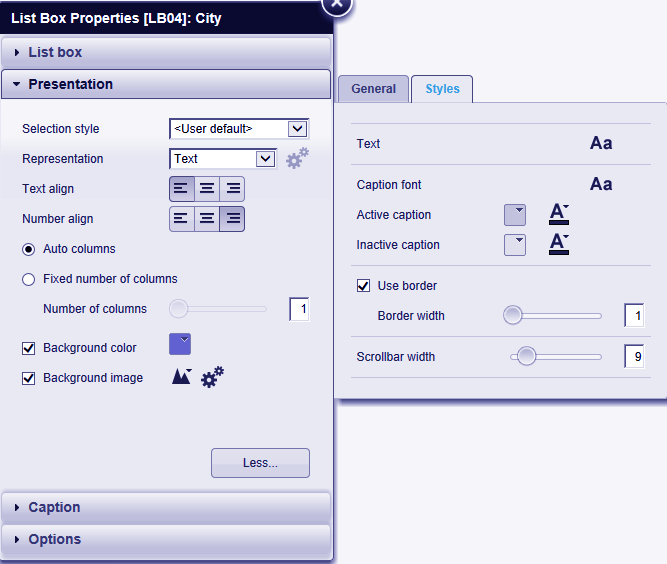
QlikView Webview Components – QlikView List Box (presentation)
From the Caption tab you can set a caption label and align the caption as you like.
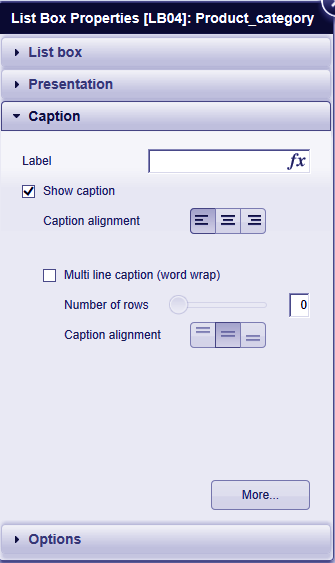
QlikView Webview Components – Product Catagory
Lastly, from the Options section, you can set the dimensions of the QlikView list box.
Also, read – QlikView IntervalMatch & Match Functions
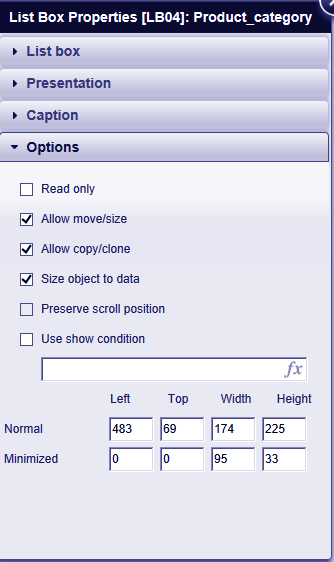
QlikView Webview Components – Option
v. Statistics Box
As the QlikView statistics box use to perform statistical operations on the data value. In the properties window, you get four sections; Statistics box, Presentation, Caption and Option. The last three sections have same options as we saw in the list box properties window.
Only the first section QlikView Statistics box has options to edit the statistics box. In this section, you can select the field whose values you want to perform statistical functions on. Also, you can select from a number of statistical functions to be applied on the field values.
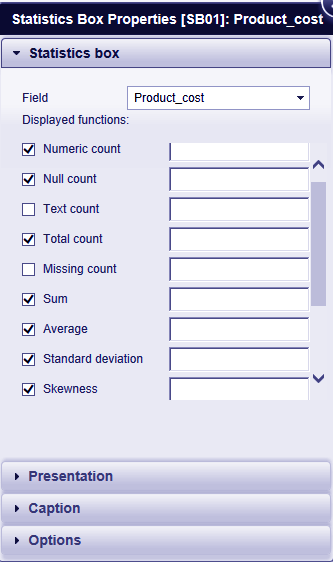
QlikView Webview Components – Statistics box
vi. Multi-Box
The QlikView multi-box displays the selected field names and have an arrow at the corners of the cells, clicking on those arrows, you get a list having all the field values. The selections made are shown with green beacons. The properties window you can select the fields to be included in the multi box. You can select from more options by the additional properties you get by clicking More.
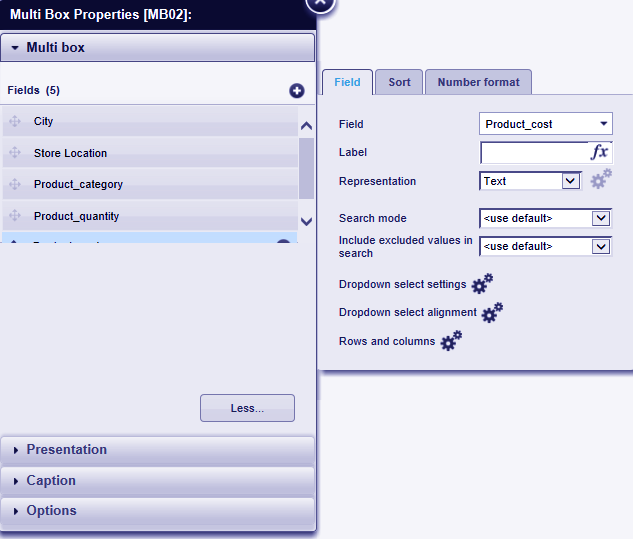
QlikView Webview Components – QlikView Multi-Box
vii. Table Box
A simple box contains field values as the first column. Each field then has related values in the cells to follow. From the properties dialog of the table box, you can select and add the field names to the QlikView table box. You can promote or demote the fields by holding and dragging the icon up and down. Additional settings on fields names, font, representation style etc can be done from here.
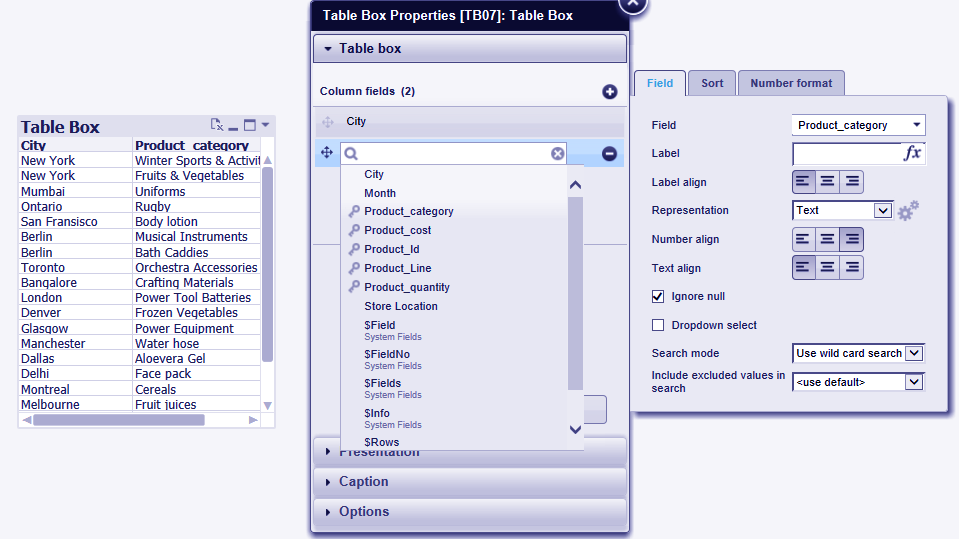
QlikView Webview Components – Table Box
viii. Input Box
As the input boxes use to display data enter in variables, the properties dialog lets you add variables to display on the input box.
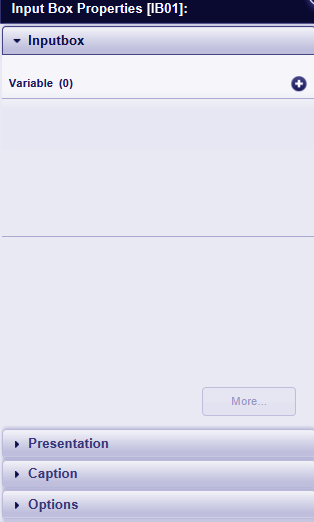
QlikView Webview Components – Input Box
ix. Current Selections Box
The QlikView current selections box shows the details of all the active or current selections made in the sheet objects present in a document. From the properties window, you can select or deselect options that you want to show on the current selection box.
Let’s Explore Tableau Select Marks – Rectangular Lasso & Radial Selection
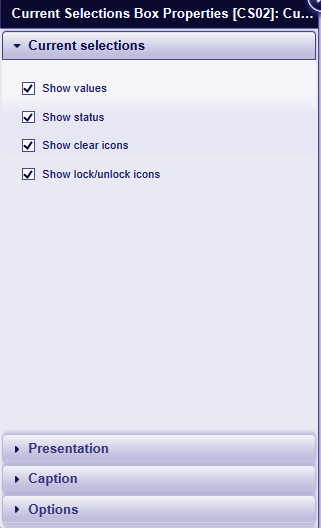
QlikView Webview – Current Selections Box
x. Button
The button object performs an action assign to it upon clicking on it. You can assign the action to perform and design the button from the properties window of the Button object.
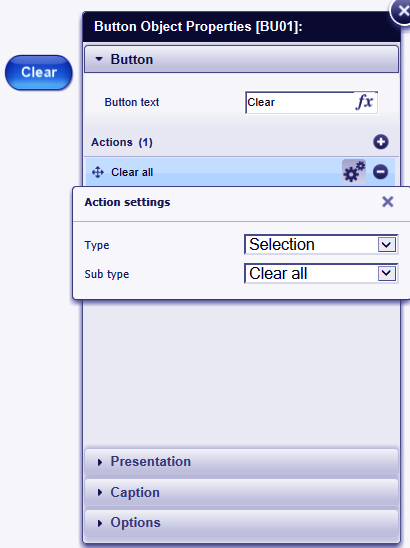
QlikView Webview Components – Button
xi. Text Object
The QlikView text object simply shows a descriptive text. You can enter the text and design the text object with colors, fonts and background of your choice from the properties dialog of the Text object.
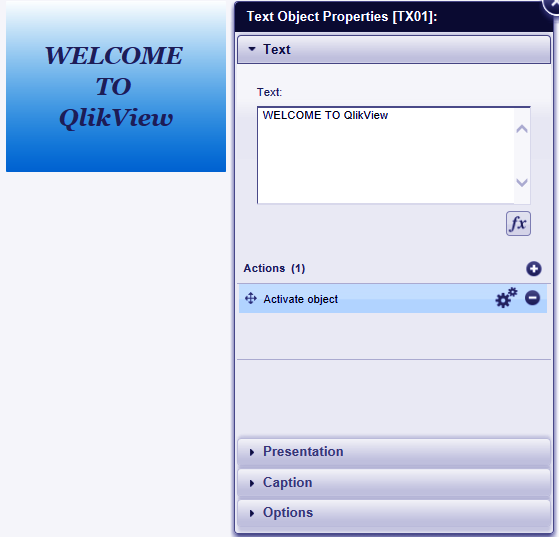
QlikView Webview Components – Text Object
xii. Line/Arrow Object
The line or arrow object adds a line or an arrow in the sheet. These objects are usually used to structure the display of data on the sheet. Like you can add a vertical line to separate two columns or add an arrow to point towards a value. You can assign an action type to these lines and arrows as well so that they appear only when the action is called.
Do you know How QlikView Works and its Architecture?
The properties window for line/arrow object is shown in the image below.
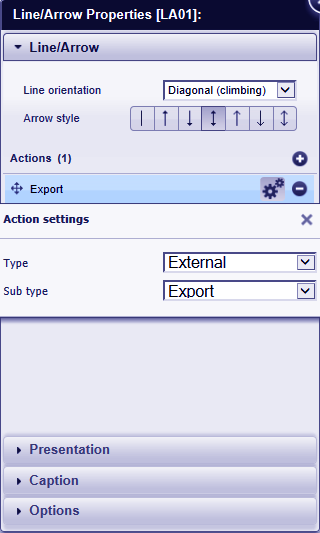
QlikView Webview Components – Arrow Object
xiii. Slider Object
The QlikView slider object provides the field values in a slider representation from which you can select on the field you want by sliding the needle. You can create and manipulate a slider object from the properties window.
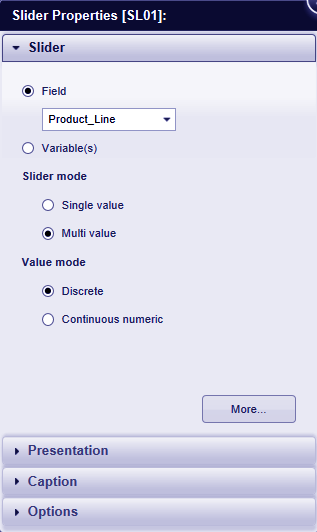
QlikView Webview Components – Slider Object
xiv. Bookmark Object
The QlikView bookmark object shows a list of all the saved bookmarks present in a document. You can also add or remove a bookmark from this object. More manipulations can be performed from the properties window.
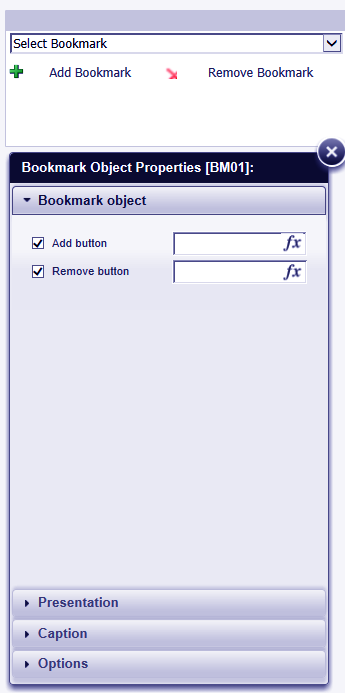
QlikView Webview Components – Bookmark Object
xv. Calendar Object
In the QlikView calendar object, you can get the field values and variables displayed. Also, there are two modes; Single value and Multi-value to select dates from the calendar.
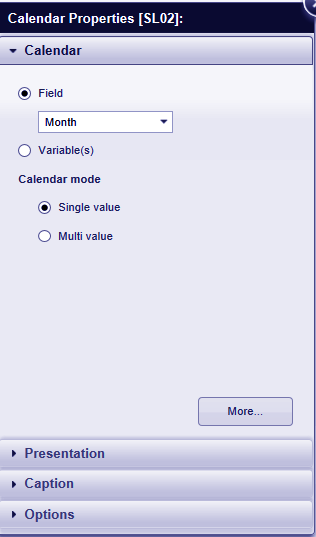
QlikView Webview Components – Calender Object
xvi. Search Object
A search object is a simple search bar that appears on the sheet through which you can search for values present anywhere in the document. You can alter the settings from the properties dialog of the search object.
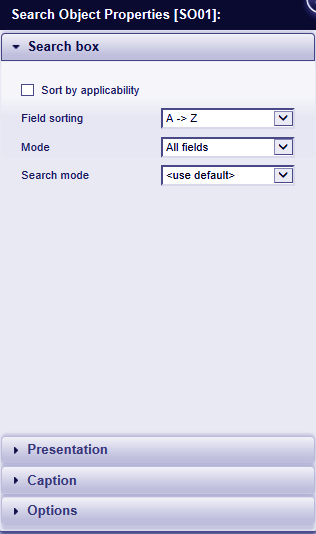
QlikView Webview Components – Search Object
xvii. Container Object
The container object can contain multiple sheet objects that are present in a document for referral purposes. You can view at multiple sheet objects collectively in the container object and notice how they behave upon making selections on some field values. In the properties dialog, you can add as many objects available in the document from their document IDs.
Also, Refer – QlikView Navigation Pane
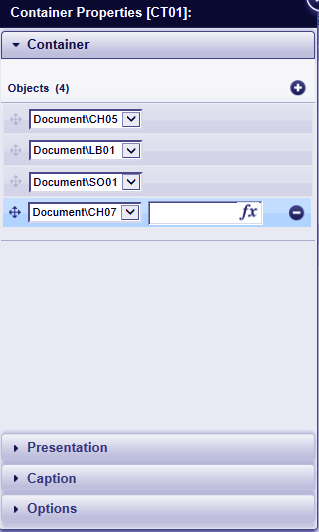
QlikView Webview Components – Container Object
xviii. Bar Chart
The QlikView bar chart is a very common way of representing data in the form of bars of varying heights. You can instantly make a bar chart with some pre-set expressions and pre-selected dimensions by holding the bar chart option and drag and drop it on the sheet. Although you can change the properties from the properties window you’ll get by right-clicking on the bar chart object.
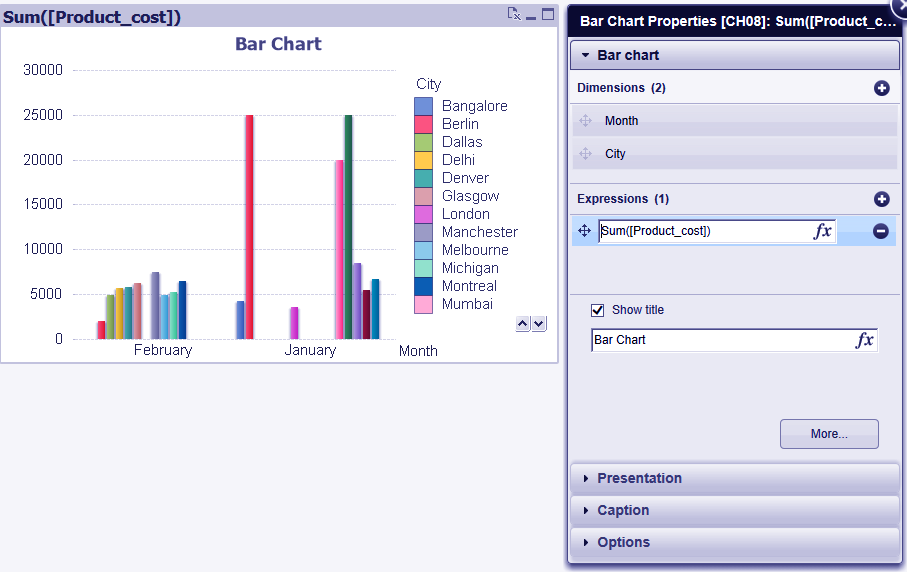
QlikView Webview Components – Bar Chart
xix. Line Chart
QlikView Line chart connects data points on a chart with a line. Such charts are more of use when we want to identify patterns or trends shown by data. You can edit the properties from the line chart properties window.
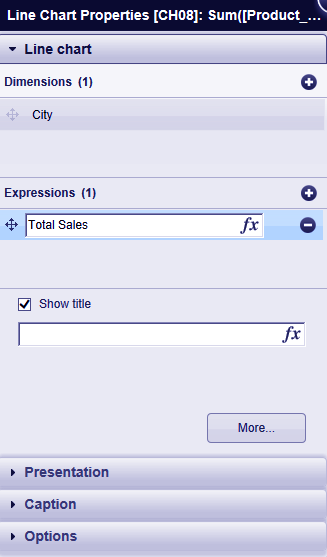
QlikView Webview Components – Line chart
xx. Combo Chart
A QlikView combo chart is a combination of both bar and line charts where you can set separate expressions for both types of charts. In the properties dialog of a combo chart, you can add fields, the expression for each line and bar chart can be set individually from the More option. Where you get additional tabs like Dimension, Sort, Limit, Axis.
Let’s Explore QlikView Charts – Funnel, Grid, Line, Mekko, Scatter
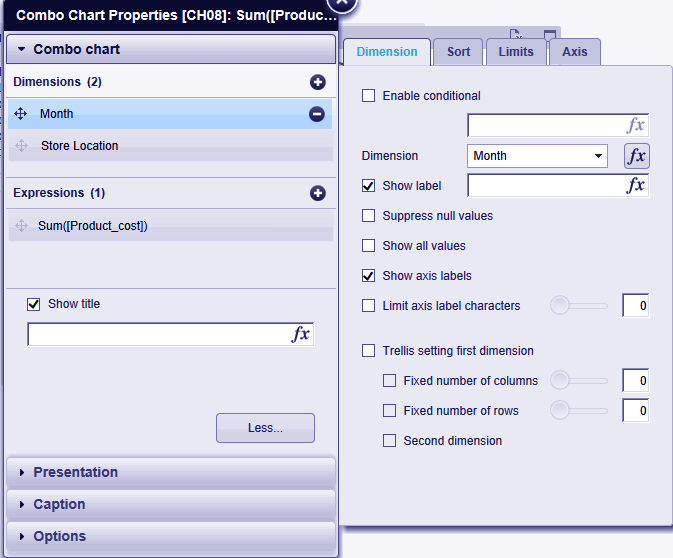
QlikView Webview Components – Combo Chart
xxi. Radar Chart
As we know from the earlier lessons, radar chart looks like a spider’s web because the x-axis is wrapped around 360 degrees and there is one y-axis value indicated for on the wrapped x-axis. The properties window of radar chart looks like the one given in the image below in QlikView WebView.
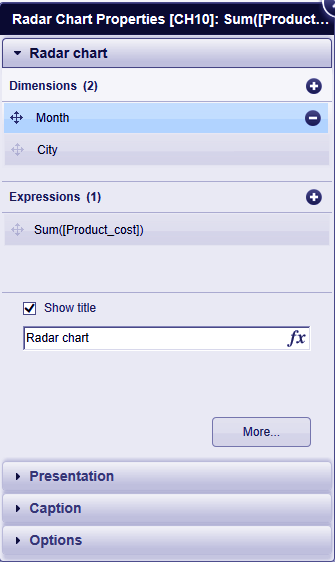
QlikView Webview Components – Radar Chart
xxii. Scatter Chart
QlikView Scatter charts show information in the form of dots (or any symbol you choose) scattered on the XY plane. It is normally when a dimension has two value or data points to show, a scatter chart is used. The properties dialog of the scatter chart is given below.
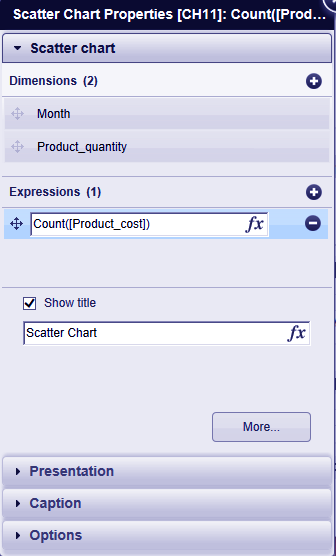
QlikView Webview Components – Scatter Chart
xxiii. Grid Chart
QlikView Grid chart, being very similar to a scatter is however distinct from it as in a grid chart, the dimensions are present on the x and y-axis and the ploy points are the values calculated by the expression.
Do you know what is QlikView Join Functions and its types?
The properties dialog of a grid chart is shown below.
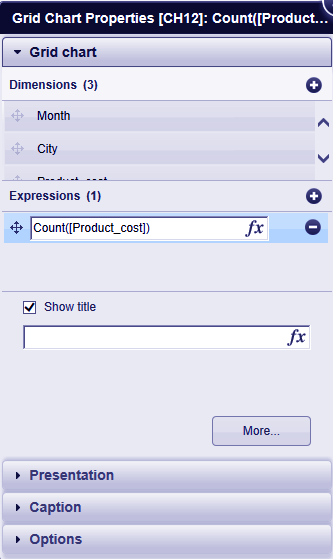
QlikView Webview Components – Grid Chart
xxiv. Pivot Table
A QlikView pivot table is a chart type table where the whole table’s content can collapse into a smaller table and only the field names show on the screen. You can evaluate the field values by expressions and get them display in the pivot table. Many manipulations can be done in a pivot table through its properties window.
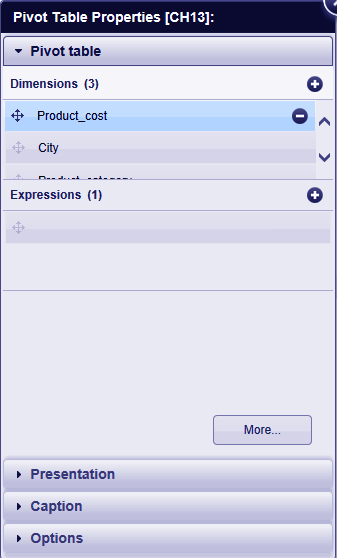
QlikView Webview Components – Pivot Table
xxv. Straight Table
A straight table is a simple table displaying data dynamically. It is not a table object but a type of chart. You can add fields and evaluate the field values using expressions. You can add fields and apply expressions from the properties window and can manipulate the data in a straight table in many ways from the properties window.
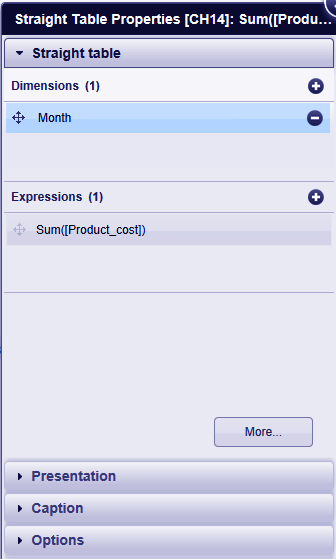
QlikView Webview Components – Straight Table
xxvi. Pie Chart
QlikView Pie charts are the most widely use method of pictorially representing data. Generally, a pie chart is made of a single dimension field having applied one expression on them. You can also add a title to the chart and do many more from the properties window of the pie chart.
Follow this link to know about QlikView Themes
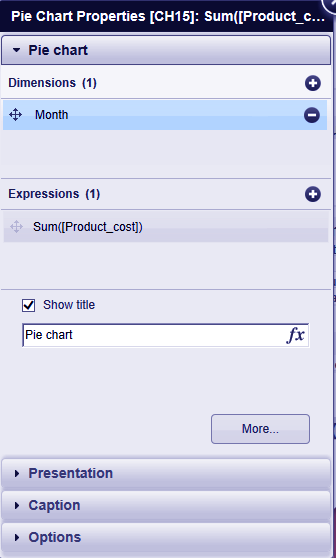
QlikView Webview Components – Pie Chart
xxvii. Gauge Chart
A QlikView gauge chart use to display a value of a single expression on a gauge like object (with several ways of representation like speedometer, thermometer, test tube, traffic lights etc.). If you choose a gauge representation, you will have your data value represented in a gauge meter where the meter’s needle will be at the position depending upon what value is it and the range chosen.
If you set the range from 0 to 10,000 a value falling between this range will be the value, the gauge needle will point at. You can set more properties through the properties dialog shown in the image below.
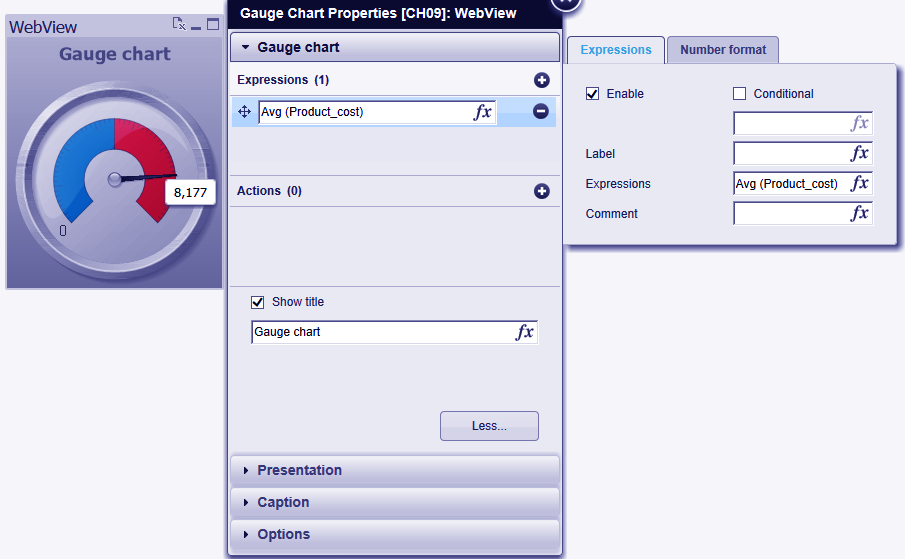
QlikView Webview Components – Gauge Chart
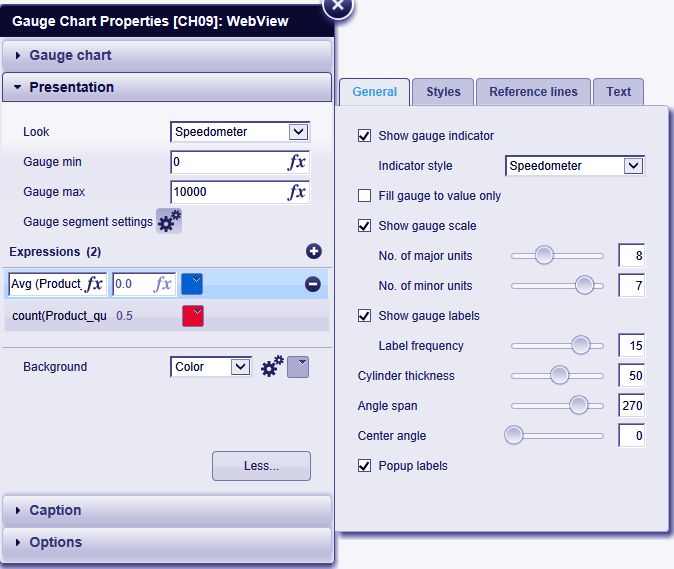
As you can see in the gauge chart created next to the properties window, we have entered an expression which instructs the system to calculate the average of product’s cost. The gauge’s needle positions at the average value i.e. 8,177. You can make more manipulations in the Presentation section like selecting the look, setting the minimum and maximum limits, selecting the colors.
QlikView Webview Components – Gauge Chart Properties
xxviii. Funnel Chart
A QlikView funnel chart shows data values that are part of a flow process. It call as funnel chart because of its shape. You can change the properties and create a funnel chart as you want by the properties dialog.
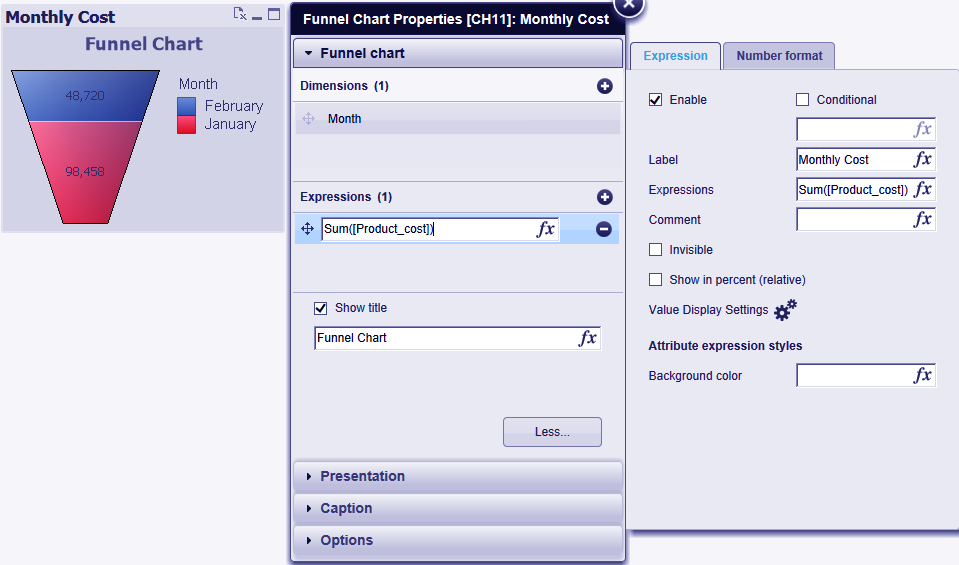
QlikView Webview Components – Funnel Chart
Let’s Explore QlikView November 2017 (12.2 Version)
In the first section of the properties dialog, you can set the dimensions, expressions, enter a title, numbers etc. In the Presentation section, you get to select the color style, orientation, background options. Also, from the More.. option, in the General tab, you can select the data proportionality criterion i.e. segment height or segment area being in proportion with the data being used.
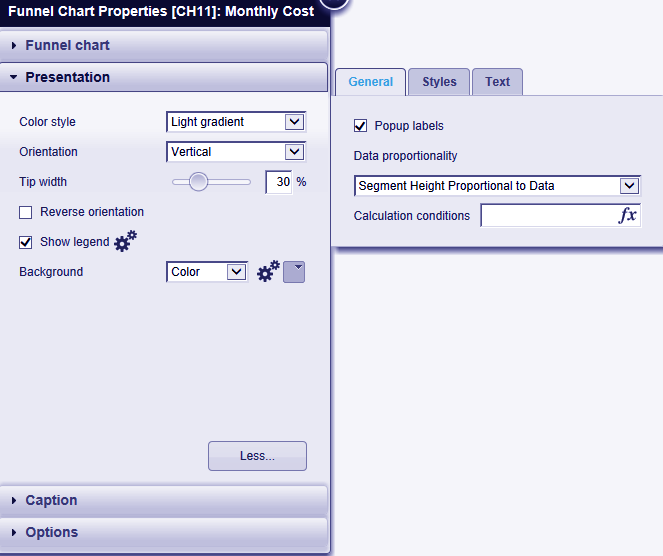
QlikView Webview Components – Funnel Chart Properties
xxix. Mekko Chart
QlikView Mekko Chart displays data in the form of bars whose width is proportional to the data value it is displaying.
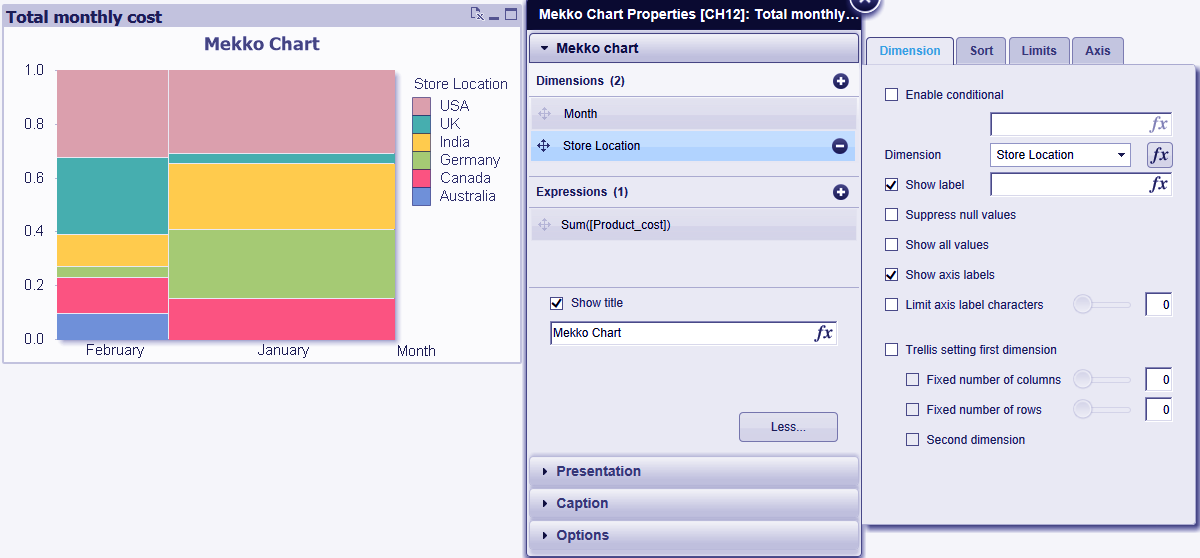
QlikView Webview Components – Mekko Chart
The image shows a mekko chart we have created (refer to the properties window) where the dimension ‘Month’ have divided the chart into two sections (January and February).
Further, the second dimension ‘Store Location’ has divided each of the two sections into several bars corresponding to the total sales (applies through the expression Sum([Product_cost])) in each country in that month. The legend on the right of the chart shows which color represents which country.
The other sections like Caption, Options and Presentation have options that help in setting the chart styles, captions, dimensions etc.
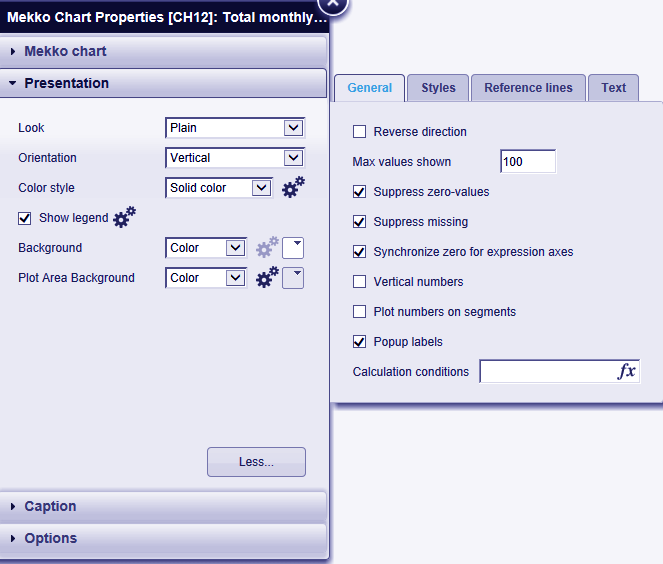
QlikView Webview Components – Mekko Chart Properties
Have a look – QlikView Silent Installation
xxx. Block Chart
Much similar to the Mekko chart, a Block chart shows data values as blocks of varied sizes. The size of each block corresponds to the value of it is supposed to represent.
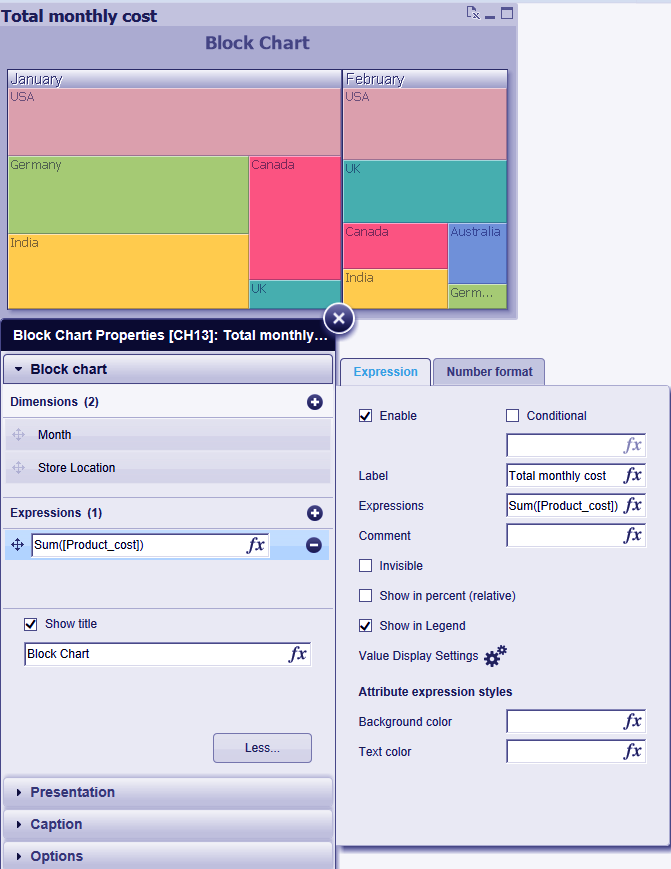
QlikView Webview Components – Block Chart
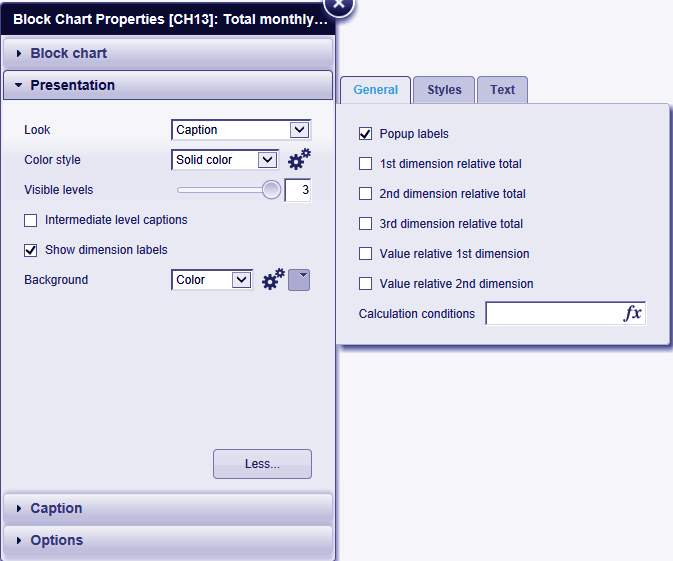
QlikView Webview Components – Block Chart Properties
In the block chart that we’ve created, each block displays the total product sales cost in a specific country.
So, this was all about QlikView WebView / AJAX Tutorial. Hope you like our explanation.
Conclusion
So, in this tutorial, we’ve discussed the QlikView WebView / AJAX and went through a long list of components of WebView. We saw the entire sheet objects that can create in the QlikView WebView dynamically.
The QlikView AJAX part of the application reflects here, as while creating any sheet object when you are making changes in it through the properties window, the changes instantly update in the sheet object itself which is done by AJAX’s asynchronous updating. The sheets objects manipulate instantly as each sheet object has a properties window that invokes by right-clicking on the sheet object.
Furthermore, if you have any query, feel free to ask in the comment box.
Related Topic – QlikView Simple Network Management Protocol
Did we exceed your expectations?
If Yes, share your valuable feedback on Google


