Quick Chart Wizard in QlikView – Create 6 Types of Charts in QlikView
Job-ready Online Courses: Click, Learn, Succeed, Start Now!
In our last tutorial, we talked about QlikView Time Chart Wizards. Today, we will learn Quick Chart Wizard in QlikView. Moreover, we will explore the steps to use QlikView Quick Chart Wizard to make Bar chart, Straight chart, Line chart, Pivot chart, Pie chart and Gauge chart in QlikView.
The most common way of graphically representing data is through charts. Traditionally these charts are made through the New Sheet Object option which is a lengthy process offering many types of properties tab for you to select from. Use Quick Chart Wizard to skip the lengthy steps of making a chart in QlikView.
So, let’s start the QlikView Quick Chart Wizard Tutorial.
What is QlikView Quick Chart Wizard?
The QlikView Quick Chart Wizard like any other wizard helps the users in making a simple chart. The wizard follows definitive steps in order to create a final chart with the user’s data. The main advantage of such chart wizards is:
- This method of creating charts is very quick than doing it conventionally.
- The user is prevented from unnecessary complexities caused by the n number of chart properties and settings that can easily avoid in a wizard.
So, it is fair to say that such chart wizards save a user’s both time and effort.
Do you know How to Define Concatenate in QlikView?
How to Use Quick Chart Wizard in QlikView (Pie Chart)?
We have used store sales data as an input to create a pie chart at the end, using the Quick Chart Wizard in QlikView.
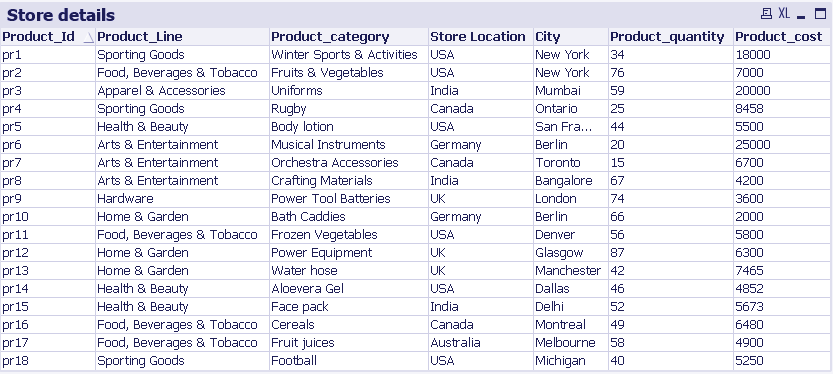
Sample of Quick Chart Wizard in QlikView
To invoke the QlikView quick chart wizard, go to the Tools menu in the menu bar and select Quick Chart Wizard.
The dialog opening, if you are using this wizard for the first time, will be an introductory one in which information regarding the wizard and the steps used in the creation of the chart is mentioned. Check the box at the bottom so that this dialog is not shown later. Click Next to continue.
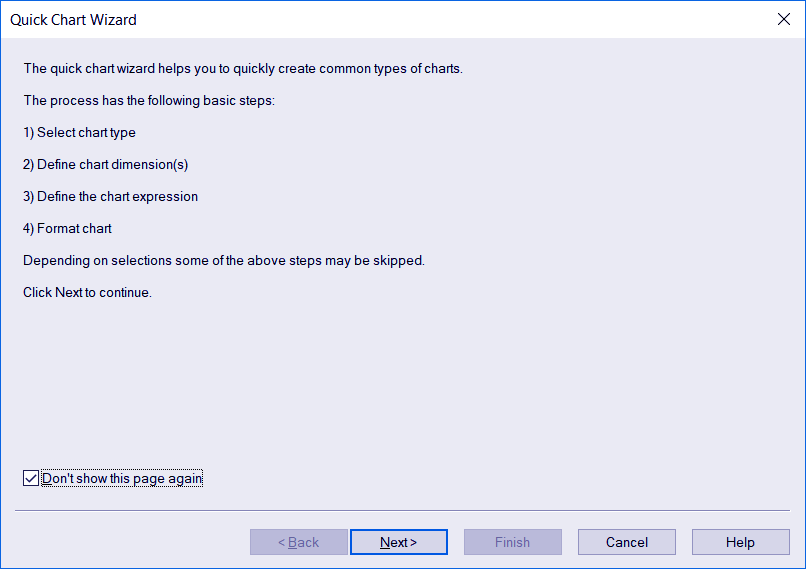
Quick Chart Wizard
Read about – QlikView Distribution Service
i. Step one – Select Chart Type
Here you can choose from six different chart types. We have selected Pie chart to represent our data. Click on Next to continue.
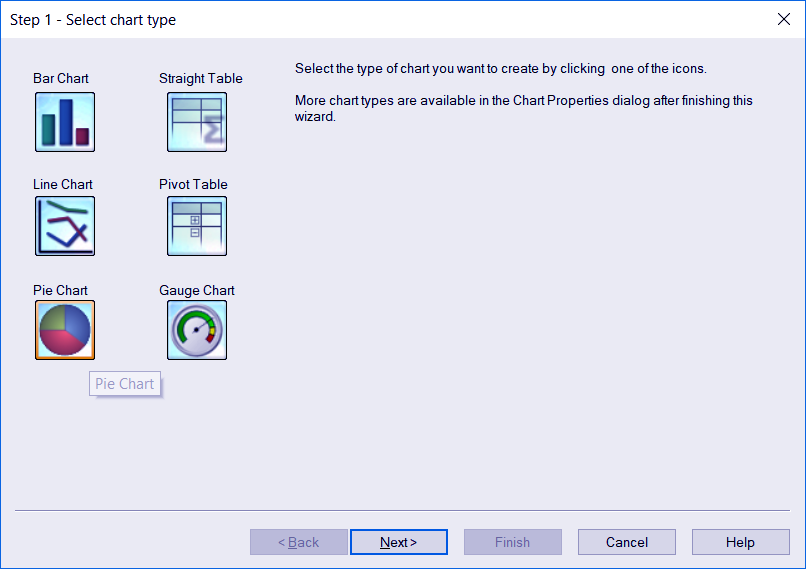
Step.1 – Select Chart Type
ii. Step Two – Define Dimension(s)
One or more than one dimensions can enter in this step. The dimension values will be the base values, the chart will create against. Click on Next to continue.
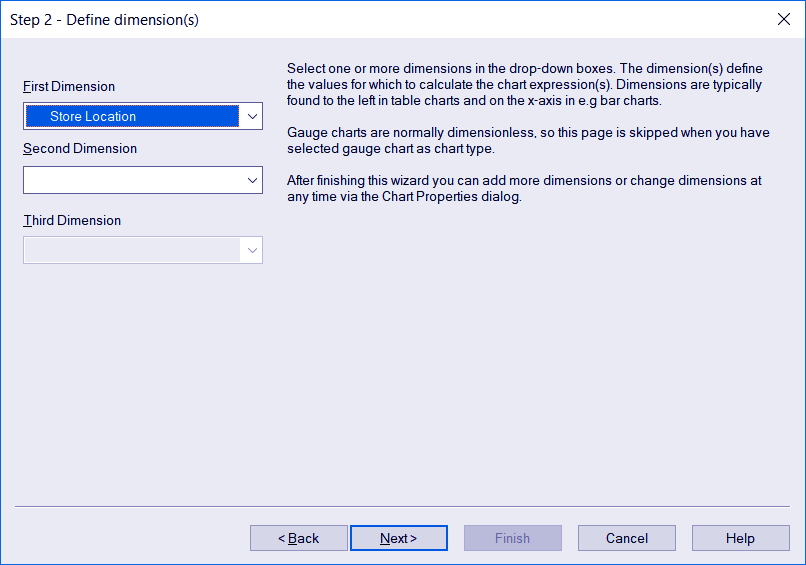
Step.2 – Define Dimension(s)
iii. Step Three – Define Expression
There are three most commonly used functions already given i.e. Sum, Average and Count. In the space given below, you have to select the measure or numerical field upon which these calculable functions will apply. Also, if you want to make an expression using some functions other than these three, you can select the Custom option and write an expression manually.
Follow this link to know about QlikView Dimensions and Measures
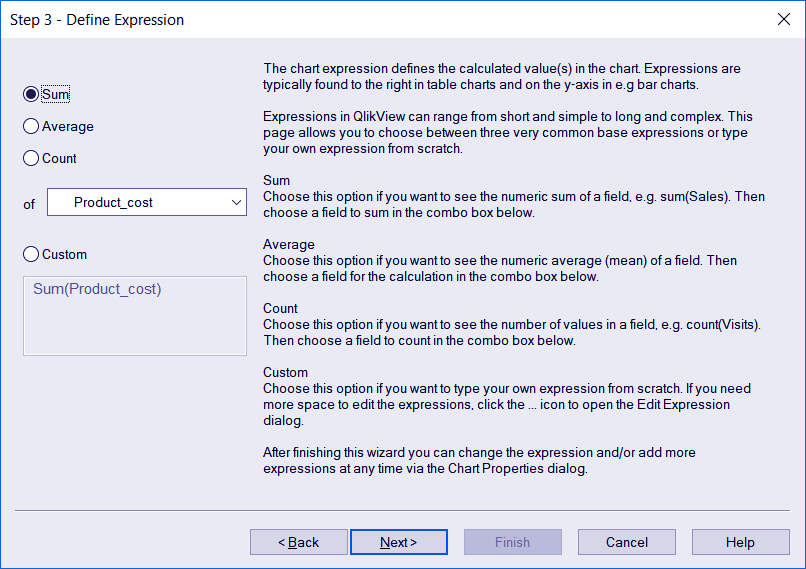
Step.3 – Define Expression
iv. Step Three – Chart Format
In this step, you get to select the format or appearance style of the chart. This step may have some more option depending on which chart type you have chosen in the first step. The option that can see in the image below are those of the pie chart. You can also select a maximum number of slices a pie can divide into. Click on Finish to end the wizard.
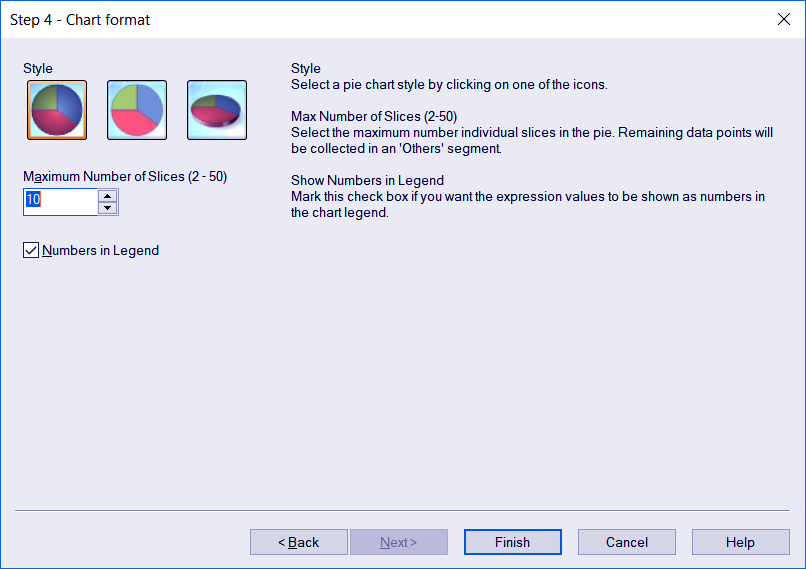
Step.4 – Chart Format
The final chart created will look like this.
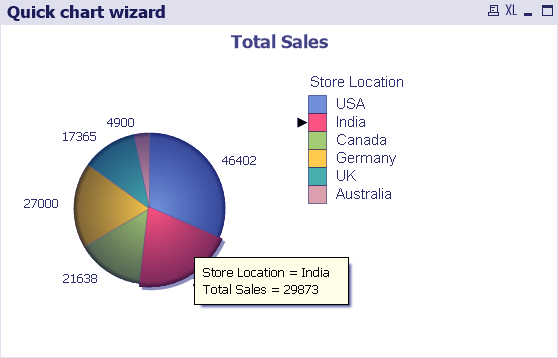
QlikView Quick Chart Wizard – Final Chart
As you can see in the image, a pie chart showing the total sales of a store based on the countries. Upon taking the cursor on each slice, there appears the information of which country that slice representing and the total sales that had occurred in that city.
So, this was all about QlikView Quick Chart Wizard. Hope you like our explanation.
Conclusion
In this tutorial, we learned about the quick chart wizard in QlikView and how to use it to create charts like Bar chart, Straight chart, Line chart, Pivot chart, Pie chart and Gauge chart. The steps for each type of chart vary slightly in the wizard.
If you need any kind of guidance, approach us through comment box.
Related TopIc – QlikView IntervalMatch
Did you like our efforts? If Yes, please give DataFlair 5 Stars on Google


