QlikView Aggregate Function – 6 Types of AGGR() Function
Placement-ready Courses: Enroll Now, Thank us Later!
One of the very useful functions amongst the long list of functions that we saw in the previous tutorial is QlikView Agg() Function category. In this QlikView Aggregate Function, we are going to gain a better understanding of aggregate functions and also learn to apply these functions to our data.
Along with this, we will learn different types of Aggregate Function in QlikView with their subtypes and examples.
So, Let’s start QlikViewAggregate Function.
QlikView Aggregate Function – 6 Types of AGGR() Function
What is QlikView Aggregate Function?
QlikView Aggregate function is provided to aggregate or bundle your data from the rows in the table. You can apply mathematical or statistical operations collectively on large data loads. There are sub-categories or types of QlikView aggregate function each based on the action they perform on the data.
You can apply these functions to the table fields while loading your data files in the qlikview script editor. A Group By clause is very essential to add while incorporating the QlikView aggregate function in the load statement. This clause specifies the field in the table of which you want the data to aggregate.
Do you know How to Create, Import, Remove QlikView Bookmarks?
Types of Aggregate Function in QlikView
There are seven different sub-categories of QlikView aggregate function. Here we will study some function sub-category with the function they perform and examples in details.
i. Basic Aggregation Functions
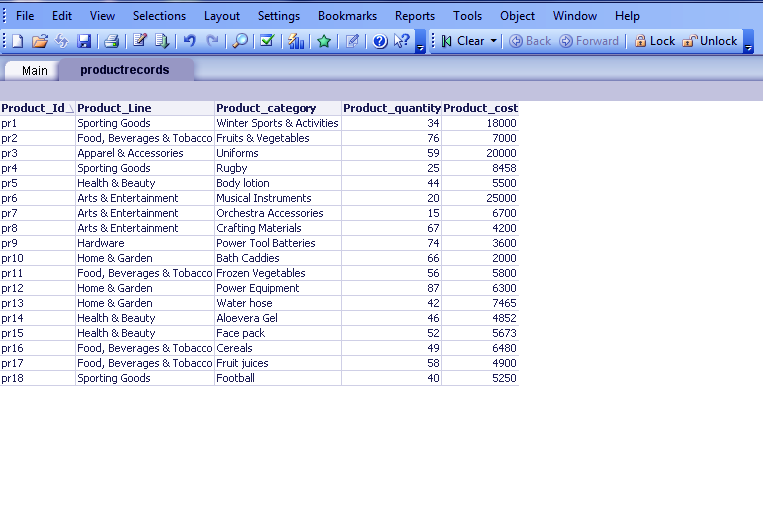
We will use a reference data record of Product details and apply the QlikView aggregate function on it.
QlikView Aggregate Function – Basic Aggregation Functions
a. sum([distinct]expression)
Returns the sum of a number of records of the field defined by a group by clause. If the word distinct occurs before the expression, all duplicates will be disregarded.
Example:
Productrecords:
LOAD Product_Id,
     Product_Line,
     Product_category,
     Product_quantity,
     Product_cost
FROM
[C:\Users\admin\Desktop\Dataflair\productrecord.csv]
(txt, codepage is 1252, embedded labels, delimiter is ',', msq);

Total:
LOAD
    Product_Line, sum(Product_quantity) as [Totalquantity],
                  sum(Product_cost) as [Totalcost]
     Resident Productrecords Group by Product_Line;
     Drop table Productrecords;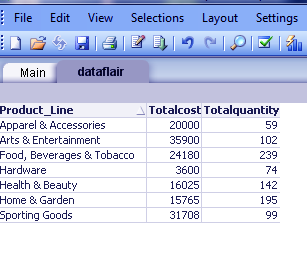
QlikView Aggregate Function – sum([distinct]expression)
Let’e Explore different types of QlikView Operators with examples
b. min( expression, rank )
Returns the minimum numeric value amongst the whole set of records as defined by a group by clause. Rank defaults to 1 which corresponds to the lowest value. By specifying rank as 2 the second lowest value will be returned and so on.
Examples:
Load Product_Line, min(Product_quantity) as minquantity from productrecords.csv group by
Product_Line;
Load Product_Line, min(Product_quantity, 2) as Secondminquantity from productrecords.csv
group by Product_Line;
c. max(expression, rank)
Returns the maximum numeric value encountered over a number of records. Rank defaults to 1 which corresponds to the highest value. By specifying rank as 2 the second highest value will be returned and so on.
Examples:
Load Product_Line, max(Product_quantity) as maxquantity
from productrecords.csv group by
Product_Line;
Load Product_Line, max(Product_quantity, 2) as Secondmaxquantity
from productrecords.csv
Productrecords:
LOAD Product_Id,
     Product_Line,
     Product_category,
     Product_quantity,
     Product_cost
FROM
[C:\Users\admin\Desktop\Dataflair\productrecords.csv]
(txt, codepage is 1252, embedded labels, delimiter is ',', msq);

Total
LOAD
    Product_Line,
    min(Product_quantity) as minquantity,
    max(Product_quantity) as maxquantity
    Resident Productrecords Group by Product_line;
    Drop table productrecords;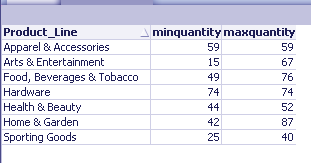
QlikView Aggregate Function – max(expression, rank)
d. only(expression )
If an expression contains only one numeric value, that value is returned. Else, NULL is returned.
Example:
Load Month, only(Price) as OnlyPriceSoldFor from abc.csv group by
Month;
Also, Read QlikView Script Statements and Keywords
e. mode(expression )
Returns the mode value, i.e. the most commonly occurring value, of expression over a number of records. If more than one value is equally commonly occurring, NULL is returned.
Mode can return numeric values as well as text values.
Examples:
Load Month, mode( ErrorNumber ) as MostCommonErrorNumber from abc.csv
group by Month;
Load Month, mode( Product ) as ProductMostOftenSold from abc.csv group
by Month;
f. firstsortedvalue (expression, sort-weight, n)
Returns the first value of expression sorted by the corresponding sort-weight when an expression is iterated over a number of records. Sort-weight should return a numeric value where the lowest value will render the corresponding value of the expression to be sorted first. By preceding the sort-value expression with a minus sign, the function will return the last value instead.
If more than one value of expression share the same lowest sort-order, the function will return NULL. By stating an n larger than 1, the nth value in order will be returned. If the word distinct occurs before the expression, all duplicates will be disregarded.
Example:
Load Product_Line,
Firstsortedvalue (Product_category, Product_quantity) as MostBoughtProduct
from Productrecords.csv group by Product_Line;
Returns the value of the MostBoughtProduct-87- Power Equipment
ii. String Aggregate Functions
This is the second type of QlikView Aggregate Function, let’s see its sub catagory:
a. MinString(expression)
Returns the first text value from records. If no text value is found, NULL is returned.
Example:
Load Month, MinString(Month) as FirstSalesMonth from abc.csv group by
Year;
b. MaxString(expression )
Returns the last text value from records. If no text value is found, NULL is returned.
Example:
Load Month, MaxString(Month) as LastSalesMonth from abc.csv group by
Year;
c. FirstValue(expression)
Returns the first value in load order. If no text value is found, NULL is returned. This function is only available as a script function.
Example:
Load City, FirstValue(Name), as FirstName from abc.csv group by City;
d. LastValue(expression)
Returns the last value in load order.
Example:
Load City, LastValue(Name), as FirstName from abc.csv group by City;
Do you know How to Apply QlikView Layout Themes?
e. concat (expression , delimiter , sort-weight)
Returns the aggregated string concatenation of all values of expression iterated through data. Each value may be separated by the string found in delimiter. The order of concatenation may be determined by sort-weight. Sort-weight should return a numeric value where the lowest value will render the item to be sorted first.
Example:
Load Department, concat(Name,’;’) as NameList from abc.csv group by
Department;
iii. Counter Aggregation Functions
a. count([distinct ] expression | *)
Returns the count of expression over a number of records.
Examples:
Load Product_Line, count(Product_cost) as TotalSalesPerMonth from Productrecords.csv
Group by Product_Line;
Returns the total count of sales in a month.
b. NumericCount(expression)
Returns the numeric count.
Example:
Load Month, NumericCount(products) as Totalproducts from products.csv
group by Month;
Result will be total number of products sold in the data record.
c. TextCount(expression)
Returns the text count .
Example:
Load Month, TextCount(Item) as NumberOfTextItems from abc.csv group by
Month;
d. NullCount(expression )
Returns the NULL count of expression.
Example:
Load Month, NullCount(Item) as NumberOfNullItems from abc.csv group by
Month;
e. MissingCount(expression )
Returns the missing count.
Example:
Load Month, MissingCount(Item) as NumberOfMissingItems from abc.csv
group by Month;
f. Advanced Aggregation
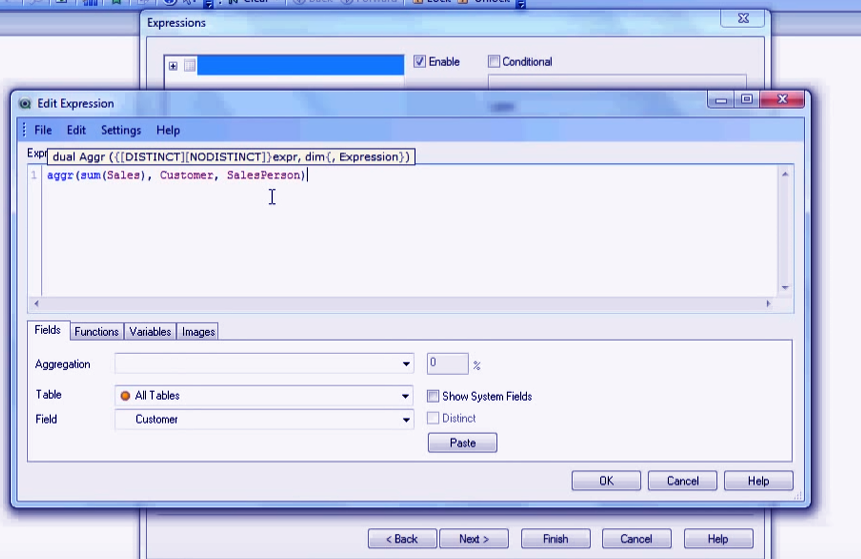
aggr ([ distinct | nodistinct ] [set_expression]expression {dimension})
Returns a set of values of expression calculated over dimensions. The result can be compared to the expression column of a ‘local chart’, evaluated in the context where the aggr function resides. Each dimension must be a single field. It cannot be an expression (calculated dimension).
If the expression argument is preceded by the nodistinct qualifier, each combination of dimension values may generate more than one return value, depending on underlying data structure.
If the expression argument is preceded by the distinct qualifier or if no qualifier is used at all, each combination of dimension values will generate only one return value.
By default, the aggregation function will aggregate over the set of possible records defined by the selection. An alternative set of records can be defined by a Set Analysis expression.
By using this function in Add calculated dimension it is possible to achieve nested chart aggregation in multiple levels.
Examples:
In the screenshots attached below , we have loaded sales data inline and have applied aggr function to calculate the sum of total sales done by each salesman. We have done this in a chart sheet object.
LOAD * INLINE [
   Customer, Sales, Product, SalesPerson
   A-Mart, 50000, "Children's wear", John
   A-mart, 25000, "Men's wear", Beth
   A-mart, 30000, "Women's wear", John
   Vogue, 10000, "Men's wear", Mike
   Vogue, 15000, "Children's wear", Susan
   Vogue, 10000, "Men's wear", Susan
   C-Mart, 40000, "Children's wear", Brad
   C-Mart, 90000, "Men's wear", Dan
   C-Mart, 60000, "Women's wear", Brad
];
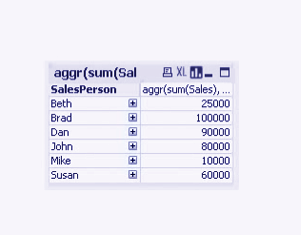
Aggr Function – Advanced Aggregation
Have a look – QlikView Simple Network Management Protocol (SNMP)
iv. Statistical Aggregation Functions
a. fractile(expression, fractile)
Returns the fractile of expression .
Example:
Load Class, fractile( Grade, 0.75 ) as F from abc.csv group by Class;
b. kurtosis(expression )
Returns the kurtosis of expression. Kurtosis measures the peak of a frequency distribution curve.
Example:
Load Month, kurtosis(Sales) as SalesKurtosis from abc.csv group by
Month;
c. correl(x-expression, y-expression)
Returns the aggregated correlation coefficient for a series of coordinates represented by paired numbers in x-expression and y-expression iterated over a number of records . Text values, null values and missing values in any or both pieces of a data-pair will result in the entire data-pair to be disregarded.
Example:
Load Month, correl(X,Y) as CC from abc.csv group by Month;
d. avg(expression)
Returns the average of expression.
Example:
Productrecords:
LOAD Product_Id,
     Product_Line,
     Product_category,
     Product_quantity,
     Product_cost
FROM
[C:\Users\admin\Desktop\Dataflair\productrecord.csv]
(txt, codepage is 1252, embedded labels, delimiter is ',', msq);

Total:
Load
    Product_Line, avg(product_quantity),
                  avg(product_cost)
     Resident Productrecords Group by Product_Line;
     Drop table productrecords;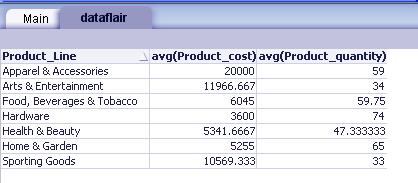
QlikView Aggregate Function – avg(expression)
e. stdev(expression)
Returns the standard deviation of expression.
Example:
Load Month, stdev(Sales) as SalesStandardDeviation from abc.csv group
by Month;
f. skew(expression)
Returns the skewness of expression .
Example:
Load Month, skew(Sales) as SalesSkew from abc.csv group by Month;
Do you know How to apply Trellis in Pie and Bar Charts in QlikView?
g. median (expression)
Returns the aggregated median of expression.
Example:
Load Class, Median(Grade) as MG from abc.csv group by Class;
h. linest_m (y-expression, x-expression [, y0 [, x0 ]])
returns the aggregated m value (slope) of a linear regression defined by the equation y=mx+b for a series of coordinates represented by paired numbers in x-expression and y-expression defined by a group by clause.
The function requires at least two valid data-pairs to calculate. If y0 and x0 are stated, a single data pair will do.
Example:
Load Key, linest_m(Y,X) as Z from abc.csv group by Key;
i. linest_b (y-expression, x-expression [, y0 [, x0 ]])
returns the aggregated b value (y-intercept) of a linear regression defined by the equation y=mx+b for a series of coordinates represented by paired numbers in x-expression and y-expression.
An optional value y0 may be stated forcing the regression line to pass through the y-axis at a given point.
Example:
Load Key, linest_b(Y,X) as Z from abc.csv group by Key;
j. linest_r2 (y-expression, x-expression [, y0 [, x0 ]])
returns the aggregated r2 value (coefficient of determination) of a linear regression defined by the equation y=mx+b for a series of coordinates represented by paired numbers in x-expression and y-expression.
Example:
Load Key, linest_r2(Y,X) as Z from abc.csv group by Key;
k. linest_sem (y-expression, x-expression [, y0 [, x0 ]])
returns the aggregated standard error of the m value of a linear regression defined by the equation y=mx+b for a series of coordinates represented by paired numbers in x-expression and y-expression
Example:
Load Key, linest_sem(Y,X) as Z from abc.csv group by Key;
i. linest_seb (y-expression, x-expression [, y0 [, x0 ]])
returns the aggregated standard error of the b value of a linear regression defined by the equation y=mx+b for a series of coordinates represented by paired numbers in x-expression and y-expression.
Example:
Load Key, linest_seb(Y,X) as Z from abc.csv group by Key;
v. Financial Aggregate Function
This is the last QlikView Aggregate Function, let’s discuss its types:
a. irr(expression)
Returns the aggregated internal rate of return for a series of cash flows represent by the numbers in expression iterated over a number of records as defined by a group by clause. These cash flows do not have to be even, as they would be for an annuity.
However, the cash flows must occur at regular intervals, such as monthly or annually. The internal rate of return is the interest rate received for an investment consisting of payments (negative values) and income (positive values) that occur at regular periods.
The function needs at least one positive and one negative value to calculate. Text values, null values and missing values disregard.
Example:
Load Year, irr(Payments) as IRate from abc.csv
group by Year;
Let’s Explore QlikView Tables – Cross, Straight, Pivot, Mapping Tables
b. xirr (value expression, date expression )
Returns the aggregated internal rate of return for a schedule of cash flows (that is not necessarily periodic) represent by pair numbers in value expression and date expression iterated over a number of records as defined by a group by clause. All payments discount base on a 365-day year. Text values, null values and missing values in any or both pieces of a data-pair will result in the entire data-pair to be disregarded.
Example:
Load Year, xirr(Payments, PayDates) as Irate from abc.csv group by
Year;
c. npv (rate, expression)
Returns the aggregated net present value of an investment based on a discount rate and a series of future payments (negative values) and incomes (positive values) represented by the numbers in expression iterated over a number of records as defined by a group by clause.
The result has a default number format of money. The rate is the interest rate per period. The payments and incomes assume to occur at the end of each period. Text values, null values and missing values disregard.
Example:
Load Year, npv(0.05, Payments) as PValue from abc.csv group by Year;
d. xnpv (rate, value expression, date expression)
Returns the aggregated net present value for a schedule of cash flows (not necessarily periodic) represented by paired numbers in value expression and date expression iterated over a number of records as defined by a group by clause. A rate is the interest rate per period.
The result has a default number format of money. All payments discount base on a 365-day year. Text values, null values and missing values in any or both pieces of a data-pair will result in the entire data-pair to disregard.
Example:
Load Year, npv(0.05, Payments, PayDates) as PValue from abc.csv group by Year.
So, this was all about QlikView Aggregate Function. Hope you like our explanation
Conclusion
We have covered almost all of the QlikView aggregate function. As you must have noticed aggregate functions covers wide range of fields, from basic mathematical functions to statistical and financial. Practice and learn to use these functions by applying it on your data records.
If you have any doubts regarding QlikView Aggregate Function or want to know about more functions, let us know in the comment section below.
Related Topic – QlikView Publisher Repository (QVPR)
Did you like our efforts? If Yes, please give DataFlair 5 Stars on Google


How to do Correlation in Qlikview for Price & Qty. I Mean if i have 3 columns Sale to district, Rate/MT & Quantity sold and i want correlation between Rate/MT & Quantity sold. But the trick is i have same Rate/MT several time in the date i.e. rate of 500 Rs/MT for 3 times and with different quantity of sales say 10, 20,25 MT, what i want is the correlation should take into account this 500 Rate for One time only with qty. as 55(10+20+25). is it possible in Qlikview, if yes, what is the formula.