T test in QlikView – One Sample T test & Paired Sample T test
Job-ready Online Courses: Dive into Knowledge. Learn More!
In our earlier lessons, we learned about QlikView chi-square test of statistical chart wizard. Moving on, we are going to learn about one more such test which is T test in QlikView. In which, we will discuss One sample T test and Paired sample T test in QlikView.
So, let’s start QlikView T test Tutorial.
T test in QlikView – One Sample T test & Paired Sample T test
What is QlikView T test?
T test or also known as Student’s T test is the test which checks the variability in a data distribution. In other words, this test helps in checking whether our data sample deviates significantly from the mean of the previous observation by comparing the mean values of two observations.
T tests in QlikView can be of several types. In the QlikView statistical chart wizard, you the second option for tests is one sample T test or paired (dependant) sample T test in QlikView. T table use as a reference table to infer the results attained from the test.
Do you know What is Skewness in QlikView?
QlikView T-test – T-Table
One-Sample T test in QlikView
In the one sample T test in QlikView, the mean hypotheses check for one sample of data values based on a condition. This ultimately shows whether the mean of the observed value differs from the mean we expect or not.
i. Example of One Sample T-test
We have taken some sample data and framed two hypotheses based on a situation or assumption.
Situation: In class 12th of a school, the past records state that no student has got below grade B or 70%.
What the school’s administration wants to know from this test using the marks of the current year is that whether the assumption stated in the situation above is true for this year’s result or not?
The observation i.e. marks of this year load into QlikView and display in tabular form.
| Marks |
| 50 |
| 51 |
| 55 |
| 60 |
| 62 |
| 63 |
| 65 |
| 70 |
| 74 |
| 75 |
| 80 |
To do the test, open the Statistics Chart Wizard from the Tools menu in QlikView.
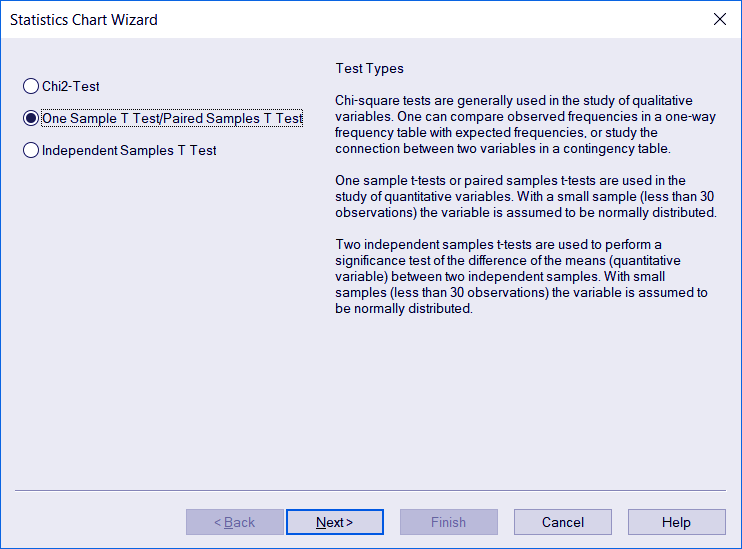
The Statistics Chart Wizard dialog will open. Select the One sample T test/Paired T test option. Click Next to continue. You will also find a brief description of the three test options given in the wizard.
We recommend you to learn – QlikView TIme Chart Wizard

QlikView One Sample T-test
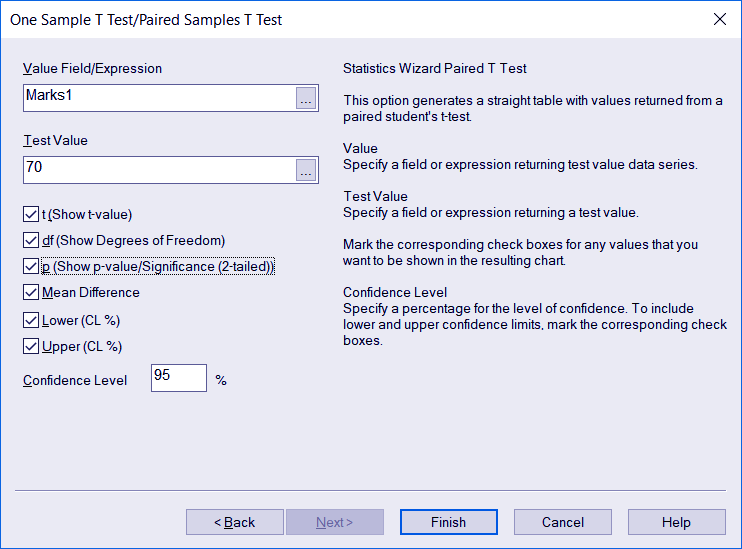
In the next step, a dialog appears where you need to enter the parameters to use in the T test in QlikView. As you can see in the screenshot below, we have selected ‘Marks1’ field in the Value Field option as it contains the observation values.
Next, we have set the test value to 70 because we want to see whether the current situation is the same or gone below 70. From other options given, you can check the boxes for the values you want to include in your T test result table. Click Finish to see the result.
T test in QlikView – QlikView One Sample T-test
Before we see and draw conclusions based on the values given in the table. We need to frame two hypotheses for this test too just like the chi2 test as this test is also a statistical hypothesis test.
The null hypothesis is that there is no change in the mean value of the current year’s marks and school’s credibility is still the same.
The alternative hypothesis is that, yes, there is a difference in the observed and expected value and the mean, as well as school’s credibility, has significantly decreased.
Now here comes the part where knowledge of skewness would help you. One sample T-test in QlikView can be done in two ways; one-tailed test (testing for positive or negative skewing) and two-tailed test (testing for both positive and negative skewing).
Do you know how to create a box plot in QlikView?
In this case, with the situation we have, we are doing a one-tailed test for negative skew because we are checking whether the mean has decreased.
T test in QlikView – One Sample T test & Paired Sample T test
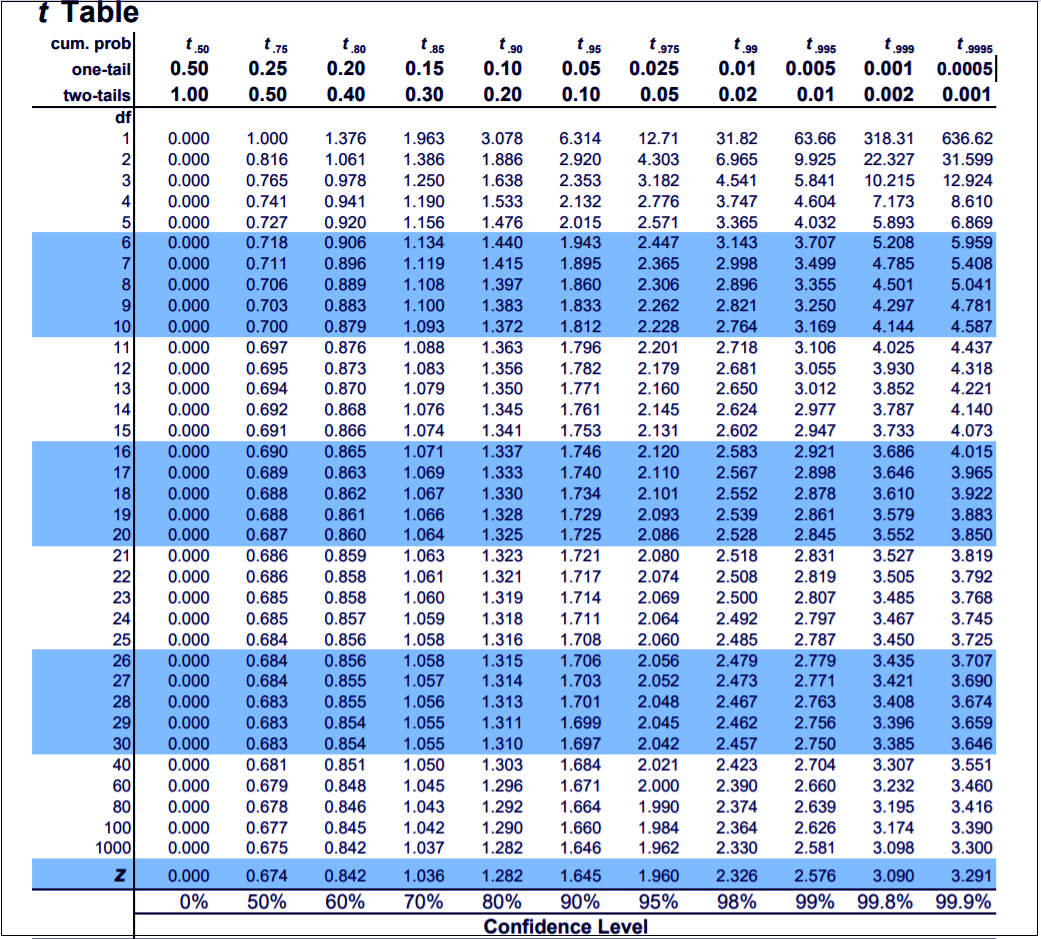
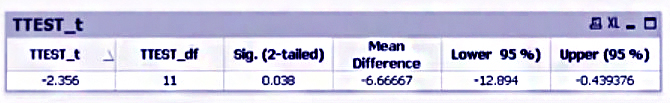
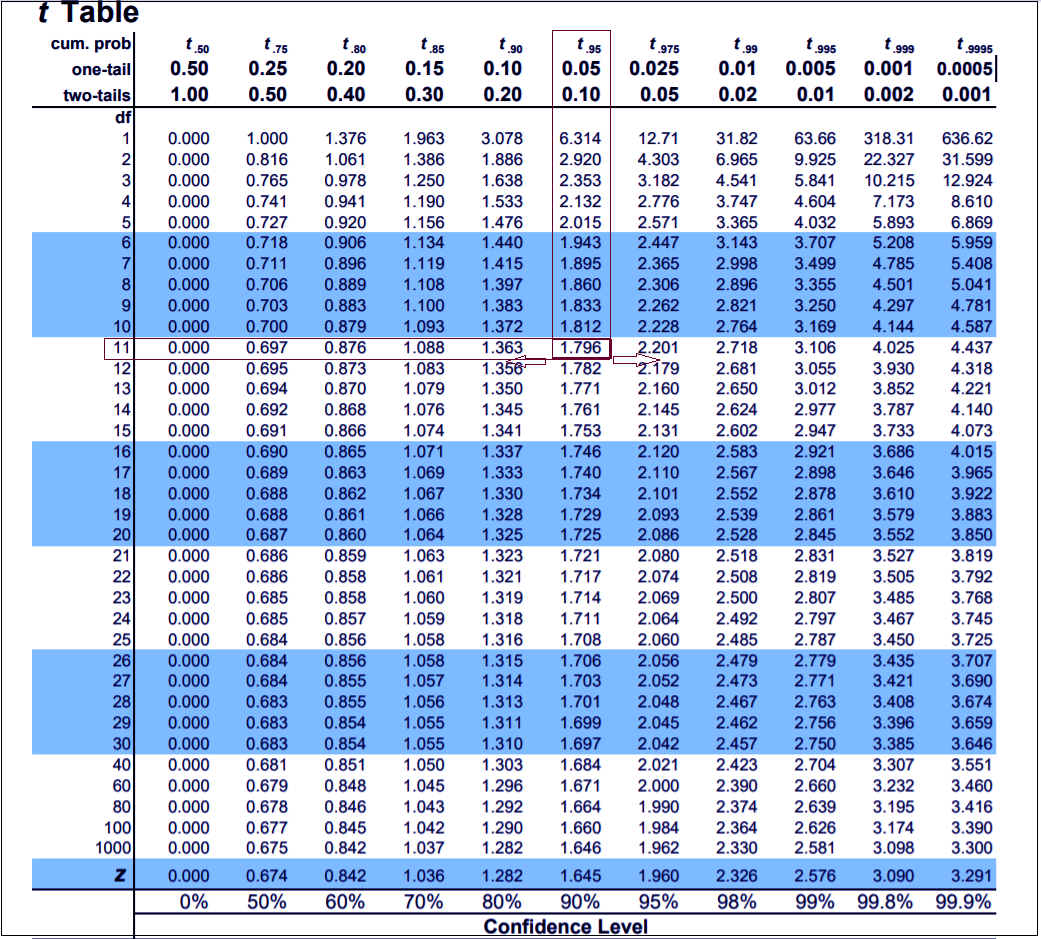
Looking at the T-test table above, we can comprehend that the T-test value is -2.356 and degree of freedom (df) which is total number of test values or observations, is 11. Using these two values, we can interpret the result. We will look at the T-table, select 11 as the df (row) and t.95, one-tailed (column). See the value that is coming at the intersection of the selected row and column. The value is 1.796. Now, another thing to keep in mind is that we are doing the test for negative skew or negative tail. So we consider the value as -1.796.
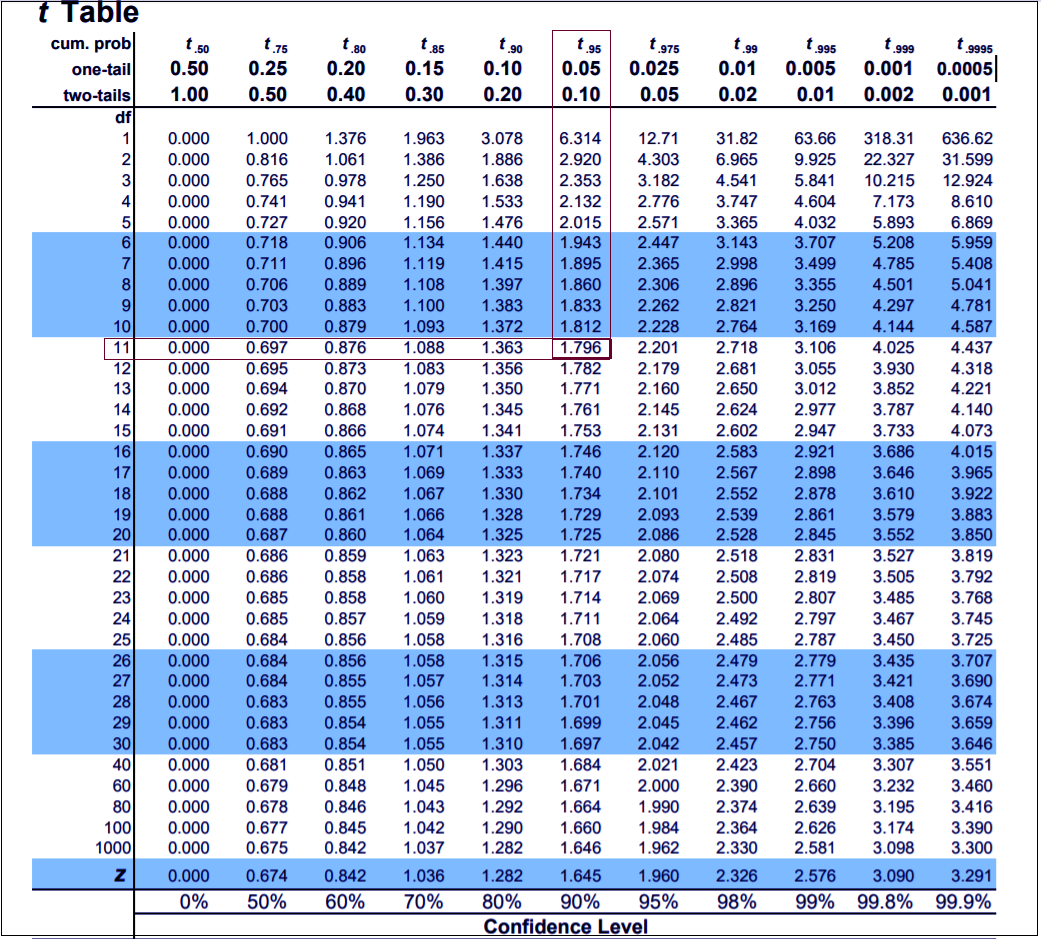
QlikView One Sample T-test – T-table
In this case, any value lesser than -1.796 will reject the null hypothesis and make the alternative hypothesis correct. And if the converse is true, i.e. if the value for T-test is greater than -1.796 then null hypothesis cannot reject.
In the test table, the T test value is -2.356 which is less than -1.796. Thus, the null hypothesis saying that the assumption is still true, and school’s credibility is intact, will reject. Rather the truth is that the mean of student’s marks or average marks has gone, taking down school’s credibility as well which was our alternative hypothesis.
Paired Sample T test in QlikView
A QlikView paired T test uses such sets of observations that are dependent on each other for the test to give a result. The two sets of observation must be about the same thing, person etc. This test is used primarily to see whether a particular factor has brought a change in data values or not.
Follow this link to know about QlikView Operators
In other words, to see if a factor is impactful enough.
i. Example of Paired Sample T test
Let us understand this by an example. The situation we have is,
A team of researchers want to find out whether studying continuously for long hours or studying with taking breaks brings any difference in the performance of the students? For this, they framed two scenarios,
Scenario 1: Students study for 6 hours straight and take the exam.
Scenario 2: Same students take a 10 minutes break after studying for 3 hours and then resume studying for another 3 hours and take the exam.
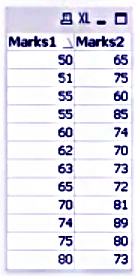
We will do a paired sample T test in QlikView to analyse the marks obtained in two scenarios. We have the list of marks obtained as ‘Marks1’ (marks obtained in scenario1) and ‘Marks2’ (marks obtained in scenario2).
T test in QlikView – Sample
We’ll open the Statistics Chart Wizard again and select the One sample T test/Paired sample T test option.
T test in QlikView – Paired Sample T test
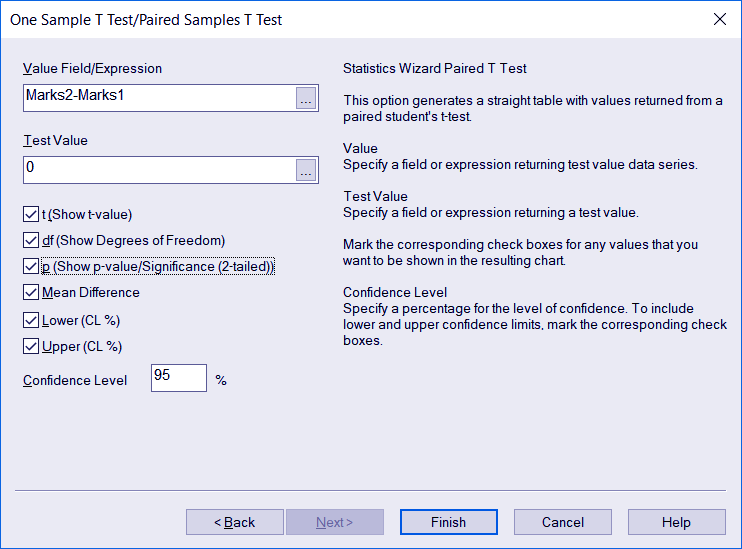
In the next step, we will enter the values we want as parameters for the test. We’ve put an expression i.e. ‘Marks2-Marks1’ because we want the difference analysed by the test. Next, we will mention no Test Value here because we simply want to test the difference between the two observations. Select other parameters from the list as you like and click Finish.
Value Field/Expression
Returns a test value series.
Test Value
Returns a test value.
T (Show t-value)
For including the t-value in the resultant chart.
Df (Show Degrees of Freedom) For including the df or Degrees of Freedom value in the resultant chart.
p (Show p-value / Significance (2-tailed)) For including the two-tailed p-value or significance in the resultant chart.
Mean difference
For including the mean difference value in the resulting chart.
Lower (CL%)
To set the lower limit of the level of confidence percentage.
Upper (CL%)
To set the upper limit of the level of confidence percentage.
Confidence Level
Specifies or sets the percentage for the level of confidence.
Have you know how to create & import Bookmarks in QlikView?
QlikView Paired Sample T-test
Now, let us frame our hypotheses.
First hypothesis or the null hypothesis will be, that taking a break between the study hours did not bring any change (or increased) the marks and the two scenarios are same.
The second hypothesis or the alternative hypothesis is, taking a 10 minutes break did improve the marks of students.
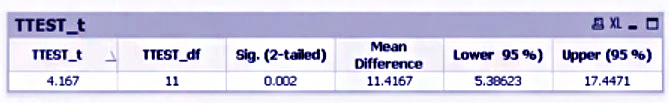
Pay attention here, now we have a positive skewed or right tailed situation as the marks are expected to increase, as opposed to what we dealt with in the One sample T test example. Upon producing the resultant table, we get a t test value, degree of freedom (df) and a few more values. But for our case, only t test value and df are important.
T test in QlikView – One Sample T test & Paired Sample T test
Now, to infer the result, we’ll refer to the T-table. 4.167 is out T test value and 11 is the df (total number of observations). Moving to the T-table what we need to do is select 11 in the df row and t.95 in the column and check the value at their intersection. The value is 1.796.
Now, if the T test value we got is greater than 1.796 then we will reject the null hypothesis and state that the alternative hypothesis is correct. And if the T test value is lesser than 1.796 then we will not reject the null hypothesis.
With our T test value being 4.167 which is greater than 1.796 we reject the null hypothesis that states that scenario 1 and scenario 2 have no difference. Rather, it goes to show that our alternative hypothesis. Which states that there is a significant difference between the two scenarios and taking a break have improved student’s performance is true.
QlikView Paired Sample T-test
So, this was all about T Test in QlikView. Hope you like our explanation.
Conclusion
Hence, we conclude our lesson on the two tests, which were one sample and paired sample T test in QlikView. The basic tests are the same which is the T test in QlikView. It just varies according to the sample data set that can test by the tests. The one sample test takes only one set of observation whereas the paired sample T test takes two sets of observation values.
Also, an important thing to keep in mind is that you must read the values in the T table according to the skewness it has. The results will not be accurate if you do not evaluate the results properly.
Furthermore, if you have any query, feel free to ask in the comment box.
Related Topic – QlikView Data Types
Did you like our efforts? If Yes, please give DataFlair 5 Stars on Google


