QlikView Table – Creating Cross, Straight, Pivot, Mapping Tables
Interactive Online Courses: Elevate Skills & Succeed Enroll Now!
In our last session, we discussed QlikView Autogenerate. Now, in this QlikView Table Tutorial, we are going to learn how to create: QlikView Cross Table, QlikView Straight Table, QlikView Pivot Table, and QlikView Mapping Table with an example.
So, let’s start the QlikView Table Tutorial.
QlikView Table – Creating Cross, Straight, Pivot, Mapping Tables
What is QlikView Table?
The most preferred way of representing data is in the form of a table. Apart from sheet object Table Box, which is a basic tabular representation of data. There are 4 types of QlikView table: pivot table, cross table, straight table and a mapping table. Such QlikView table enables data representation in their unique ways.
Do you know about How to Use QlikView Dimensions and Measures?
QlikView Cross Table
QlikView Cross Table is a table where the rows and column switch places. We have already seen this type of action in transformation wizard called Transpose but such tables are a bit different from that. In a cross table, the values of rows repeat themselves for each column value. A cross table can be created in File Wizard.
a. How to create a cross table in Qlikview with an example?
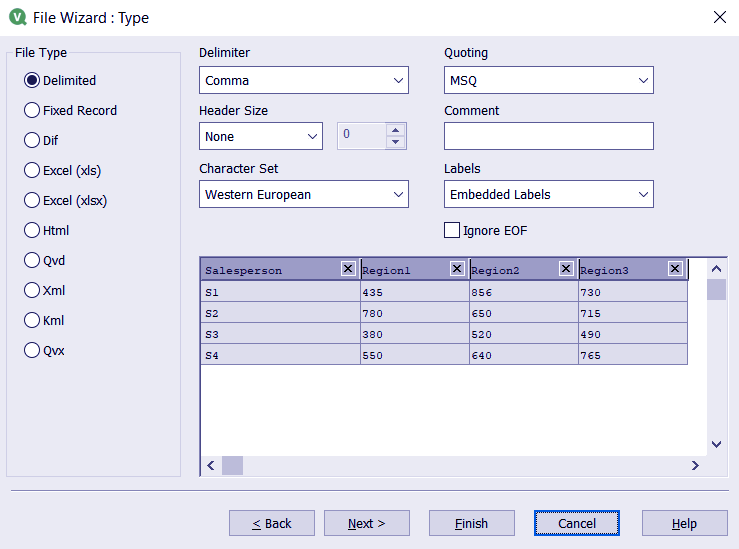
Load the data file in Qlikview’s memory. Here given is the data of four different salespersons and the sales done by them in three regions.
Salesperson,Region1,Region2,Region3
S1,435,856,730
S2,780,650,715
S3,380,520,490
S4,550,640,765
After opening the delimited file in the file wizard click on NEXT to carry further.
Step.1 QlikView Table – QlikView Cross Table
Enable the Transformation Wizard. Click on Next.
Now, you will see the file wizard window with an option of CROSSTABL Click on it. You will see the table columns highlighted in different colours.
Follow this link to know How to Create QlikView Dashboard.
Below you can make selections of parameters like a Qualifier field, which will be repeated with each value of the columns.
Next is Attribute Field, which will contain the different values of columns. The values in the attribute field are typed as data.
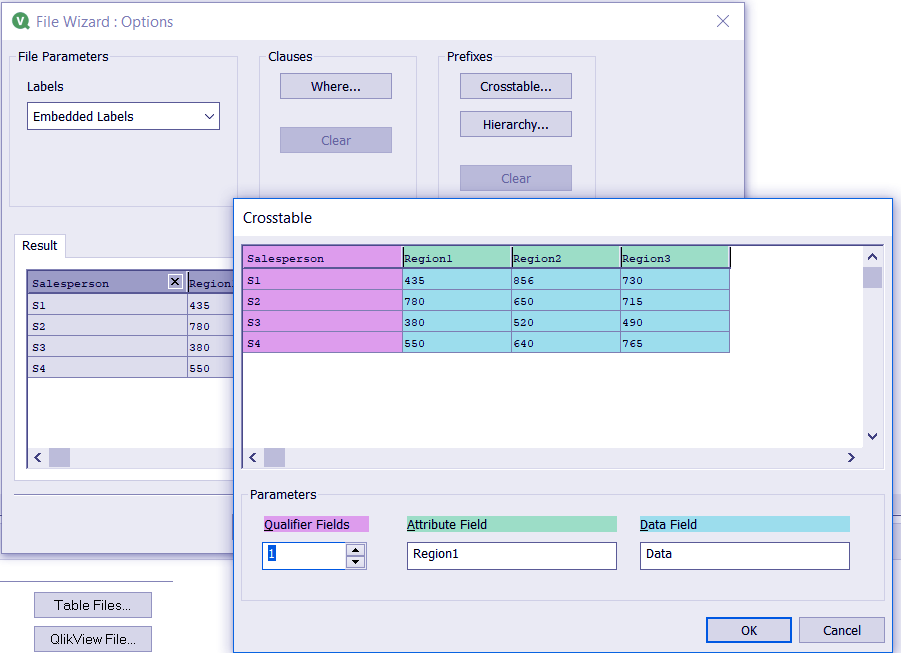
Step.2 QlikView Table – QlikView Cross Table
Click OK and the FINISH in the next window.
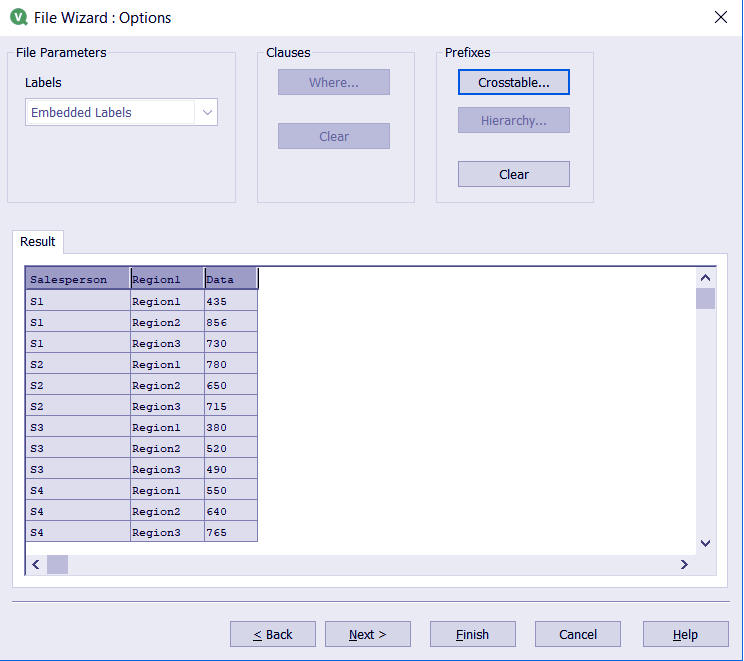
Step.3 QlikView Table – QlikView Cross Table
The script will be automatically loaded. Save it and reload it on the sheet.
CrossTable (Regional, Data)
LOAD Salesperson,
      Regional1,
      Regional2,
      Regional3
FROM
[C:\Users\HP\Desktop\Dataflair\crosstable.csv]
(txt, codepage is 1252, embedded labels, delimiter is ',', msq);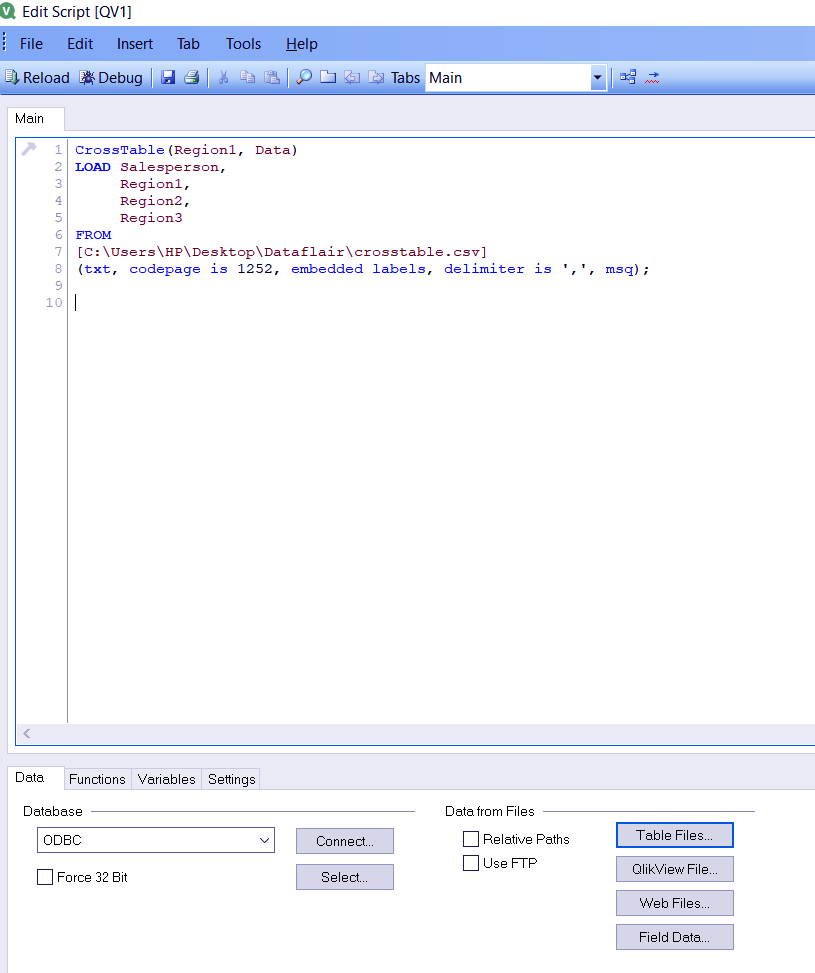
Step.4 QlikView Table – QlikView Cross Table
Read about – QlikView Bar & Pie Chart
Finally, to view the cross table, create a table box.
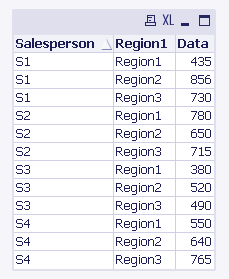
Step.4 QlikView Cross Table
In the final table, you can see that the sales values of all the three regions of every salesperson are displayed serially.
QlikView Straight Table
QlikView straight table is a basic tabular form of data representation. You can visualize your data in tabular form by creating it through a chart object. We have taken a data file ‘Product details’ to be viewed as a straight table.
Step.1 QlikView Table – QlikView Straight Table
a. How to create a straight table in Qlikview with an example?
Load a file from the script INSERT option.
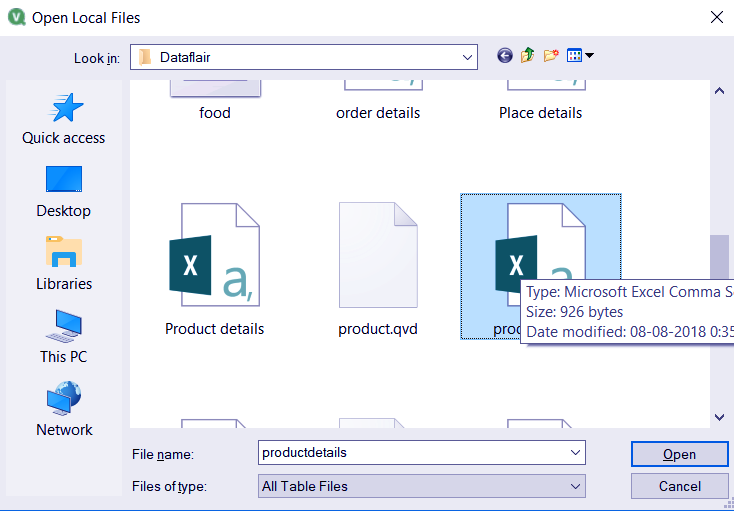
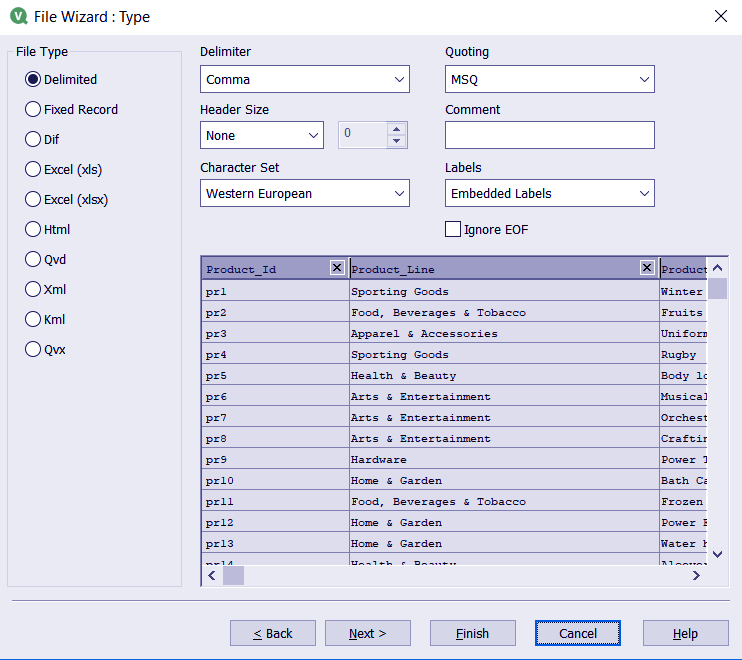
Step.2 QlikView Table – QlikView Straight Table
Choose Embedded Labels in the Labels column and a preview of your table can be seen.
Let’s revise the Difference Between QlikView and Tableau
Step.3 QlikView Table – QlikView Straight Table
As soon as you click on FINISH on the file wizard, the data will be loaded in the script.
LOAD Product_Id,
     Product_Line,
     Product_category,
     Product_quantity,
     Product_cost
FROM
[C:\Users\HP\Desktop\Dataflair\productdetails.csv]
(txt, codepage is 1252, embedded labels, delimiter is ',', msq);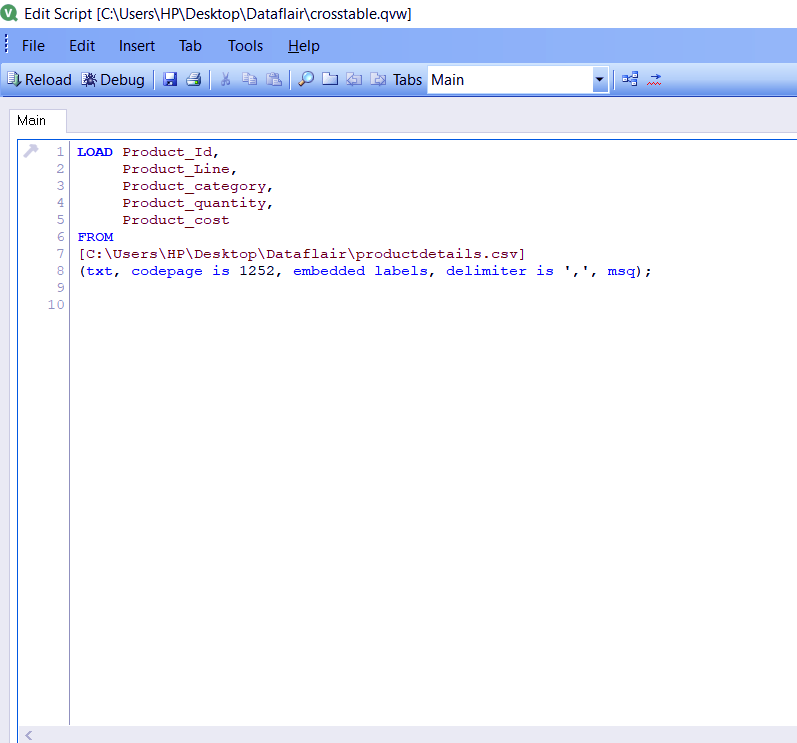
Step.4 QlikView Table – QlikView Straight Table
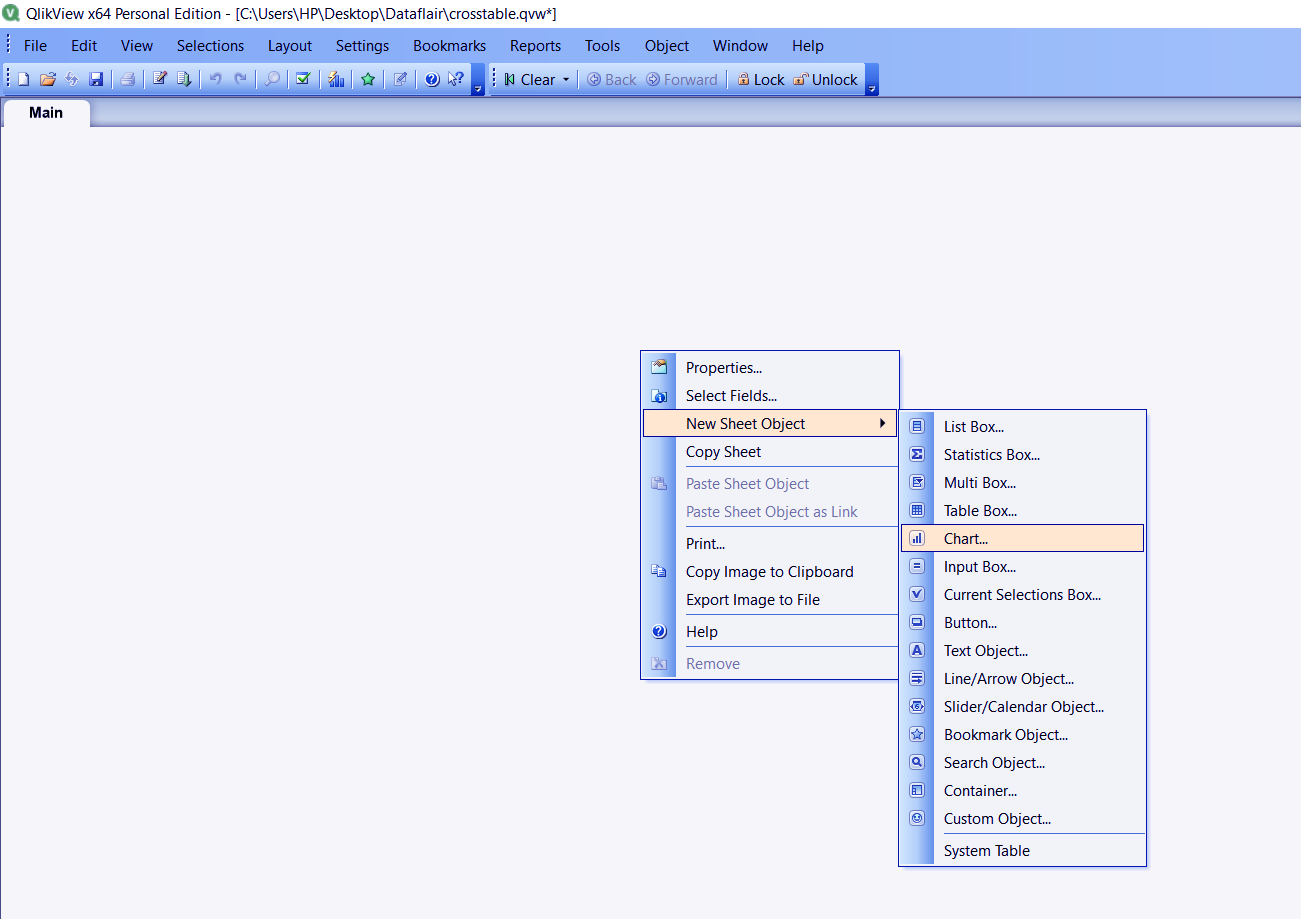
Save this file CTRL+S with a .qvw extension. Then reload it (CTRL+R). Right-click anywhere on the sheet and select New Sheet Object, then select Chart.
Step.5 QlikView Table – QlikView Straight Table
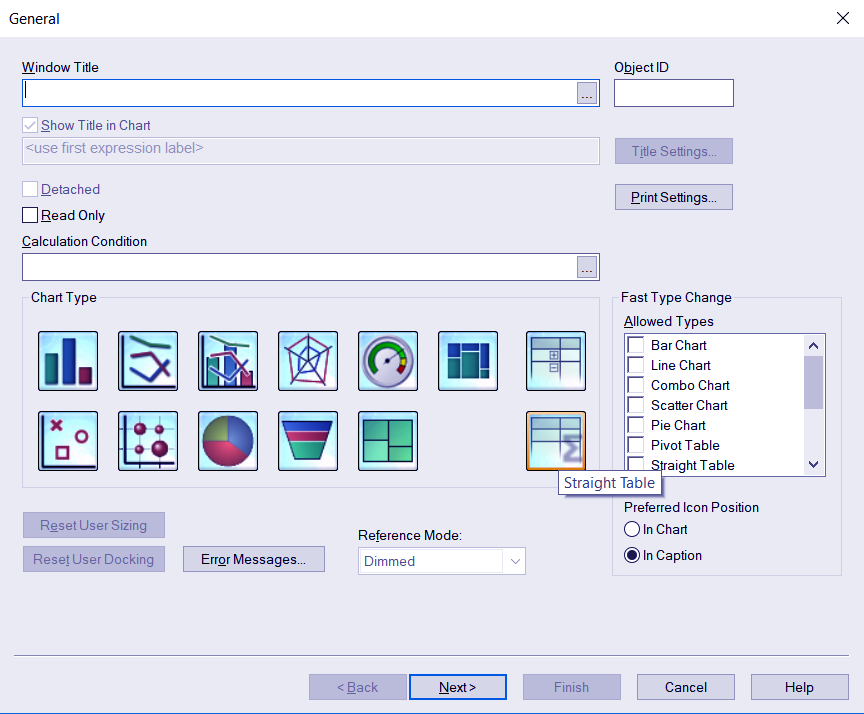
Select Straight Table as the chart type.
Step.6 QlikView Table – QlikView Straight Table
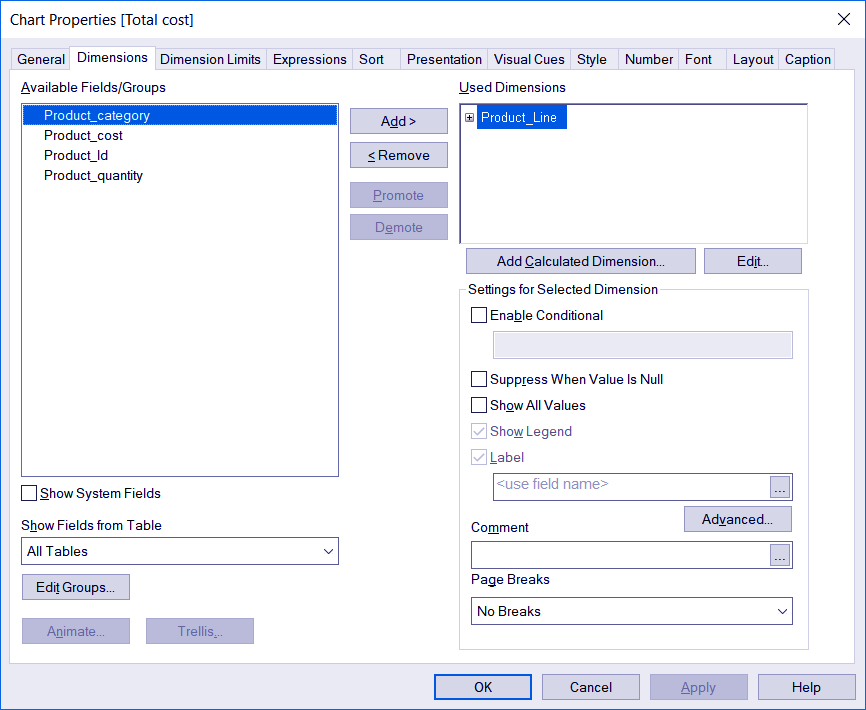
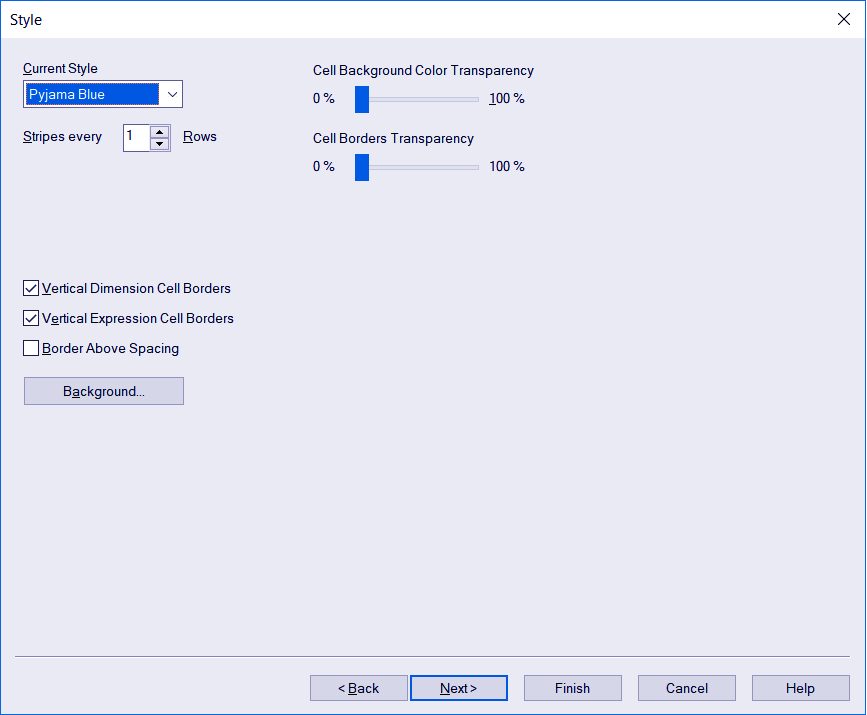
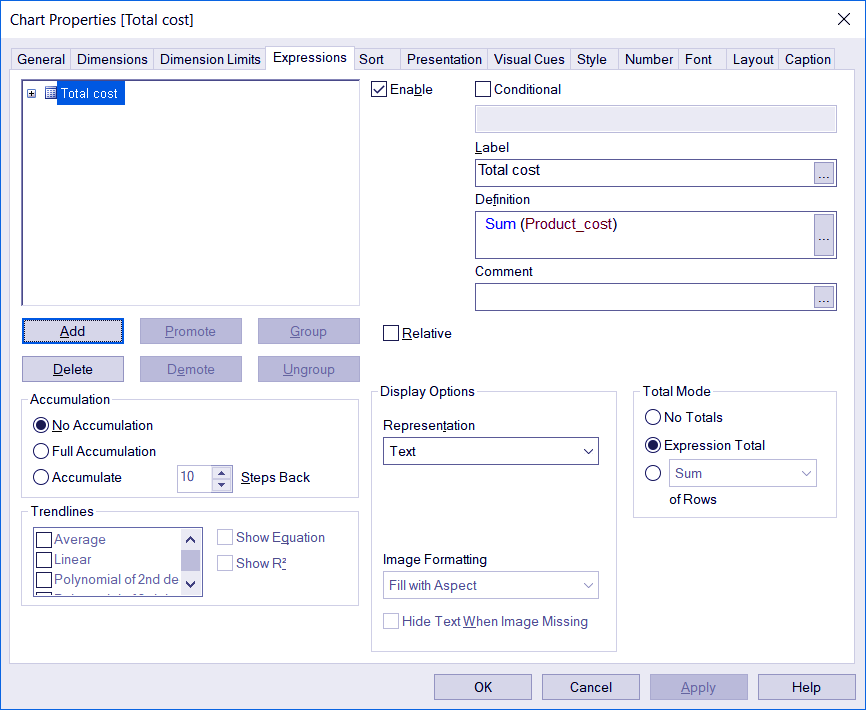
Add the dimensions of the table, style and choose an expression to be added to a measure (field) accordingly.
Let’s revise What is QlikView IntervalMatch & Match Function
Step.7 QlikView Table – QlikView Straight Table
Step.8 QlikView Table – QlikView Straight Table
Step.9 QlikView Table – QlikView Straight Table
Click FINISH in order to see the straight table with your data.
Do you know about Viewing Table in Star Schema Model
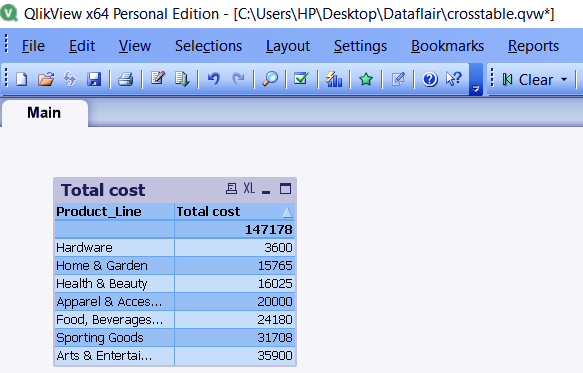
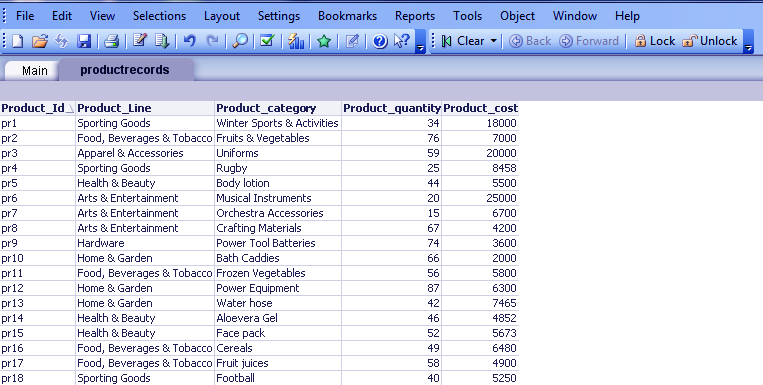
Step.10 QlikView Table – QlikView Straight Table
In the table been created, you can see that the sum of the cost of each product line has been done and displayed in the form of a straight table.
QlikView Pivot Tables
QlikView pivot table is used to show the sum of values across different dimensions in a table. The pivot table has a unique structure and has collapsible fields. The pivot Table can be created through the chart object.
a. How to create a pivot table in Qlikview with an example?
To show how to create the pivot table, we will use the same ‘product details’ file that we have used while making the straight table.
We will start with creating a Chart object. Select Pivot Table as the chart type.
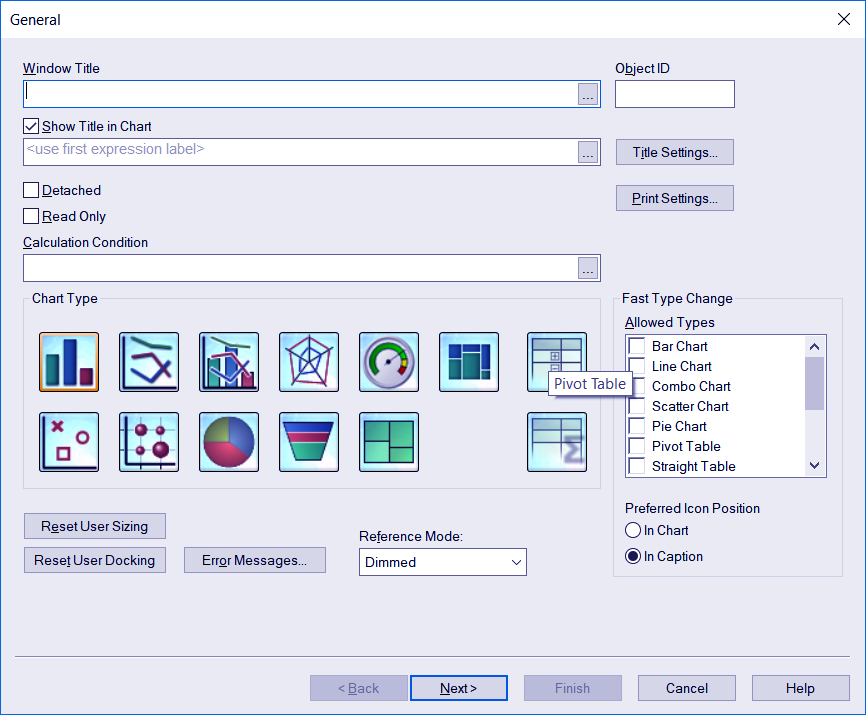
Step.1 QlikView Table – QlikView Pivot Table
Next step is choosing the dimensions. We have chosen product line and product quantity.
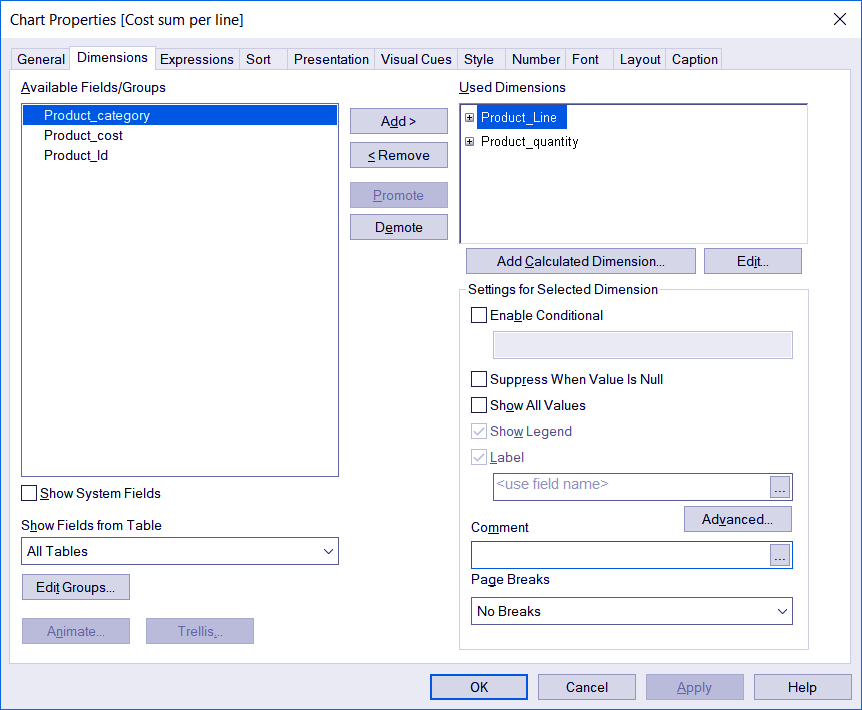
Step.2 QlikView Table – QlikView Pivot Table
Let’s discuss the Features of QlikView Script Editor
Add an expression to a field in the next step. We have applies SUM() function on the cost field. You can also give this expression a label to display.
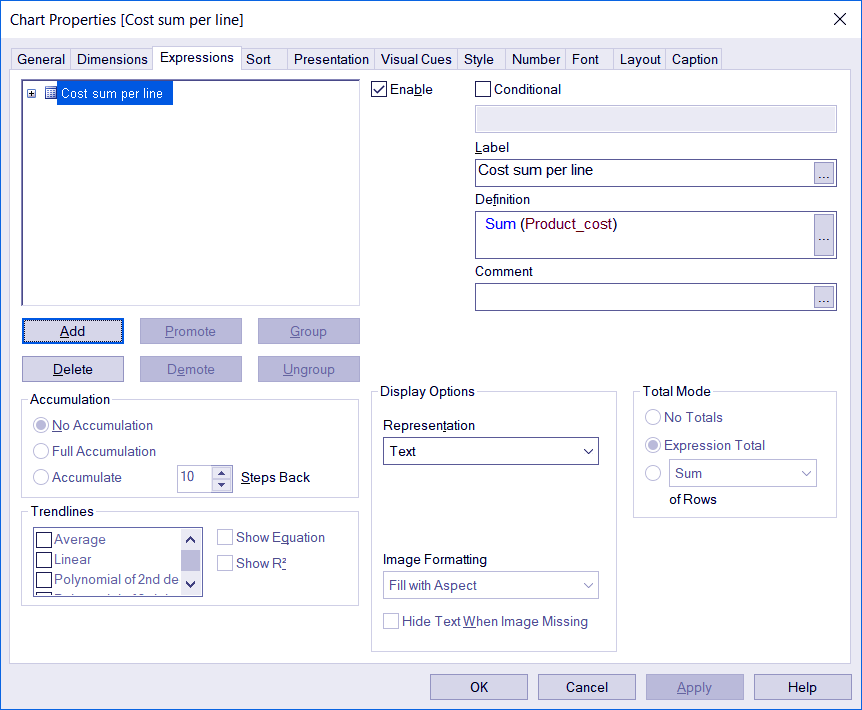
Step.3 QlikView Table – QlikView Pivot Table
Select the style of the table.

Step.4 QlikView Table – QlikView Pivot Table
And then click FINISH. You will have your pivot table ready.
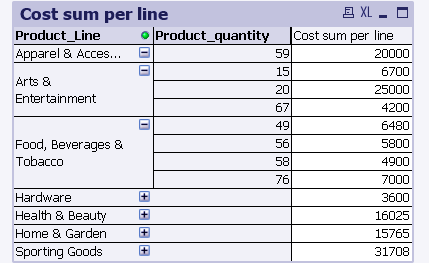
Step.5 QlikView Table – QlikView Pivot Table
Upon noticing the table, you will realize that each product line has a small plus sing with it. On clicking on that plus sign, opens up a new column in which the individual values of product quantities are given. In the third column, we have the sum of the cost of individual product lines.
Let’s study QlikView Database Connection & Inline data
QlikView Mapping Tables
In a QlikView mapping table, you can map or mirror a column or field from one table to another. The column that is to be mapped in a table must be related to an another (already existing) column in that table. The map tables are also called Lookup Tables as they are used to look up or search for relevant values in columns.
a. How to create a mapping table in Qlikview with an example?
To create a mapping table, load two tables from a source such that both of them have one column in common.
LOAD Product_Id,
     Product_Line,
     Product_category,
     Product_quantity,
     Product_cost,
     [Store Location]
FROM
[C:\Users\HP\Desktop\Dataflair\productdetails.csv]
(txt, codepage is 1252, embedded labels, delimiter is ',', msq);

LOAD [Store Location],
     [Store city]
FROM
[C:\Users\HP\Desktop\Dataflair\storelocation.csv]
(txt, codepage is 1252, embedded labels, delimiter is ',', msq);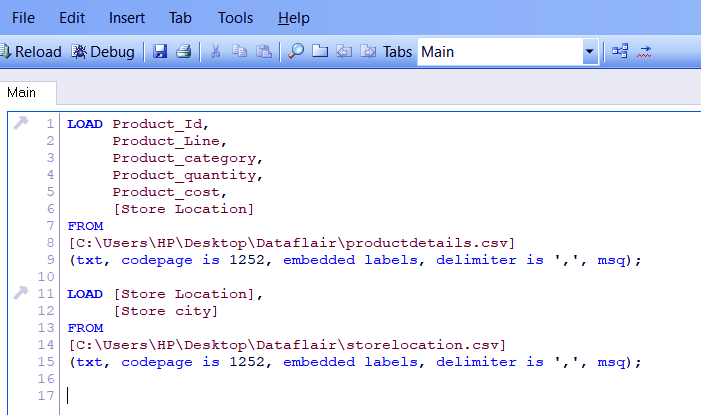
Step.1 QlikView Mapping Table
Now if we create the table boxes out of this loaded data, we can only create two separate tables with store location and city in a separate one.
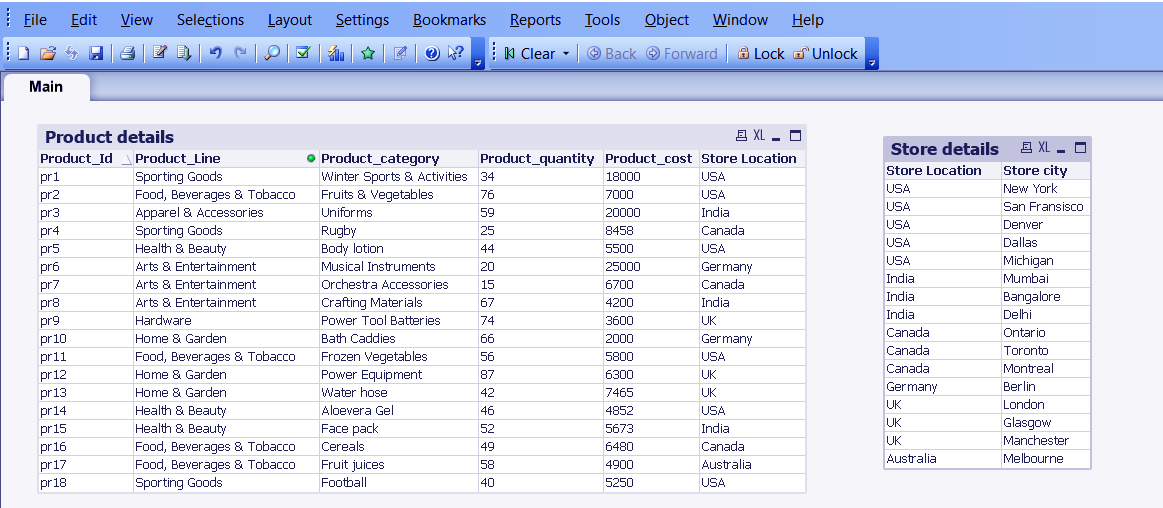
Step.2 QlikView Mapping Table
In order to map the ‘City’ column in the main table, some changes in the script code have to do and the Mapping function apply.
Have a look – QlikView Careers Opportunity
mapStoredetails:
Mapping LOAD [Store Location],
               City
FROM
[C:\Users\HP\Desktop\Dataflair\store .csv]
(txt, codepage is 1252, embedded labels, delimiter is ',', msq);

Productdetails:
LOAD Product_Id,
     Product_Line,
     Product_category,
     Product_quantity,
     Product_cost,
     [Store Location],
     ApplyMap('mapStoredetails', [Store Location],'Unknown') as City
FROM
[C:\Users\HP\Desktop\Dataflair\productdetails.csv]
(txt, codepage is 1252, embedded labels, delimiter is ',', msq);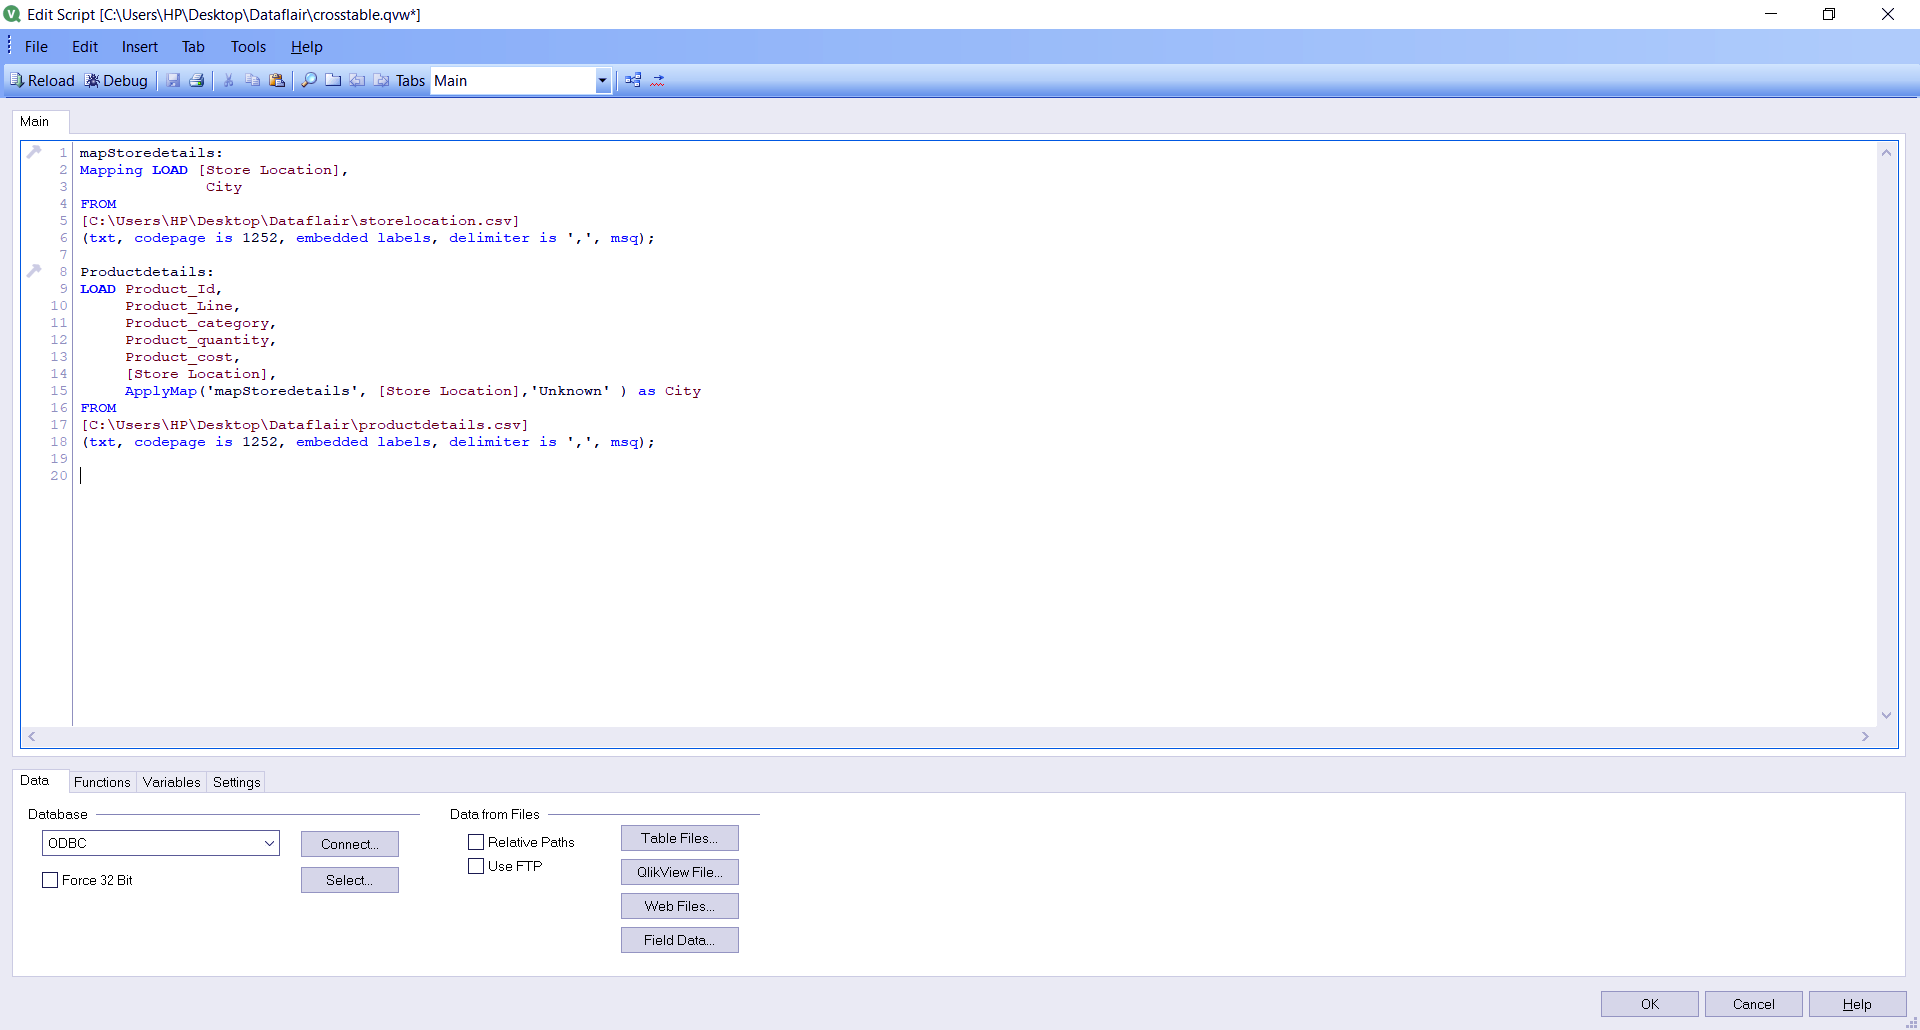
Step.3 QlikView Mapping Table
Save and reload this new script and create a table box to view the mapping.
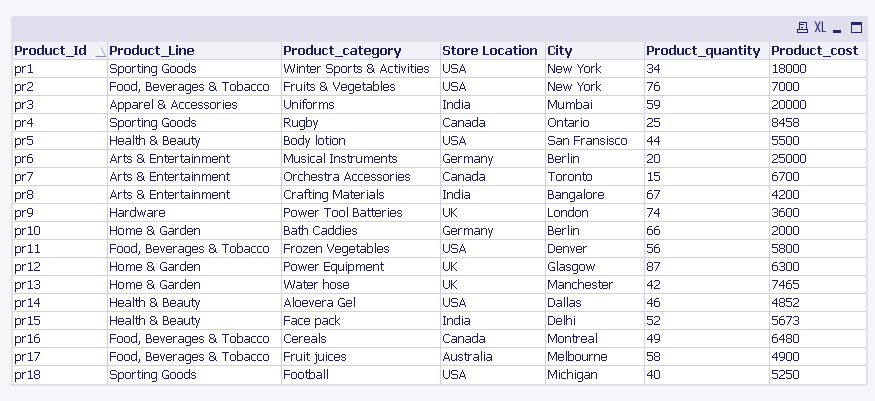
Step.4 QlikView Mapping Table
The table now has the column ‘City’ mapped onto the Product Details table.
So, this was all about QlikView Table Tutorial. Hope you like our explanation.
Conclusion
Hence, in this QlikView Table tutorial, we learned about four different kinds of tables namely Cross, Straight, Pivot and Mapping. What purpose they serve is quite evident by their names. We hope you had a hassle-free experience in understanding and creating these tables with us. In case of any queries or suggestions, do leave your comment below.
Related Topic – What are the QVD Files?
Did we exceed your expectations?
If Yes, share your valuable feedback on Google


