QlikView Time Chart Wizard – 9 Simple Steps to Create Time Charts
Job-ready Online Courses: Dive into Knowledge. Learn More!
In our last session, we discussed QlikView Trellis. Now its time to explore QlikView Time Chart Wizard. Moreover, we will learn how to create time charts using qlikView time chart wizard.
The Tools menu in the menu bar provides several chart wizards which are very easy and convenient to use. The wizards also instruct the user as to what to do in a certain step in the process of creating a chart.
So, let’s start the QlikView Time Chart Wizard Tutorial.
What is Time Chart Wizard in QlikView?
QlikView Time Chart Wizard is used to compare a set of data over a certain period. There are options available for time periods like year wise, month wise, quarter-wise (four months), week wise, lunar week wise and day wise. The wizard guides the user step by step in making the time chart in QlikView.
You can get enough information on every option provided in a wizard step. The time chart will have five fields, namely, dimension (selected by you), a period field for comparison, another period field for comparison, change the field and change% field.
Do you know How to Create QlikView Bar, Pie Chart & Text Box?
This gives a complete analytical record for change occurring in the data over a period. You can see, the change value that prefix by a plus or minus sign indicates an increase or decrease in the data values in that interval of time. The change percentage shows the difference in two data values as a percentage (indicated by – or +).
This is very useful when you are comparing data values related to sales. The change and change percent will show the profit (+) or loss (-) in sales over time.
How to Create a Time Charts Using QlikView Time Chart Wizard?
In this section, we will create a time chart using the time chart wizard in QlikView. We are using sample data which has three fields; Date, Sales and Products. The dates start from 1st of January 2017 and extend to 20th of September 2018. The sales field shows the sales done each day and Product field has the product number (1,2,3,4) of the product that has been sold. A piece of the whole data set is shown in the image below.
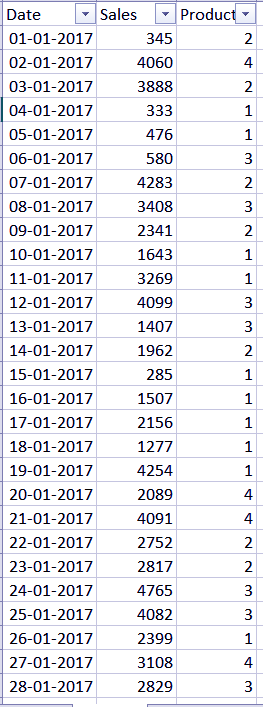
Sample
i. Step One
Go to the Tools menu in the menu bar and select Time Chart Wizard.
ii. Step Two
The Time Chart Wizard will open with the first dialog being introductory listing the steps that will be followed by the wizard.
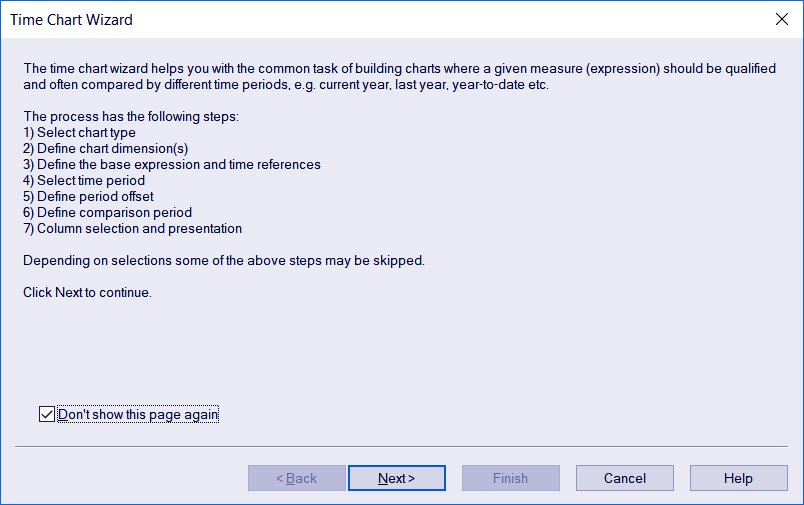
Creating Time Charts Using QlikView Time Chart Wizard
Read about – QlikView Autogenerate
iii. Step Three
Select chart type. Which is actually the first step of the wizard. It is titled Select chart type where you get to select from three available chart types i.e. Straight table, Pivot table and Bar chart in that order. Make a selection and click Next to move on.
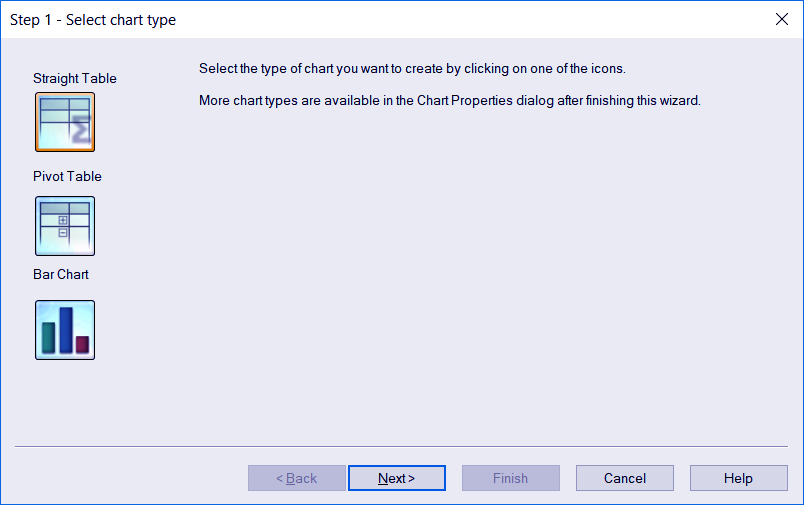
Step.1 Creating a Time Charts Using QlikView Time Chart Wizard
iv. Step Four
Define dimension(s). In this step, you can enter the dimension(s) or field(s) from the list of dimensions. You can enter up to three dimensions.
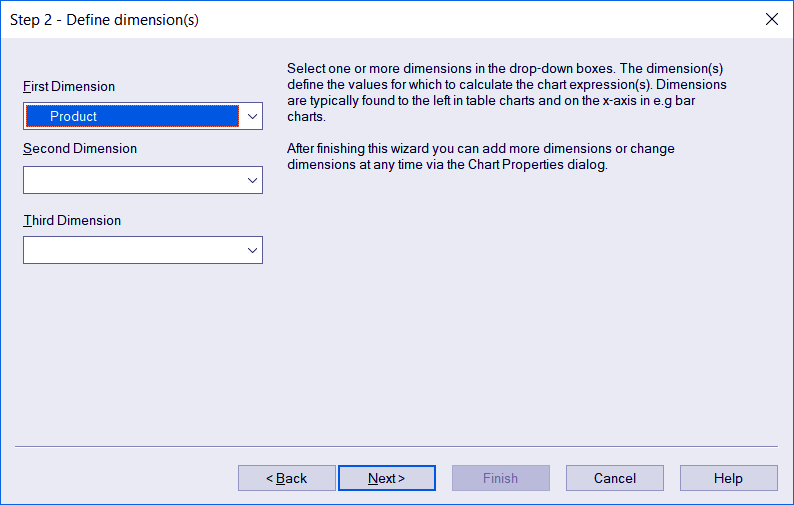
Step.2 Creating a Time Charts Using QlikView Time Chart Wizard
Follow this link to know about QlikView Chart Expressions
v. Step Five
Expression and time references. In this step, you will have to enter a Base Expression like the condition you enter in every other type of chart. We have done the sum of sales to get the total sales. The expression is applied on the measure you want to compare and analyse.
The second blank is the Timestamp Expression in which you indicate a time related field like a date field. The Basedate Expression is usually kept unchanged
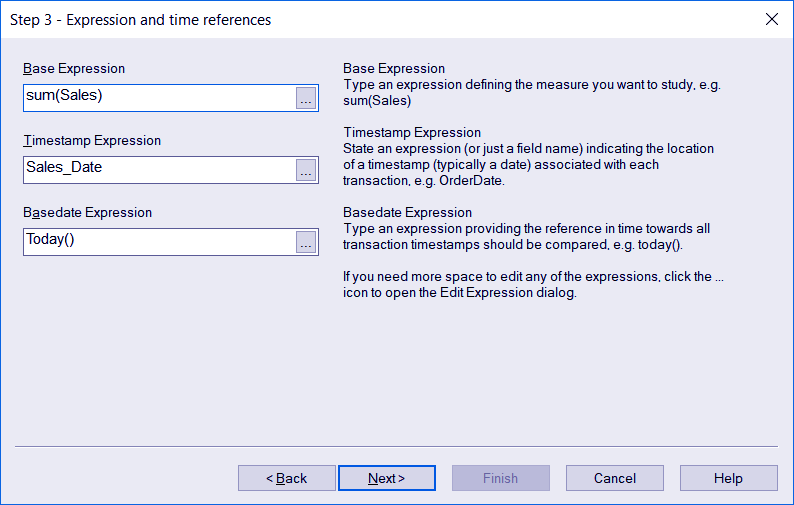
Step.3 Creating a Time Charts Using QlikView Time Chart Wizard
vi. Step Six
Select time period. Here, you will have to select the time period over which you want to compare the dimensions and measures you entered in previous steps. You can choose from Year, Quarter, Month, Week, Lunar week and day. You can select the number of months as well.
Below this list is given an option of To Date Mode, through which you can instruct the system to consider the dates only till the current date.
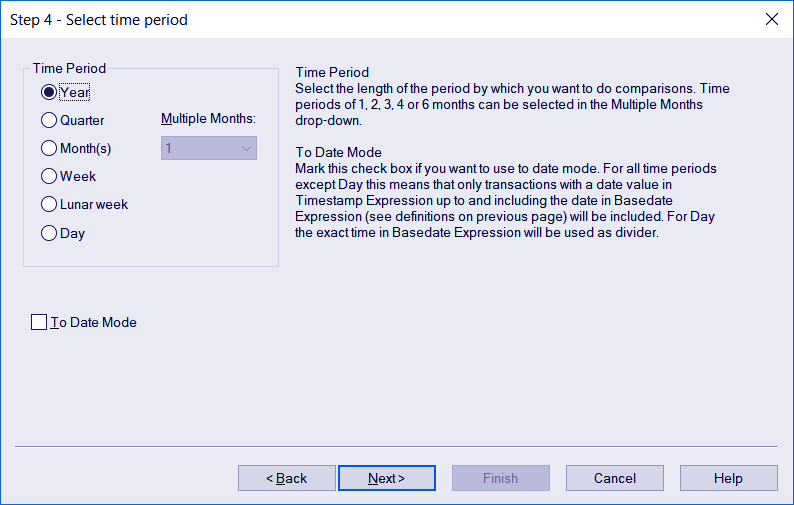
Step.4 Creating a Time Charts Using QlikView Time Chart Wizard
vii. Step Seven
Period start offset. In this step, you can select the starting month of the yearly analysis. If you consider a different cycle of a fiscal year, you can change the fiscal year start month accordingly.
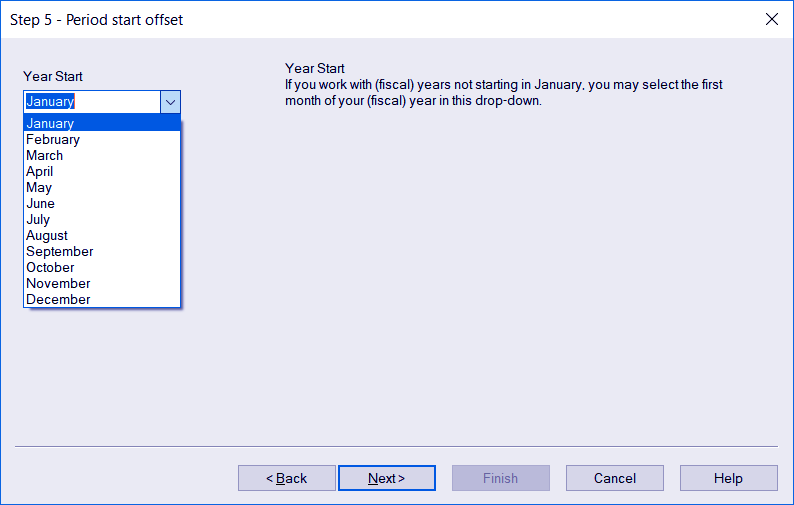
Step.5 Creating a Time Charts Using QlikView Time Chart Wizard
Do you know How to import and remove QlikView Bookmarks?
viii. Step Eight
Define comparison period. In this step, you can define whether you want the selected time period be yearly (pervious and current year’s month, quarter etc. like between a month from 2017 and 2018) or periodic (subsequent periods from the same year, like two months of the same year). The result of the comparison changes a great deal depending on the choice being made.
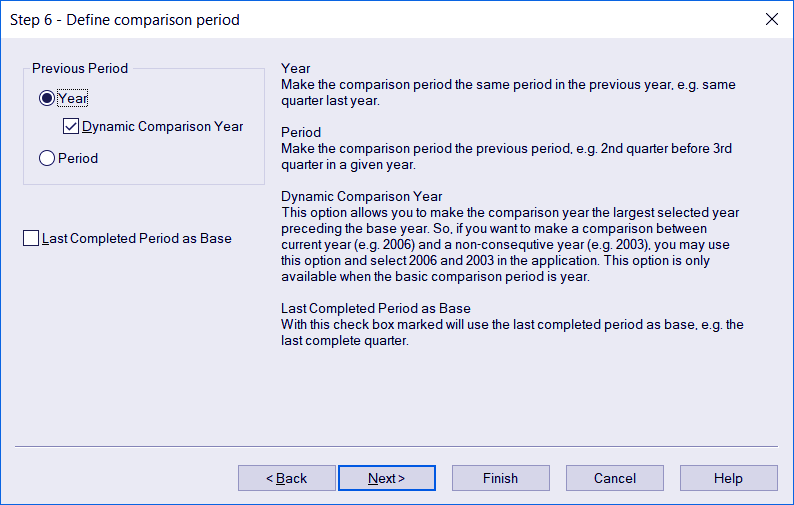
Step.6 Creating a Time Charts Using QlikView Time Chart Wizard
ix. Step Nine
Column selection and presentation. This being the last step of the wizard lets you select the columns you want to be displayed in the final time chart. Click Finish to end the wizard.
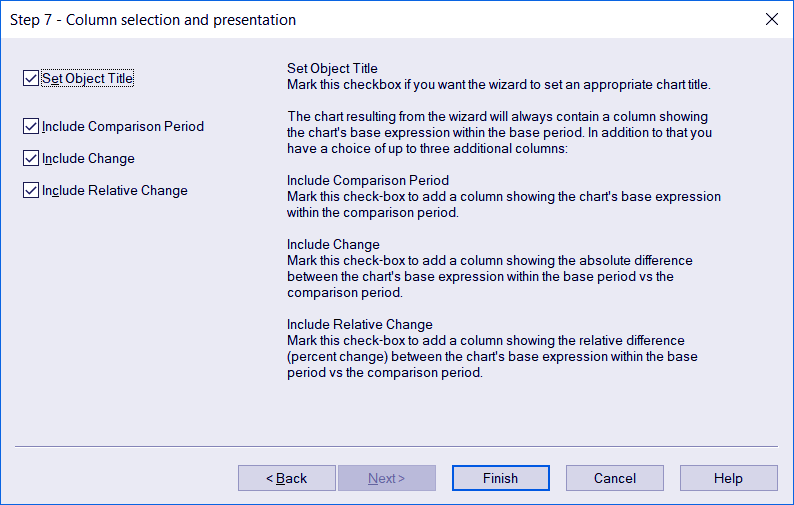
Step.7 Creating a Time Charts Using QlikView Time Chart Wizard
We have made four time charts using a QlikView time chart wizard using the sample data on sales. The four charts compare data sum of sales of each product over four different time periods, which are, Year, Quarter, Month and Week. We have also added list boxes for all the dimensions like years in use, four quarters, months, weeks and products.
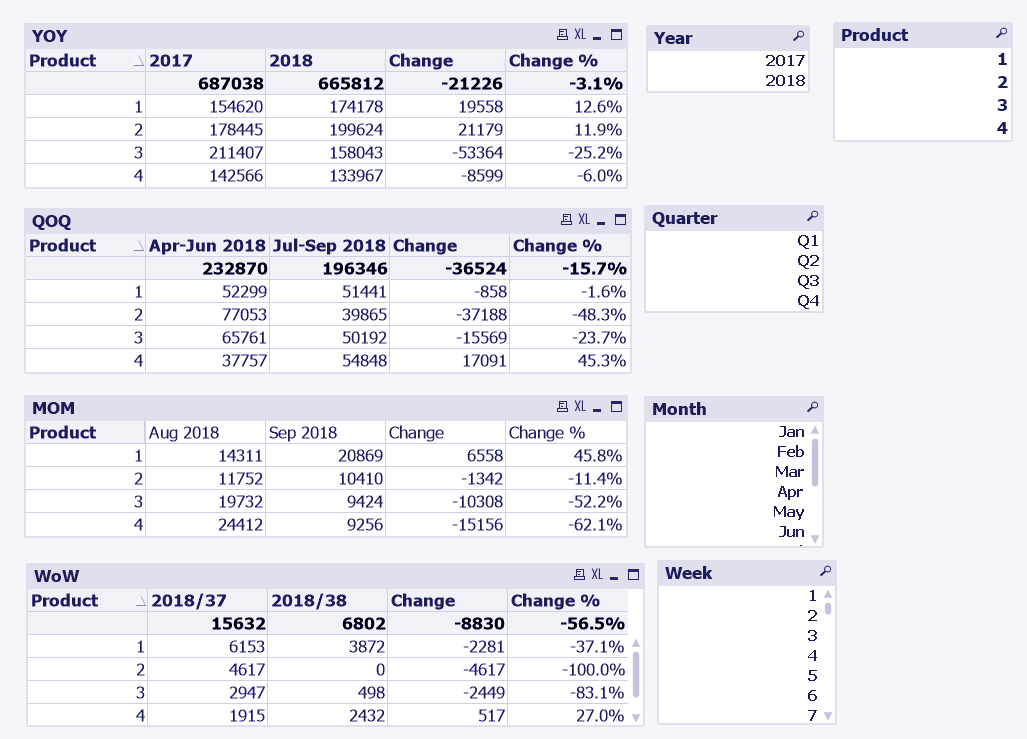
Creating a Time Charts Using QlikView Time Chart Wizard
How to Apply QlikView Layout Themes?
These time charts also follow association. You can select each product (from 1, 2, 3 and 4) to narrow the comparison on just that product.
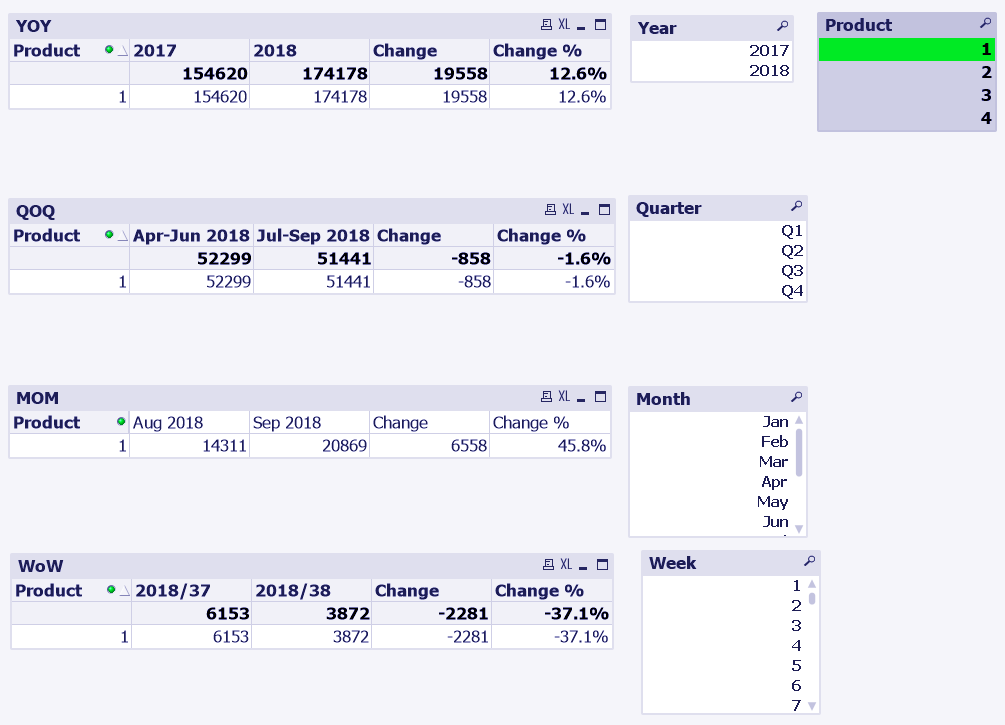
Creating a Time Charts Using QlikView Time Chart Wizard
You can also create a time bar chart for the same settings or convert the existing into a bar chart to see the values and conduct a comparative analysis using the graphical representation.
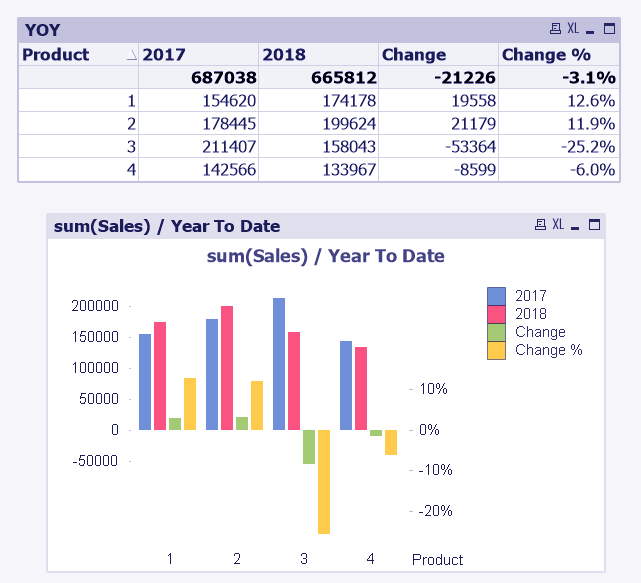
Creating a Time Charts Using QlikView Time Chart Wizard
So, this was all about QlikView Time Chart Wizard. Hope you like our explanation.
Conclusion
Hence, it can be said that Time chart wizard and time chart in itself is a very useful and time-saving feature of QlikView. You can conduct comparative analysis and draw meaningful insights out of data spread over a vast period of time. Furthermore, if wanna ask something, feel free to approach us through comment section!
Also, Read – QlikView Simple Network Management Protocol
You give me 15 seconds I promise you best tutorials
Please share your happy experience on Google


