QlikView Dimensions and Measures – How to Use & Create
Expert-led Courses: Transform Your Career – Enroll Now
In our last session, we discussed QlikView Dashboard. Now, we are going to explore QlikView Dimensions Tutorial, in which we study how to use QlikView Dimensions and Measures.
So, let’s start QlikView Dimensions and Measures.
QlikView Dimensions and Measures – How to Use & Create
Define – QlikView Dimensions & Measures
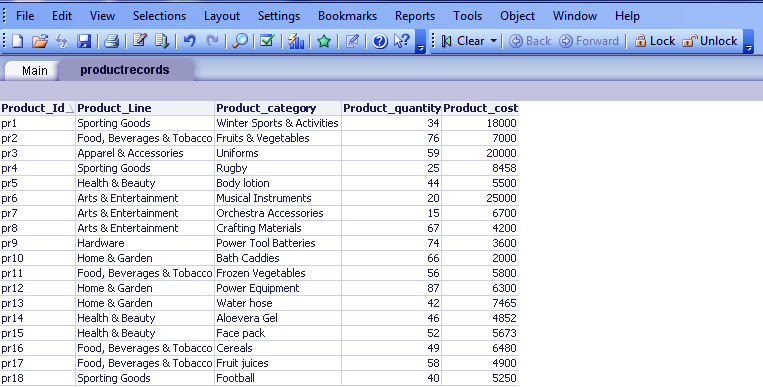
Every time you work with data in a tabular form, you are dealing with dimensions and measures in one way or the other. In our sample data of product records having fields like Product ID, Product Line, Category, Quantity and Cost.
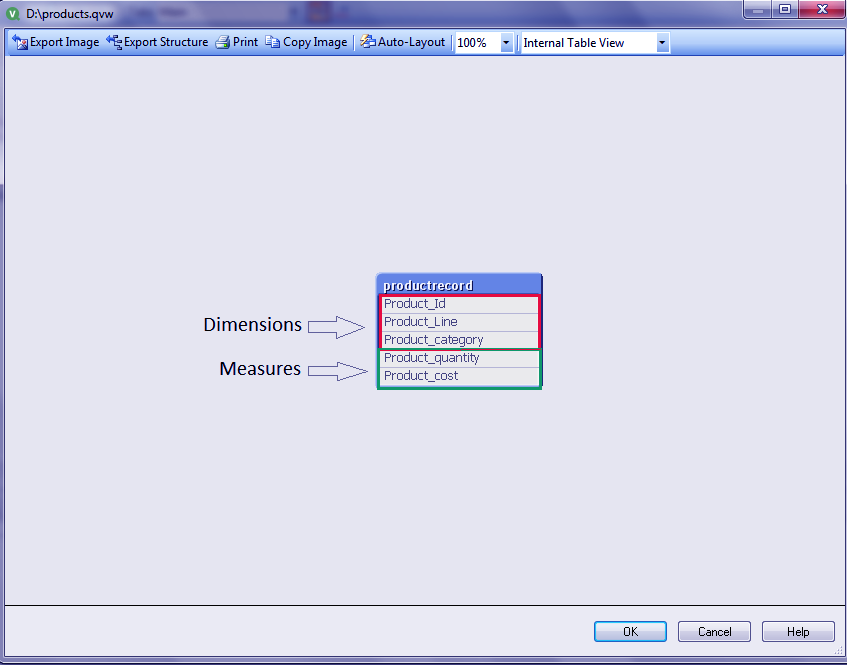
QlikView Dimensions – The fields with informative values like ID, line, category are called Dimensions. Dimensions are always descriptive text values.
QlikView Measures – The fields upon which calculations can perform like Product cost and quantity are called Measures. Measures are always a calculated result of the values of dimensions or field. In a broad sense, Measures are numerical values upon which mathematical calculation can perform.
Do you know How to Create QlikView Bar, Pie Chart & TextBox?
How to Use Dimensions & Measures in QlikView?
We deal with QlikView measures and dimensions every time we work with data sets, make tables, charts etc. Knowing the concept of QlikView dimensions and measures will make dealing with various kinds of information during data analysis easy.
Let us elaborate our point by creating a straight table chart using the data file product records.
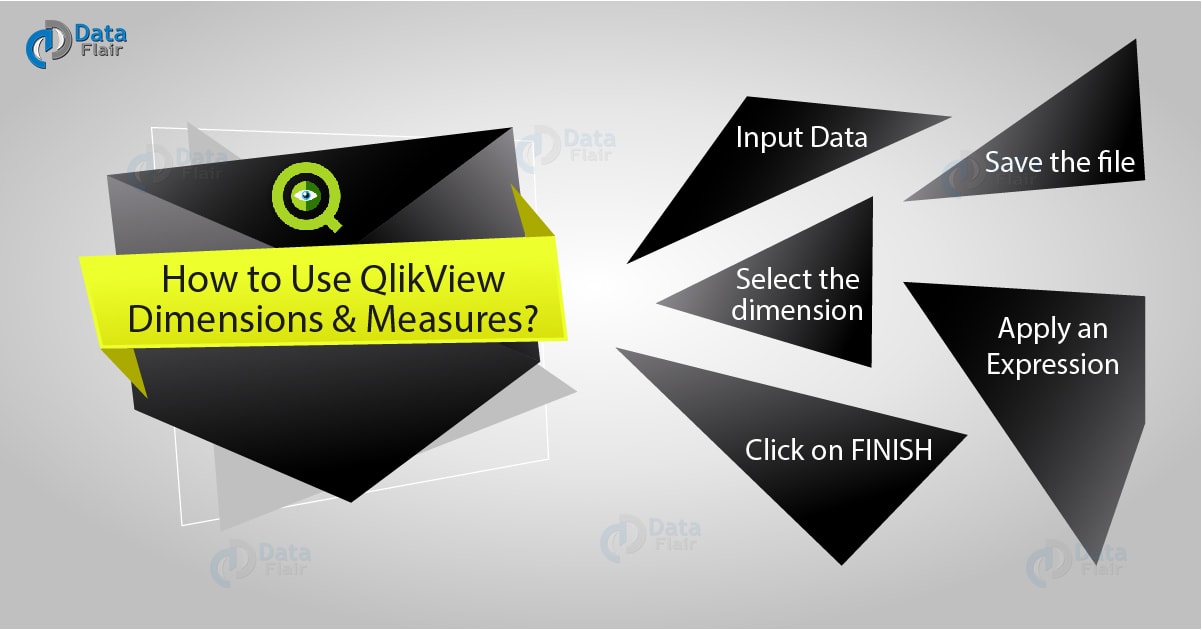
Step.1 Input Data
Load the script in the memory of Qlikview.
QlikView Dimension and Measures
We can view the table fields in table view by pressing CTRL+T in the script editor. Here we can clearly distinguish between QlikView dimensions and measures.
Step.1 Input Data
Let’s read the Difference between QlikView and Tableau
Step.2 Save the file
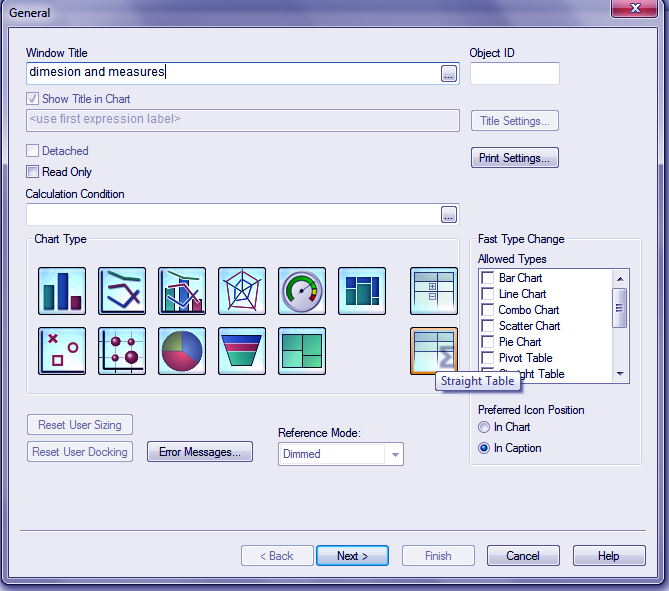
Now, save the file in .qvw extension and reload the script with the icon or CTRL+R. Create the CHART sheet object and select STRAIGHT TABLE chart type.
Step.2 Save the File
Step.3 Select the dimension
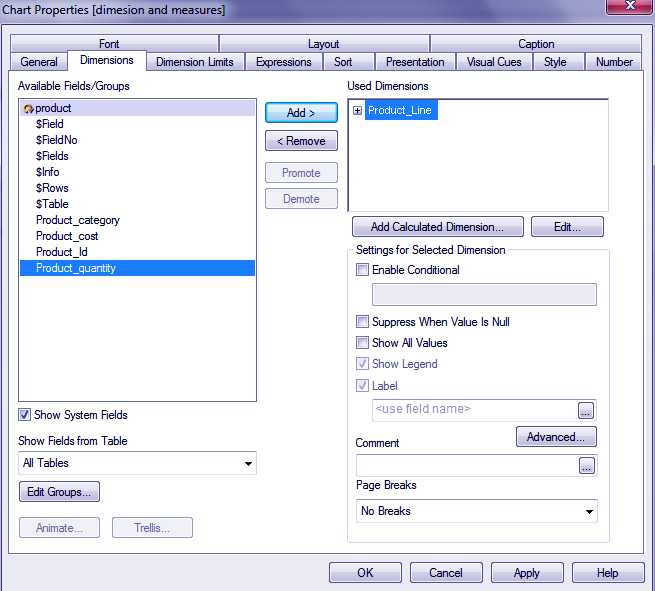
Step.3 Select the Dimension
Do you Know How QlikView Works(QlikView Architecture)?
Step.4 Apply an Expression
The function or expression will apply to a field that is classified as a measure.
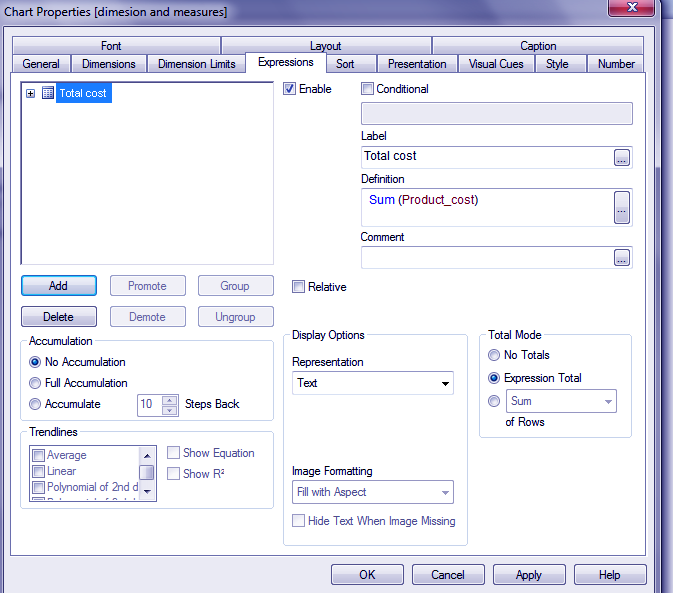
Step.4 Apply an Expression
Step.5 Click on FINISH
Click > Finish to see the final result i.e. a straight table. This table shows the sum of cost of distinct product lines along with the sum of total revenue made.
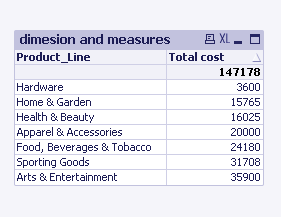
Step.5 Click on FINISH
So, this was all about QlikView Dimension and Measures Tutorial. Hope you like our explanation.
Conclusion
Hence, we studied QlikView Dimensions and Measures are very important and fundamental entities. Moreover, we covered how to use dimensions and measures in QlikView. For more QlikView Tutorial, stay tuned and share your feedback with us!. We will definitively get back to you.
Related Topic – QlikView Navigation Pane
For reference
If you are Happy with DataFlair, do not forget to make us happy with your positive feedback on Google


After step 5, can I edit the resulting straight table, and will those edits also update the source table (shown in step 1)??
For example, can I change the Hardware from 3600 to 9500, and will that also automatically change the source table, from 3600 to 9500?