QlikView Set Analysis – How to Define Concatenate in QlikView
FREE Online Courses: Knowledge Awaits – Click for Free Access!
Now that we have gained a fundamental knowledge of creating and viewing different kinds of sheet objects in QlikView. We will now learn about some table manipulation functions called QlikView Set Analysis and Concatenation. Moreover, we will discuss set analysis expression and how to apply the QlikView set analysis function. Along with this, we will cover different types of QlikView concatenation.
These functions prove to be very practical and time-saving when you work with huge amounts of data and complex tables.
So, let’s start QlikView Set Analysis and concatenation.
What is QlikView Set Analysis?
QlikView set analysis is a way of sorting and arranging data into different sets in the form of sheet objects. The name set analysis is given because it provides better ways of analyzing any given data set by segregating and structuring the data into tables and charts. The QlikView set analysis provides a context of analysis to a pre-defined or selected set of data.
You can also turn off the association of a table with other so that it doesn’t change its values upon making a selection on other tables. As we have seen in the ‘Dashboard’ tutorial and several others, that every QlikView document and every sheet by default operates as per the associative model of data.
During the QlikView set analysis, you have the option of deactivating the association between tables and change the dynamic relationship between them into a static one.
Do you know What is QlikView Directory Service Connector (DSC)?
QlikView Set Expression and its Components
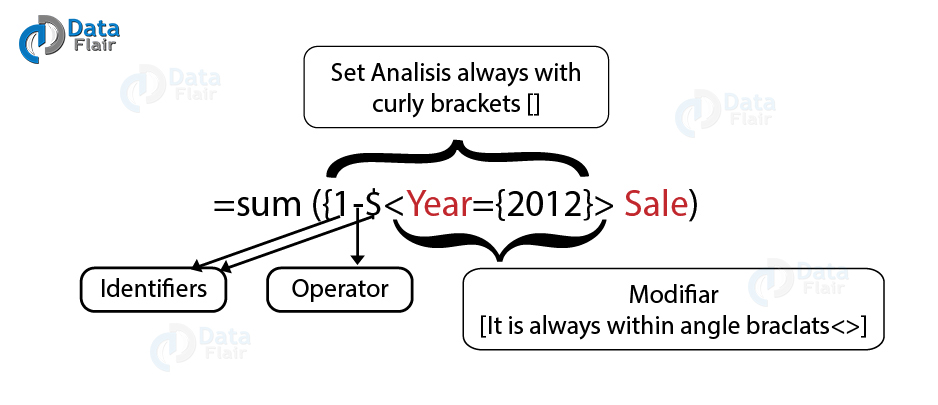
The expression which defines the set analysis for a sheet object (charts, tables, lists etc) has a fixed syntax to it. There are two rules for QlikView set analysis expression i.e. the set expression is always written in the closed curly brackets {} and every set expression must only use an aggregate function like Sum, Avg, Count, Mix, Max etc.
The QlikView set expression consists of three components.
- Identifier
- Operator
- Modifier
Let us understand each of the components in further detail.
In the image shown above is a sample set expression where the set expression is
{1-$<Year={2012}>}.
Follow this link to know different ways to Implement Data Loading in QlikView
i. Identifier
The identifier instructs the system as to what set of data is to be evaluated for set analysis in QlikView. There are different types of identifiers, using which you can specify which set of data records should the operations apply on.
- 0 is for an empty set having no records.
- 1 is for a set having all the values present in the record.
- $ is used for the values of the current selection.
- $1 is used for values of the previous selection.
- $_1 is for values of the next selection.
ii. Operator
The operators are used to establish and define a relation between identifiers (if more than one identifier is used). The operators are used to perform mathematical operations on the selected set of data. Take a look at the operator used in our example i.e. – and it is used between two identifiers 1 and $.
This expression ‘1-$’ translates to; subtract the current selections (represented by $) from the entire record (represented by 1) and take the resultant set of data, i.e. the data values which are not active in the current selection.
There are different types of operators.
- + i.e. a Union operator returns a union of sets.
- – i.e. an Exclusion operator returns the excluded sets.
- * known as the Intersection operator returns the data sets from both the identifiers.
- / called the Symmetric Difference operator which returns the data set from only one side of the two identifiers.
iii. Modifier
Modifiers contain fields that are can replace the current selection fields. That is the purpose of the modifiers i.e. to update or make changes in the selections. Such fields (one or more) can be written in the set expression under closed angle <> brackets with a selection criterion. In our sample, the modifier is <Year={2012}>. Hence, in a way, modifiers specify the fields or records to be selected furthermore.
Suppose in our set analysis expression, we have instructed the logic to select only the values of Year fields and the values related to it. But, using the set expression, we will narrow this selection down for the operations to be performed on only the values for the year 2012.
Let’s Explore QlikView Circular Reference & Loosely Coupled Tables
How to Apply QlikView Set Analysis Function on Data?
Let us learn how to deactivate the association step by step:
- DATA INPUT
Select the input data you wish to work with. We have used a CSV file on store product details.
Product_Id,Product_Line,Product_category,Product_quantity,Product_cost,Store Location, City
pr1,Sporting Goods,Winter Sports & Activities,34,18000,USA,New York
pr2,”Food, Beverages & Tobacco”,Fruits & Vegetables,76,7000,USA,New York
pr3,Apparel & Accessories,Uniforms,59,20000,India,Mumbai
pr4,Sporting Goods,Rugby,25,8458,Canada,Ontario
pr5,Health & Beauty,Body Lotion,44,5500,USA,San Fransisco
pr6,Arts & Entertainment,Musical Instruments,20,25000,Germany,Berlin
pr7,Arts & Entertainment,Orchestra Accessories,15,6700,Canada,Toronto
pr8,Arts & Entertainment,Crafting Materials,67,4200,India,Bangalore
pr9,Hardware,Power Tool Batteries,74,3600,UK,London
pr10,Home & Garden,Bath Caddies,66,2000,Germany,Berlin
pr11,”Food, Beverages & Tobacco”,Frozen Vegetables,56,5800,USA,Denver
pr12,Home & Garden,Power Equipment,87,6300,UK,Glasgow
pr13,Home & Garden,Water hose,42,7465,UK,Manchester
pr14,Health & Beauty,Aloevera Gel,46,4852,USA,Dallas
pr15,Health & Beauty,Face pack,52,5673,India,Delhi
pr16,”Food, Beverages & Tobacco”,Cereals,49,6480,Canada,Montreal
pr17,”Food, Beverages & Tobacco”,Fruit juices,58,4900,Australia,Melbourne
pr18,Sporting Goods,Football,40,5250,USA,Michigan
- SCRIPT LOADING
After selecting the data file from the source through the INSERT option given in the script editor, load the file. The script will look something like the one shown below with details of the data file you upload. Save this script and click OK to exit the script editor.
LOAD Product_Id,
     Product_Line,
     Product_category,
     Product_quality,
     Product_cost,
     [Store Location],
FROM
[C:\Users\HP\Desktop\Dataflair\productdetails.csv]
(txt, codepage is 1252, embedded labels, delimiter is ',', msq);
Follow this link to know about QlikView Publisher Repository (QVPR)
- CREATING SHEET OBJECTS
Reload the script by CTRL+R and create a table box, list box and straight table chart to display the information.
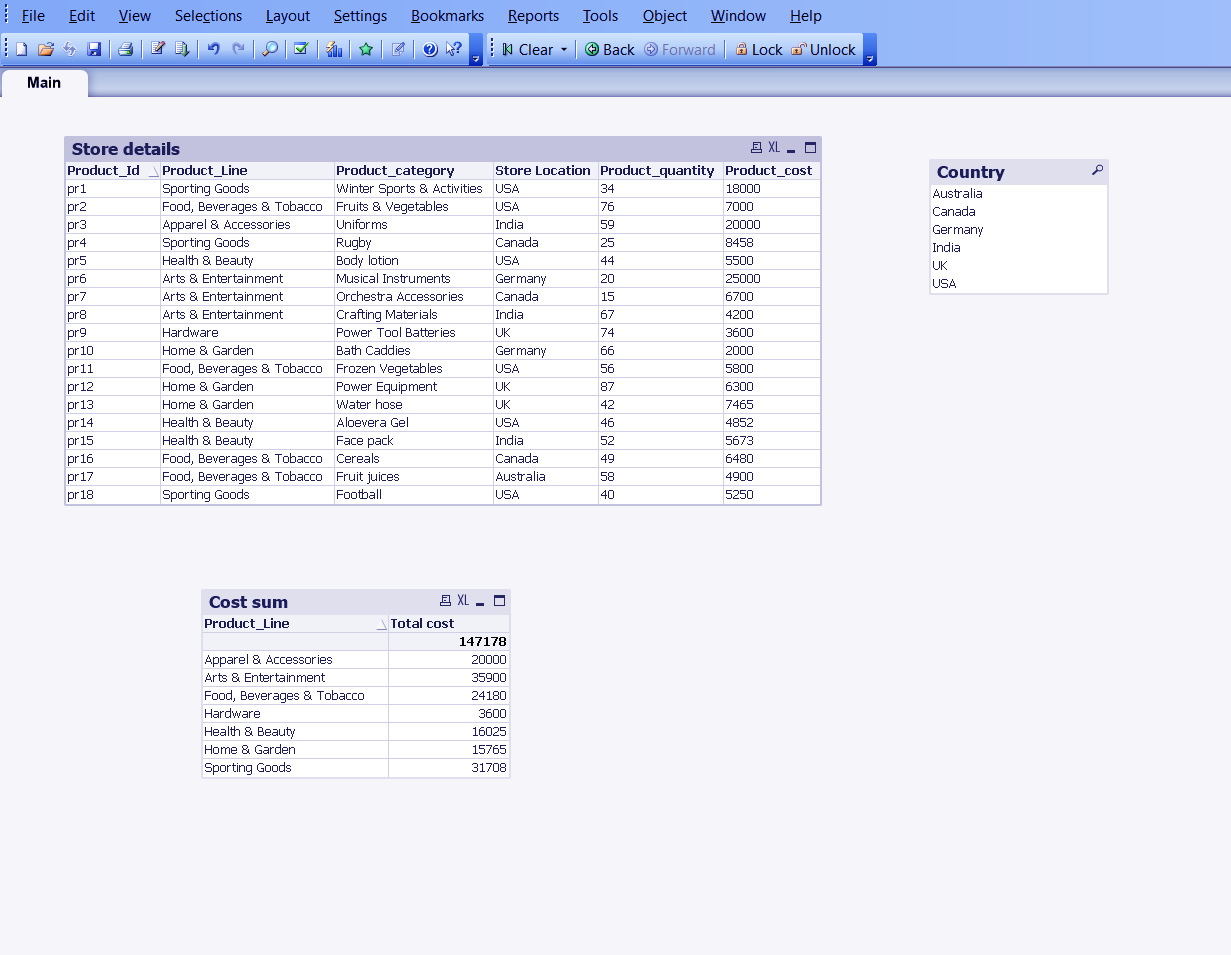
As you can see in the screenshot attached, we have created three sheet objects as mentioned above. First is a table box names ‘Store Details’ displaying all the fields. Next to it is a list box ‘Country’ showing the name of all the countries that is in the store’s information data. The third table, ‘cost sum’ is a straight table chart object showing the sum of the cost of products in each product line.
- ASSCIATIVE OBJECTS
All these three sheets objects are associative in nature to one another as the values within them will change as per the selections made in any one of the three sheet objects. Like, we have selected on ‘USA’ in the list box and both the rest of the boxes will also instantly filter their information to only that related to the USA. This is a typical example of data association.
Also, Read – QlikView Certification – Exams & Registration Process
- DISABELING SHEET ASSOCIATION
You can disable this sheet association by right-clicking on the straight table chart (‘cost sum’ in our example). In the drop-down list, you will see an option CLONE. Click on CLONE and a new copy of the table will be made.
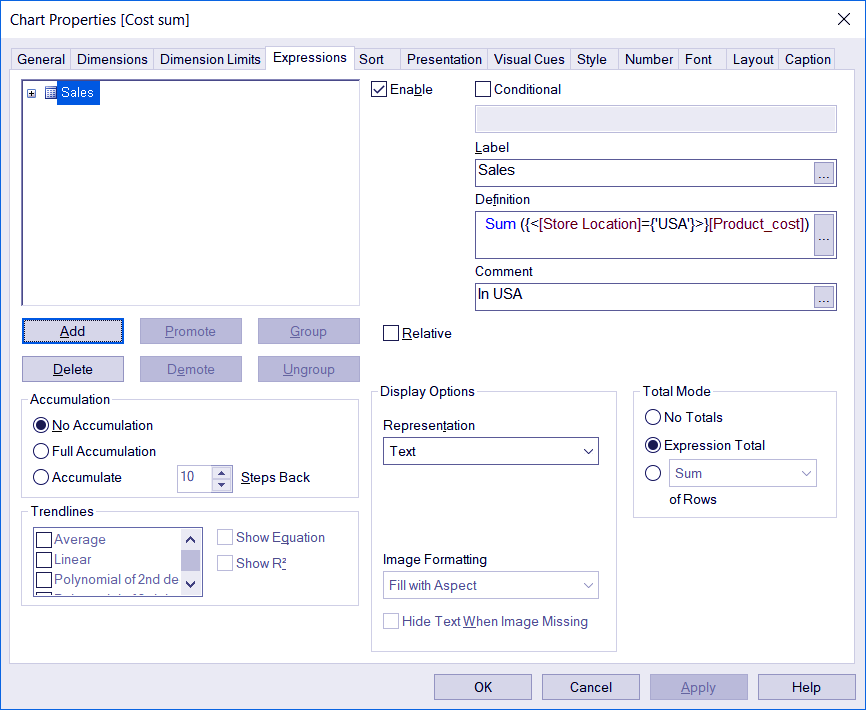
Right click on the cloned table and go to the Expressions tab if you wish to apply any specific functions and condition on data. We have put a condition so that it only shows the cost sum for stores in the USA.
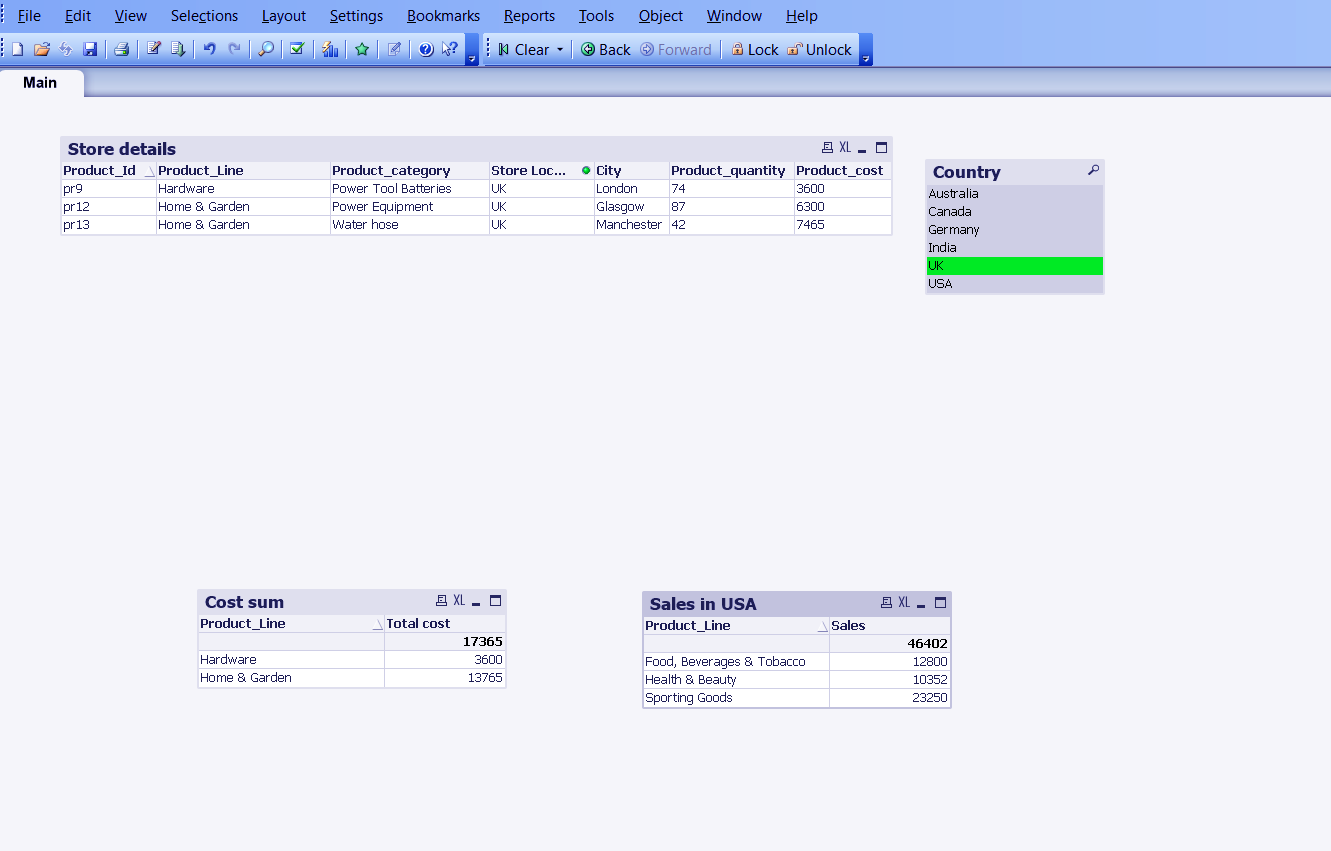
Now, after applying the desired conditions when we make a selection in any of the three tables except for the cloned one, no changes will be made in the cloned table.
Do you know What are the System Requirements for QlikView Version 11 & 12
As you can see in the screenshot attached below when we selected the UK from the country list, the other two tables filtered its information for the UK but the cloned table remained the same.
Define Concatenate in QlikView
QlikView comes with a feature ‘Concatenate’ which is used to join two tables together. The tables you wish to join might be a part of the same data information or be completely different in the context of data. Irrespective of column name or number, you can join tables using the concatenate function. This process is known as concatenation in QlikView.
i. How to Use QlikView Concatenation Function?
In order to apply the QlikView concatenate function, we first need to load the data files into QlikView’s script hence memory.
The sample data files we are using are two tables namely, Sale sold and Salesnew which has data related to sales information of a general store. The old table is of the month January and the new table is of the month February. We wish to join these two through QlikView concatenation.
- Salesold
Product_Id,Product_Line,Product_category,Product_quantity,Product_cost,Store Location, City,Month
pr1,Sporting Goods,Winter Sports & Activities,34,18000,USA,New York,January
pr2,”Food, Beverages & Tobacco”,Fruits & Vegetables,76,7000,USA,New York,January
pr3,Apparel & Accessories,Uniforms,59,20000,India,Mumbai,January
pr4,Sporting Goods,Rugby,25,8458,Canada,Ontario,January
pr5,Health & Beauty,Body lotion,44,5500,USA,San Fransisco ,January
pr6,Arts & Entertainment,Musical Instruments,20,25000,Germany,Berlin,January
pr7,Arts & Entertainment,Orchestra Accessories,15,6700,Canada,Toronto,January
pr8,Arts & Entertainment,Crafting Materials,67,4200,India,Bangalore,January
pr9,Hardware,Power Tool Batteries,74,3600,UK,London,January
Have a look at – How to run QlikView Silent Installation
- Salesnew
Product_Id,Product_Line,Product_category,Product_quantity,Product_cost,Store Location, City,Month
pr10,Home & Garden,Bath Caddies,66,2000,Germany,Berlin,February
pr11,”Food, Beverages & Tobacco”,Frozen Vegetables,56,5800,USA,Denver,February
pr12,Home & Garden,Power Equipment,87,6300,UK,Glasgow,February
pr13,Home & Garden,Water hose,42,7465,UK,Manchester,February
pr14,Health & Beauty,Aloevera Gel,46,4852,USA,Dallas,February
pr15,Health & Beauty,Face pack,52,5673,India,Delhi,February
pr16,”Food, Beverages & Tobacco”,Cereals,49,6480,Canada,Montreal,February
pr17,”Food, Beverages & Tobacco”,Fruit juices,58,4900,Australia,Melbourne,February
pr18,Sporting Goods,Football,40,5250,USA,Michigan,February
After loading the delimited files into QlikView’s script, we apply the ‘Concatenate’ function.
Save the script and click OK to exit the script loader. Reload the script and go to LAYOUT or right-click anywhere on the sheet to create a Table Box.
The fields from both the tables will be available to put in the table box. Choose accordingly.
Click OK to view the table.
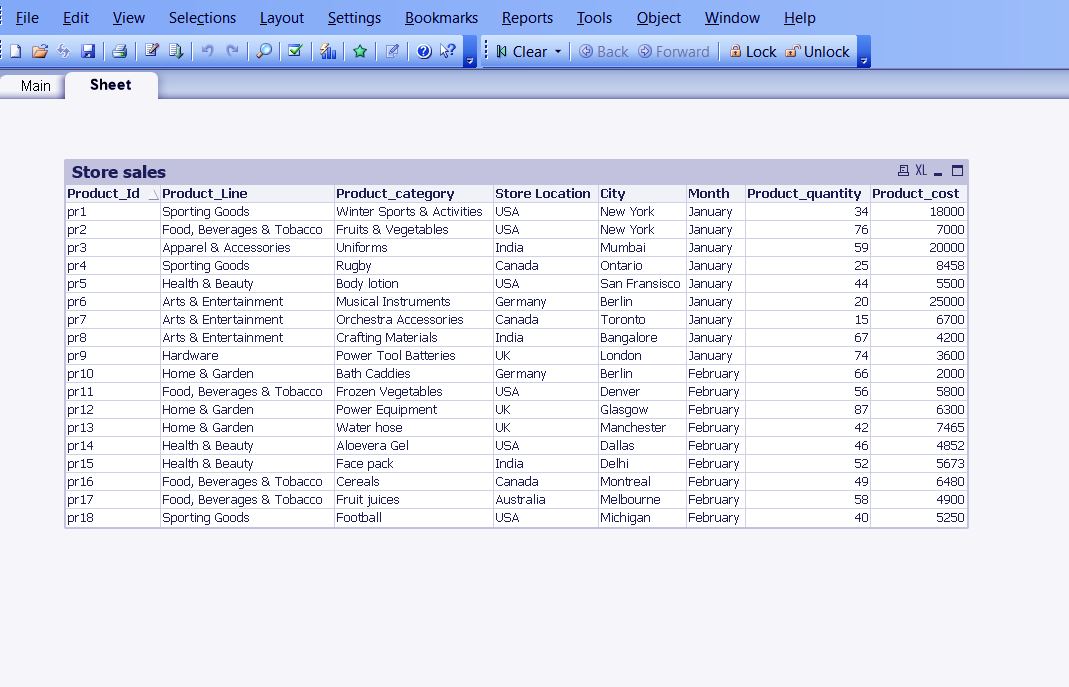
As shown in the screenshot above, both the Sale sold and Salesnew table got concatenated or joined to form a completely new table.
Let’s read about QlikView Ports and Client Communication in QlikView
Types of Concatenation in QlikView
QlikView Concatenation can be done in three ways, which are;
i. Automatic Concatenation
In automatic concatenation in QlikView, the tables (two or more) having same fields names or number, concatenator to from a single table automatically. The number of records in the concatenated table are equal to the sum of records in all the tables which were concatenated.
ii. Forced Concatenation
Forced concatenation in QlikView is done when the tables subjected to concatenation do not have matching field names or numbers. If the user still wishes to concatenate such tables, it could be done forcefully by using the ‘Concatenate’ keyword before the LOAD statement.
iii. No Concatenation
As we saw in the automatic concatenation that if two or more than two tables save similar field names or number, they are automatically concatenated without user’s permission in QlikView. To prevent this from happening, users must use the keyword ‘NoConcatenate’ in the script.
So, this was all about QlikView Set Analysis. Hope you like our explanation.
Conclusion
Hence, both the QlikView set analysis function and concatenation function carry their own significance. With the help of set analysis, you can compare data information very easily by making any table and its information static in nature keeping others associative or dynamic.
And the QlikView concatenation feature is we saw is a simple useful tool to collected related or unrelated information in order to make it more comprehensive. Furthermore, if you have any query, feel free to ask in the comment section.
Related Topic – QlikView Server Load Sharing
Did you like this article? If Yes, please give DataFlair 5 Stars on Google







Thank you very much for this information. What a great blog!!
how to give concatenate
please explain elaborately