QlikView Chart Expressions – A Latest Complete Tutorial
Expert-led Online Courses: Elevate Your Skills, Get ready for Future - Enroll Now!
In our last tutorial, we discuss QlikView Bookmarks. Now, we are going to talk about Qlikview Chart Expressions. Moreover, we will discuss 3 types of Chart Expressions in QlikView: Qlikview Aggregation function, QlikView Set Analysis and Set Expressions and Dynamic Calculated Expressions in QlikView.
As we know the significance of QlikView Charts and the functionalities provided by it. There are several good sheet objects in QlikView which are used to display data like a table box. But there is one basic difference between a Table box and a chart i.e. a table box displays data statically whereas in charts can display data dynamically with the help of chart expressions in QlikView.
So, let’s start QlikView Chart Expressions.
What are QlikView Chart Expressions?
An expression used in any coding language is like an instruction that instructs the machine how to process the given data. Similarly, in QlikView chart expressions are the instruction which when applied on specific data fields, process the field values in the instructed way and display the result in the chart.
QlikView chart expressions comprise of fieldnames, mathematical or logical functions and operators (*/+-). In QlikView charts, expressions can create to apply on static as well as dynamic fields.
Do you know How to Generate Data in QlikView (autogenerate)?
Usually, mathematical and logical functions believe to be used on measures (numerical and calculable fields) only, but the QlikView chart expressions are applicable on dimensions (static text fields like table’s title, field title etc.) as well.
By making dimensions dynamic using chart expressions in QlikView, such values will change according to the selections made in the chart or any associated sheet object for that matter.
a. QlikView Chart Expressions Syntax
Let’s move on to learn the chart expression’s general syntax. The syntax is created using the concepts and rules of Backus-Naur formalism. Varied types of QlikView chart expressions syntax generally used are listed below,
expression ::= (constant | expressionname | operator1 expression | expression operator2 expression | function | aggregation function |(expression))
This translates to: an expression can define as a constant string having text or numbers. The text is enclosed in single quotation marks.
Expressionname is the name or label of an already existing expression in the same chart.
Operator1 stands for a unary operator that applies only to the values on the right.
Operator2 is a binary operator that applies to the values on both sides of the operator.
A function is applied following the syntax-
function ::= functionname (parameters)
prameters ::= expression {,expression}
QlikView Aggregation functions can also be defined,
aggregationfunction ::= aggregationfunctionname (parameters2)
parameters2 ::= aggrexpression {, aggrexpression}
Types of QlikView Chart Expressions
Let’s discuss 3 major types of QlikView Chart Expressions:
i. QlikView Aggregation Function
Aggregation is a crucial function to be used in any Business Intelligence tool because it covers the data being evaluated as a whole/aggregate and returns result accordingly. This is of great use because generally enterprises use data in bulk and applying functions on individual fields and value could a next to impossible task. Most commonly use QlikView aggregate functions are Sum, Average, Min, Max etc.
a. Defining the Scope of Aggregation in QlikView
Every time aggregation apply on a data set, the scope of aggregation must be defined. By scope, it is meant that which data values or records are relevant. QlikView Aggregation function, apply only applied over the relevant data hence defining scope is necessary.
A Scope defines base on two factors, one is selections and second is Dimensional values. Once these two factors consider and apply, then after restricting them what remains is only the relevant data values for aggregation.
During defining the scope of aggregation i.e. setting the limit so that the system takes up only the relevant data is selected by the means of two methods; Total Qualifier and/or Set Analysis. It can also be said that by these methods the scope of aggregation can be re-defined.
These methods use to disregard irrelevant data records so that aggregation function can only be applied on the relevant data values. The method keywords are written within the aggregate function keyword.
The table given below describes the methods in detail.
I. Total Qualifier
Using the total qualifier inside your aggregation expression or function disregards the dimensional value. The aggregation will be performed on all possible field values and the calculation is made disregarding all chart dimension variables except those listed.
Such fields that are not currently a dimension in a chart may be included in the list as well. It is known to be useful in the case of group dimensions, where the dimension fields are not fixed.
Have a look at – QlikView Server Load Sharing (Clustering) with Architecture
II. Set Analysis
Using set analysis inside your aggregation expression overrides the selection and the aggregation will be performed on all values split across the dimensions.
III. TOTAL qualifier and Set Analysis
Using the TOTAL qualifier and set analysis inside your aggregation expression overrides or disregards the selection and disregards the dimensions.
IV. ALL qualifier
Using the ALL qualifier inside your aggregation expression disregards the selection and the dimensions. The same can be done using the {1} set analysis statement and the TOTAL qualifier:
=sum(A11 Sales)
=sum({1} Total Sales)
Let us understand these methods through example. A sample data has been used for the example.
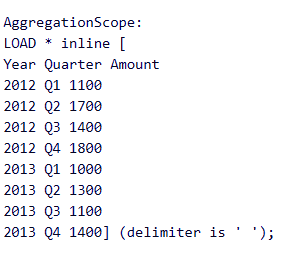
Example of QlikView Aggregation Function
We will see how the Total Qualifier and Set analysis methods work in restricting irrelevant data values for aggregation. The two methods can be used individually or in combination.
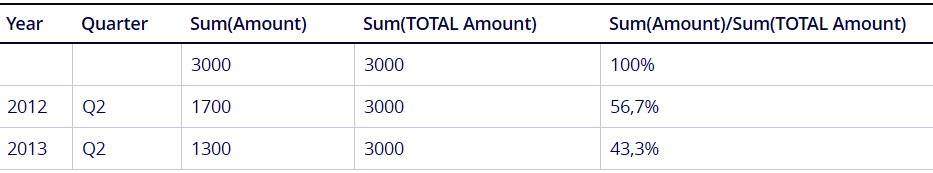
A total qualifier is used in the QlikView aggregation function when you want the system to disregard the dimensional value i.e. the data values specific to the field ‘Quarter’. The fourth column or field in the table given below uses TOTAL qualifier within a Sum aggregate function ‘Sum(TOTAL Amount)’ which displays the sum total of all the values in the field ‘Sum(Amount)’.
Values from the field in which total qualifier was applied are then used in the expression ‘Sum(Amount)/Sum(TOTAL Amount)’ which gives the percentage ratio of individual dimension values to the total amount.
Also, Read – QlikView Operators -and its Types
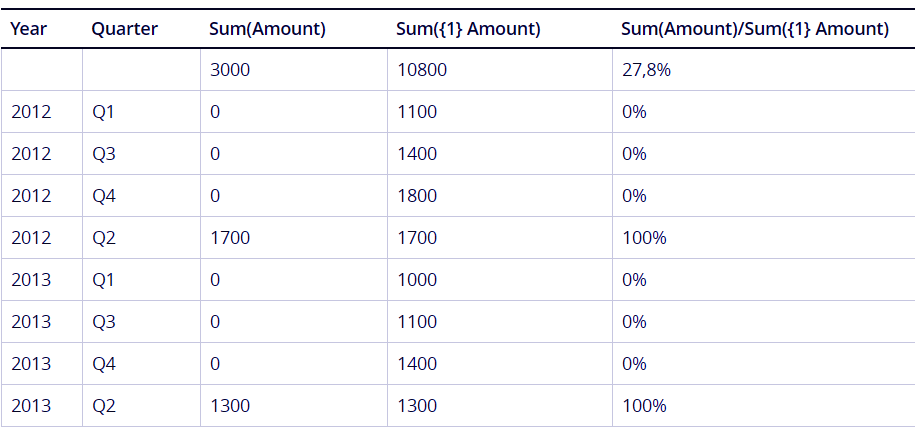
Example of QlikView Aggregation Function
Set Analysis method is used when some selections made in the chart are to be disregarded. It is different from the total qualifier because it is used when we want to disregard the dimensional values. Whereas in the case of disregarding selections, the system disregards selections made by the user and takes in all the data values from a field.
As done in the sample chart below. The set analysis is included with Sum aggregation function ‘Sum({1} Amount)’. In this field all of the values which are not present in the ‘Sum(Amount) column (because Q2 is selected) are present as a result of disregarding the selection made on Q2.
The {1} in this expression denotes set definition and instructs the machine to ignore the selections and consider all of the values in the record.
The final expression for calculating the percentage is ‘Sum(Amount)/Sum({1} Amount)’ gives, as a result, the ratio of the values in Sum(Amount) field that includes selections to the values of the field Sum({1} Amount) where set analysis is applied.
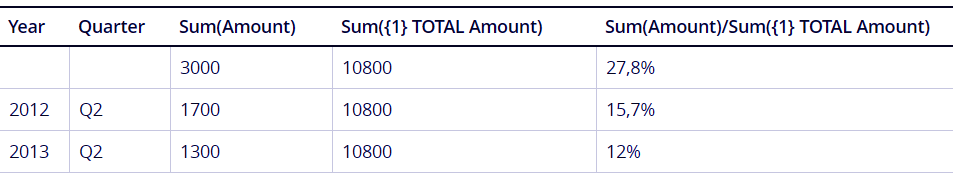
QlikView Aggregation Function
You can also use Total qualifier and set analysis together. As you can see we have applied the two methods together in the column ‘Sum({1}TOTAL Amount)’. This will disregard both the dimensional value and active selections to only present the relevant data.
QlikView Aggregation Function
b. QlikView Aggregation Syntax
The general syntax used when defining an aggregate function/expression is,
Aggrexpression ::= ( fieldref | operator1 aggrexpression | aggrexpression operator2 aggrexpression | functioninaggr |(aggrexpression) )
Where fieldref is a field name and functionaggr stands for functionname (parameters2)
Follow this link to know about QlikView Script Statements & Keywords
ii. QlikView Set Analysis and Set Expressions
Set Analysis is a very useful feature given in QlikView that enables users to compare sets of data within a document. In QlikView set analysis, you can select a set of data values and make it static. That means, a particular data set chosen for set analysis will not associate with other sheet objects and not change with any selections made. Thus, it becomes static.
Although, before making a chart dataset static, there must to be a set expression applied on the values in the data set. All the values will evaluate as instructed by the set expression and the result of that calculation display on the static set analysis box.
Thus, the QlikView set expression defines the set of field values and when these defined field values are evaluated according to the set expression, then it is called set analysis. We have a separate tutorial explaining set analysis you can go and check to understand this concept better.
a. QlikView Set Expression Syntax
The syntax of the QlikView set expression is explain here in the backus-naur form.
set_expression ::= {set_entity { set_operator set_entity }}
set_entity ::= set_identifier [ set_modifier ]
set_identifier ::= 1 | $ | $N | $_N | bookmark_id |bookmark_name
set_operator ::= + | – | * | /
set_modifier ::= < field_selection {, field_selection } >
field_selection ::= field_name [ = | += | –= | *= | /= ] element_set_expression
element_set_expression ::= element_set { set_operator element_set }
element_set ::= [ field_name ] | { element_list } | element_function
element_list ::= element { , element }
element_function ::= ( P | E ) ( [ set_expression ] [ field_name ] )
element ::= field_value | ” search_mask “
There are two syntax rules while writing a set expression i.e. the QlikView set expression must always be an aggregation function (Sum, Max, Min , Count, Avg etc.). And the second rule is that a set expression must enclose in curved brackets {}. For example, the expression Sum({$<Year={2017}>} Sales ), the expression {$<Year={2017}>} is the set expression. A QlikView set expression is made up of three parts; Identifier, Operator and Modifier.
Let’s Explore QlikView Search and its Types
iii. Dynamic Calculated Expressions in QlikView
The dynamic calculated expressions are the expressions that are used to make stthe atic field or table labels dynamic in functioning. That is, the labels or text titles will also change according to the selections made in the associated sheet objects and this changing of titles will be made possible by the calculated expressions evaluating the changes in data dynamics and returning the resultant title or label.
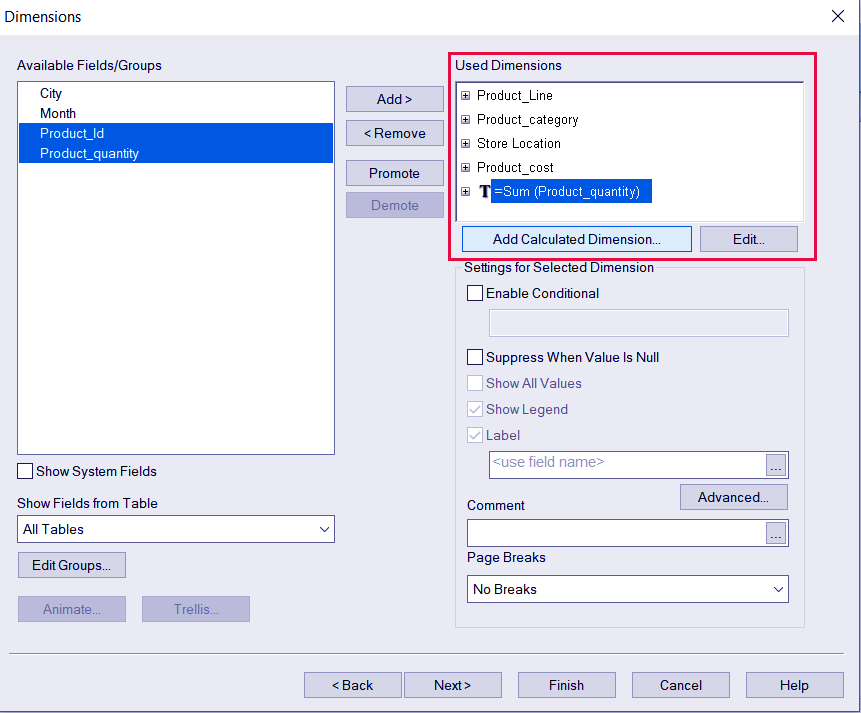
Dynamic Calculated Expressions in QlikView
In the screenshot given above, a calculated expression is added in a straight table chart.
So, this was all about QlikView Chart Expressions. Hope you like our explanation.
Conclusion
Hence, the QlikView chart expressions consist of different types of expressions like aggregate expressions, set expressions, dynamic calculated expressions. This makes the chart object a very flexible tool where you can apply all these different kinds of expressions on the data values and analyze the data even better.
Furthermore, if you have any queries, please drop your comments in the comment box below.
Related Topic – QlikView Publisher Repository (QVPR)
Your opinion matters
Please write your valuable feedback about DataFlair on Google


