Best Practice for Data Modeling in QlikView – 11 Unique Practices
Job-ready Online Courses: Knowledge Awaits – Click to Access!
The last session ends on QlikView Data Types. Here, we will talk about the importance of Data Modeling in QlikView.
Moreover, we will learn the Best Practice for Data Modeling in QlikView with their examples.
So, let’s start the tutorial of “Best Practice for Data Modeling in QlikView”.
Best Practice for Data Modeling in QlikView – 11 Unique Practices
Importance of QlikView Data Modeling
A good data model ensures the efficient working of your application in QlikView.
This means, the data will process faster, expressions will evaluate quickly and give correct results because all the data will properly arrange in cells so that the system can take a logical path to fetch and evaluate data values.
Also, by having a well-structured data model, the system’s memory also consume economically avoiding occupying memory storage with access data.
Best practice for data modeling in QlikView is all about making your data well structured and logically feasible to optimize data processing and analysis in QlikView.
This can achieve by plotting out a design with specific operations (ETL) you need to perform on your intended data set in order to get your data in a perfect data model.
Best Practice for Data Modeling in QlikView
In QlikView, it prefers that you must design your data loading so that the data (in tables) takes the form of a star schema in QlikView. In a star schema, ideally, there is a fact table at the center containing the key fields that servers as a link to other tables.
The fact table also contains the numbers or measure values for calculation. Branching from this central fact table are the dimension tables which link to the central table by corresponding key fields.
In QlikView, the process of data loading can also explain by the process of ETL i.e. Extract, Transform and Load which encompasses all the operations and processes perform with data from start to end. Let us understand this process in some detail,
Extract– In this step, as the name suggests, data extract from the data sources which are shown in the script by LOAD and SELECT statements.
Transform– In order to get the intended data structure, transforming the extracted data is quite necessary. Data transform by manipulating it using script functions and expressions. Transformation on a data table can be done using the Transformation wizard. Some common transformation operations apply to the data are; calculating new values, translating coded values, renaming fields, joining tables, aggregating values, pivoting and data validation.
Load– Loading is the last step in the process, where the final data, all process and alter is ready to load and use in QlikView. Data load when the script saves and execute.
Although, ELT is the conceptual approach to optimize data modeling, there are several actual best practice for data modelling in QlikView.
i. Use QVD files for Incremental Load
As we know, an incremental load is just the new data or the updated data that is to add in an already existing data file. For better and faster loading of incremental load, QVD files recommend.
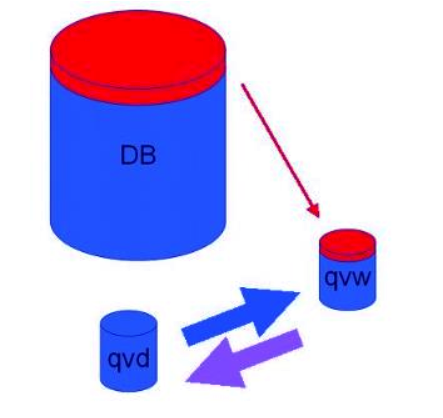
The old data must be in the QVD files because they can retrieve at a much faster rate than the traditional Qvw files.
So, during loading, the incremental data, the new data bunch load from the data source/database (a slow process) and the old data fetch from the Qvd files (comparatively faster).
Then both these data (old and new) load into a new Qvd file and the file is saved. This process is repeated every time incremental data is to load.
Best Practice for Data Modeling in QlikView – QVD Files
ii. Combining Tables with Join and Keep
To combine two tables which may or may not have fields or field values in common, Join and Keep prefixes are used in QlikView.
Although both the functions are used to combine or merge two or more tables, there is a difference between the two. When Join is used prefixing the Load or Select statements, it combines two tables and makes them one table.
The overriding values which in the same fields are taken only once and a single table is made having the unrepeated values of data. This newly created table is stored as a single internal table in QlikView’s memory.
On the other hand, if the user does not want to merge two tables and make it permanently one table containing all the data of two tables (which makes it quite bulky and slow to process), he can opt for Keep option.
The Keep option reduces the repeating or identical data from two tables and links them only from the intersection part, i.e. from the fields or records that truly match in both tables.
Keep only establishes a link between the table and associates them and stores two separate tables instead of combining them and storing them as one table.
By doing so, the table does not get too big in size, the matching data gets associated, memory is saved, processing gets faster and the associated tables can be used individually as well.
As we know there three to four types of joins and keeps i.e. inner, outer (only join), left and right which gives different results upon using them join and keep.
iii. Use Mapping as an Alternative to Joining
As we have discussed the issue of the size of the tables created by join in the previous section. Mapping is a good alternative to be used instead of Join. Join creates large in size tables and processing them slow down the tool.
Instead, the Mapping function works much efficiently. Using Mapping keyword, you can map fields from one table into another.
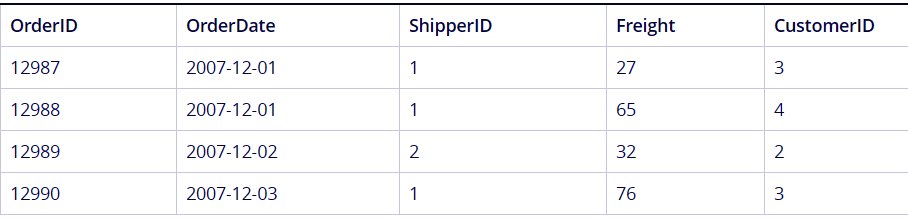
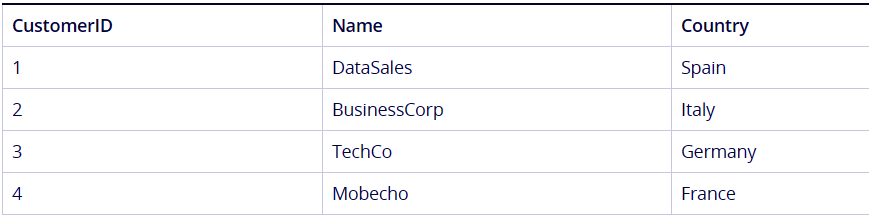
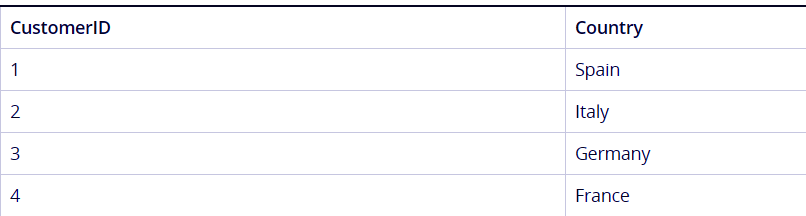
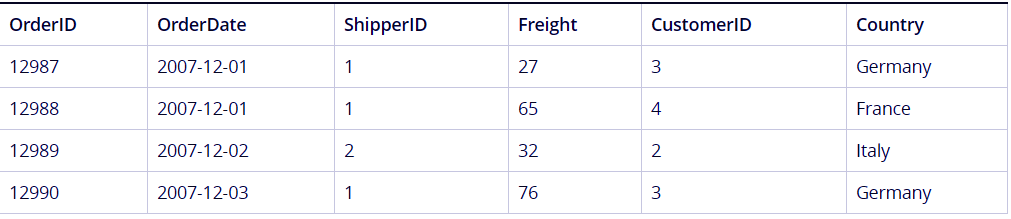
Suppose we have two tables, named ‘Customers’ and ‘Orders’. The tables are shown below.
Best Practice for Data Modeling in QlikView – Use Mapping as an Alternative to Joining
Best Practice for Data Modeling in QlikView – Use Mapping as an Alternative to Joining
Now, what we want to do is map the Country field in the Orders table through the common field CustomerID. We want to do this because we also want country information corresponding to each customer’s ID.
For this, we will create a mapping table internally using the following script commands,
First, we will create a mapping table named MapCustomerIDtoCountry.
MapCustomerIDtoCountry:
Mapping LOAD CustomerID, Country From Customers ;
The table created using will this will logically look like this,
Best Practice for Data Modeling in QlikView – Use Mapping as an Alternative to Joining
Next, we will apply this mapping in the Orders table.
Orders:
S *,
ApplyMap(‘MapCustomerIDtoCountry’,CustomerID, null()) as Country
From Orders ;
This statement will apply the mapped table into the Orders table and countries will be shown for each customer ID.
Best Practice for Data Modeling in QlikView – Use Mapping as an Alternative to Joining
iv. Working with Cross Tables
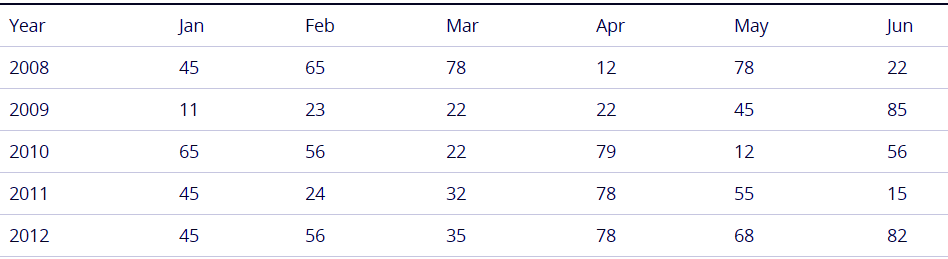
Working with cross tables also optimizes the data model. Cross table is a like cross section of two orthogonal headers between which a matrix of data is filled. Let’s take an example of the table below.
Best Practice for Data Modeling in QlikView – Working with Cross Tables
In this table there is one field for Year and then the separate field for each month. This table structure is not good and will create issues in the data model.
To improve and resolve this issue, we have to create one field which contains all the months. This will be done by Crosstable prefix used before Load and Select statements.
Also, Refer QlikView Circular Reference and Loosely Coupled Tables
crosstable (Month, Sales) LOAD * from ex1.xlsx
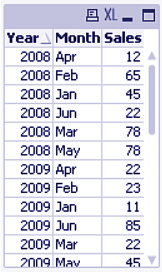
This statement will create a cross table looking like this,
Working with Cross Tables
This table has repeating year values for each month but a well-defined field called Month, structuring the data properly.
v. Generic Databases
If the tables containing data follows a complex logic where one filed name has many records associated with it, then the best way is to create a Generic Database table.
In a generic database table, there is a column containing field names as field values and then other columns which contain the field values.
Let us suppose a scenario where we have two objects Ball and Box and there are certain attributes like color, diameter, height etc. given for these objects.
For such a data table, if we create list boxes for each field i.e. Object, Attribute and Value, it will look something like this.
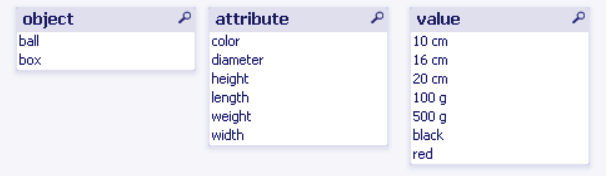
Best Practice for Data Modeling in QlikView – Generic Databases
This shows that there are two objects Ball and Box for which there are some attributes and values given. But looking at these list boxes, can we tell what are the attributes and values for box and what are them for ball? No, right?
So, to give this messy chunk of data, a proper logic and structure, generic database tables are created.

Best Practice for Data Modeling in QlikView – Generic Databases
Now, when we create list boxes from this generic table, with the statement,
Generic SELECT* from GenericTable;
The list boxes will display information in a well-structured manner than before.
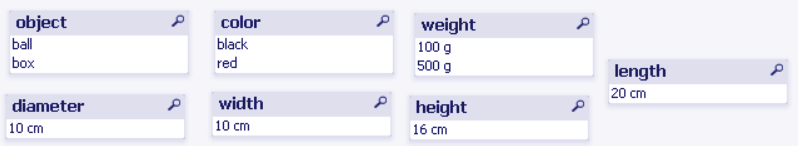
Best Practice for Data Modeling in QlikView – Generic Databases
vi. Matching Intervals to Discrete Data
We are familiar with the Intervalmatch() function which is used to match or link discrete numeric or time interval values with other such values (from different tables).
This operation on data can also be done carefully, keeping some points in mind to maintain a good data model.
Some things to keep in mind before using Intervalmatch() function is, that the discrete values must be read into QlikView before Intervalmatch() function calls them.
Another thing is that the table to which the discrete data points will be matched or linked should at least have two fields (typically start and end fields) so that the interval is properly closed by an end time or terminating point.
If the intervals overlap in the tables, they are linked with all corresponding or matching values.
vii. Creating a Date Interval from a Single Date
Sometimes, it so happens that instead of a beginning and end of an interval, only a single date is given. Like in the data set given below.

Date Interval from a Single Date
You can create a FromDate and ToDate intervals from the script commands given below,
Let vBeginTime = Num(‘1/1/2013’);
Let vEndTime = Num(‘1/3/2013’);
Let vEpsilon = Pow(2,-27);
Tmp_Rates:
LOAD Currency, Rate,
Date(If(IsNum([Change Date]), [Change Date], $(#vBeginTime))) as FromDate
From ‘C:\MyFiles\Rates.xlsx’
(ooxml, embedded labels, table is Sheet1);
Rates:
LOAD Currency, Rate, FromDate,
Date(If( Currency=Peek(Currency),
Peek(FromDate) – $(#vEpsilon),
$(#vEndTime)
)) as ToDate
Resident Tmp_Rates
Order By Currency, FromDate Desc;
Drop Table Tmp_Rates;
This will create a table with intervals.
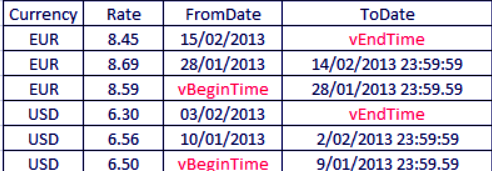
Date Interval from a Single Date
viii. Hierarchies
A well-balanced n-level of a hierarchy is very important to have for a good data structure and in turn, a good data model.
There are different modes of representation for hierarchies i.e, Adjacent nodes table, Expanded nodes table and ancestors or bridge node table.
The adjacent node table is the most basic way of tabular representation of a field hierarchy.
It shows the child and the parent node and one field corresponding to that node.
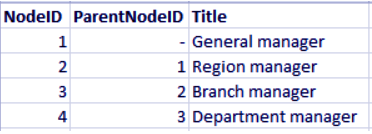
Best Practice for Data Modeling in QlikView – Hierarchies
While adjacent node tables are good for management purposes but not that informative for doing selections and analysis.
For this, expanded node tables are used which provides the sub-fields or sub-levels of the main fields of the hierarchy. It expands or spreads the hierarchy to its length.
An expanded table can be created using the script command below,
Hierarchy (NodeID, ParentNodeID, Title, ‘Manager’) LOAD
NodeID,
ParentNodeID,
Title
FROM ‘hierarchy.txt’ (txt, codepage is 1252, embedded labels, delimiter is ‘,’, msq);
Here, we have converted the adjacent table into expanded table which looks like this,
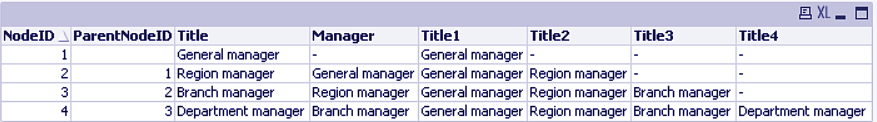
Best Practice for Data Modeling in QlikView – Hierarchies
However, making selections in expanded tables is also a tedious task and requires you to already know about the hierarchy of the data.
To counter this issue, Ancestors node tables use. These tables represent hierarchies in further detail. They have separate records for each node giving details of parent and children nodes showing which node a specific node belongs to.
To convert expande or adjacent nodes table to an ancestors table, use the keyword Hierarchybelongsto in the load script.
ix. Semantic Links
The Semantic Links are the associations or the links that are present between the values within a field or between fields. A semantic table creates which has the details or logic of these associations between data values.
In a semantic table, there are generally four columns, the first column has the values which link or associate to other values, the second column shows the relation between the two, the third column contains the values with which the values in the first column associate.
And lastly, the fourth column (if present) will show the inverse of the relation shown in the second column. There are certain things which must be kept in mind while making a semantic table i.e. the table must have three or four columns, not less.
The relation/association between the values must be either in the values present within a field or between the values of different fields. A combination of these two types not allow. There must be a Semantic qualifier must use before the Load or Select statements.
a. Semantic links Example
Let us understand to make selections using the semantic table with an example. We have taken sample data from QlikView’s example directory.
The name of the table is Presidents, which contains details about all the presidents, from the first to present, that has served in USA. There are three columns in this table, which are, Sequence, Name and Party.
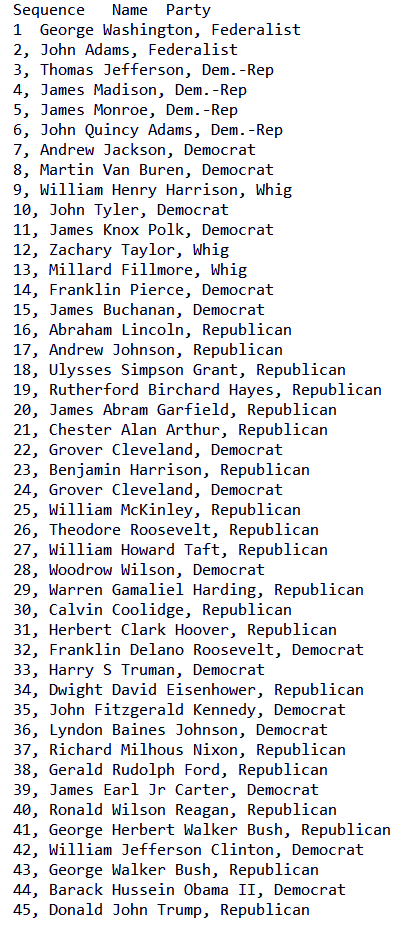
Semantic links Example
Now, we will make a semantic table such that the relation between the values (President’s names) will be of successors and predecessor. The script for creating such a table would be,
Directory presidents;
Load * from presdnts.csv (ansi, txt, delimiter
is ‘,’, embedded labels);
Semantic Load
No -1 as No,
‘Successor’ as Relation,
No,
‘Predecessor’ as Relation
from presdnts.csv (ansi, txt, delimiter is ‘,’,
embedded labels) where No > 1;
This will generate a sematic table with four columns; No (values link to other values), Relation (Successor), No (values with which the previous values link to), Relation(Predecessor).
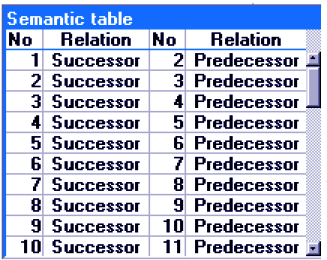
Semantic links
Now, we will load this semantic table into our main script handling data and execute it to be able to create sheet objects (tables, lists, charts etc.)
Load
No as DuplicateOfNo,
FirstName & ‘ ‘ & LastName as Name,
*f
rom presdnts.csv;
Semantic Load
No -1 as No,
FirstName & ‘ ‘ & LastName as Successor,
No as DuplicateOfNo,
‘Dummy1’
from presdnts.csv where No > 1;
Semantic Load
No +1 as No,
FirstName &’ ‘ & LastName as Predecessor,
No as DuplicateOfNo,
‘Dummy2’
from presdnts.csv;
The table created will look like this,
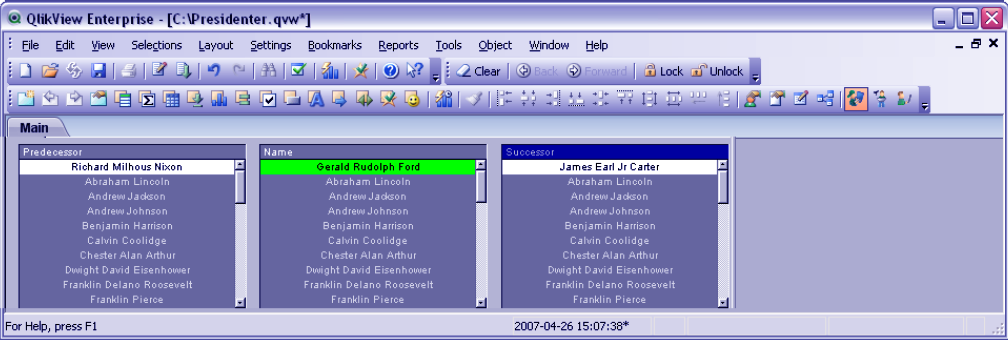
Best Practice for Data Modeling in QlikView – Semantic Load
You can make selections in the center table and the corresponding successors and predecessors will show in the right and left tables using the semantic links define in the semantic table.
x. Linking Information to Field Values
In QlikView, it is all about how well use the data and information available to you and display it in such a way that the user could analyze it properly.
Adding to this purpose is the feature of linking information to field values in the table. You can add information like a text information, an image, URL, external application files etc. to the field values of a table.
There is an information table generate through script commands that keep the details of all the information that link to specific field values.
A sample statement to create an information table is,
Info Load Country, I from Flagsoecd.csv (ansi, txt, delimiter is ‘,’, embedded labels);
This will create an information table given below,

Best Practice for Data Modeling in QlikView – Linking Information to Field Values
As you can see, an information table has two columns in general, the first column is a field name containing a list of all the field values to which different kinds of information is to link.
The second column has the names and the information or references to information in it.
Upon script execution, the fields values in the table that link to some information will get an icon at the corner of the table cells containing them.
Clicking upon those icons you will get to access the information. The information link could be anything, like a text, an image, a sound clip, a link to a video, an executable file, a file destination, URL etc.
xi. Data Cleansing
In our effort to optimize our data model in QlikView, avoiding storage access data must avoid. That is why data cleansing practice.
Let us consider a scenario, where we have two tables; Country A and Country B each of them has U.S.A. written in different ways like US, USA, Unites States, U.S., America.
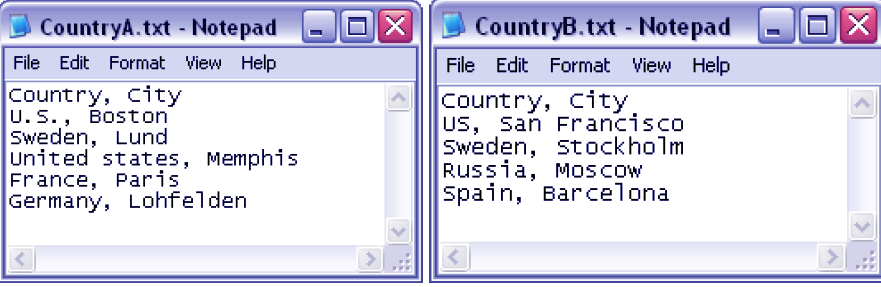
Best Practice for Data Modeling in QlikView – Data Cleansing
This creates redundant data as separate records in memory will create for each of these names because the system will interpret them as different values when in reality, it is the same country.
To cleanse such an access data create Mapping use. What happens by using mapping is that the original table store and stays in the memory while only a mapped version of it use during execution.
When the script execution terminates, this temporary table drop.
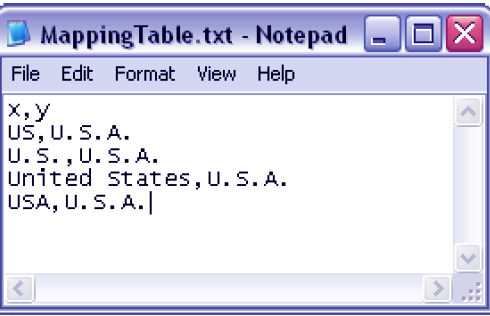
In the case we just discuss, we will create a mapping table and link it with our Country A and Country B tables. The script use for doing so is,
CountryMap:
Mapping Load x,y from MappingTable.txt
(ansi, txt, delimiter is ‘,’, embedded
labels);
Map Country using CountryMap;
Load Country,City from CountryA.txt
(ansi, txt, delimiter is ‘,’, embedded labels);
Load Country, City from CountryB.txt
(ansi, txt, delimiter is ‘,’, embedded labels);
Best Practice for Data Modeling in QlikView – Data Cleansing
Now regardless of how the name of the United States of America is written, it will interpret as the U.S.A. only.
So, this was all about Best Practice for Data Modeling in QlikView. Hope you like our explanation.
Conclusion
These were all the best practice for Data Modeling in QlikView that you must keep in mind while preparing your script, as this will reflect in your data model.
A good script means a good data model and better your application performs. Read and understand these practices thoroughly and try to apply them to your data set. Still, have a confusion, feel free to ask in the comment box.
Did you know we work 24x7 to provide you best tutorials
Please encourage us - write a review on Google


