Chi Square Test in QlikView | QlikView Statistics Chart Wizard
Placement-ready Courses: Enroll Now, Thank us Later!
In this tutorial, we are going to learn about one of three QlikView statistical tests; Chi-square or Chi2 test. Chi Square test in QlikView comes under the Statistical Chart Wizard. We will learn about this test and how to perform it in your data set in QlikView.
So, let’s start Chi Square test in QlikView.
Chi Square Test in QlikView
The chi-square test in QlikView uses to compare and examine whether the observe and expect frequencies of data are different from each other or not. The formula to calculate the chi value is,
ꭕ2 = Σ (Observed – Expected)2 / Expected
Where ꭕ2 is the chi value (square).
Σ is the summation of the expression in front of it.
‘Observed’ is the observed value i.e. data fetch.
‘Expected’ is the value we expect.
Do you know What is QlikView Data Structure (Tables & Fields)?
QlikView Chi-Square Test Using Statistics Chart Wizard
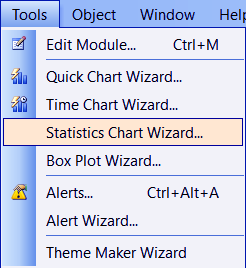
Now, we will learn how to perform a Chi square test in QlikView using the Statistics chart wizard. The option for statistics chart wizard is given in the Tools menu.
How to Use QlikView Chi Square Test
Now, let us first understand the data we have here. We have survey records of two outlets of an Italian restaurant located in different cities. The survey/feedback taken from the customers at these two differently located outlets is about whether they would like to visit the restaurant again or not.
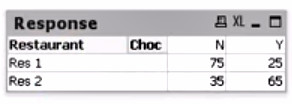
Chi Square Test in QlikView – Data
The data when represented in a tabular form, looks like this in the image above. It specifies the number of Yeses and Nos each restaurant got.
What we want to know from doing this test is that whether both the restaurants have equal reputation and likability so that people would want to come back again or the reputation of both is different i.e. one is more popular than the other.
In order to apply the test on this data, we will open the Statistics Chart Wizard and select the Chi2-Test option. Click Next to continue.
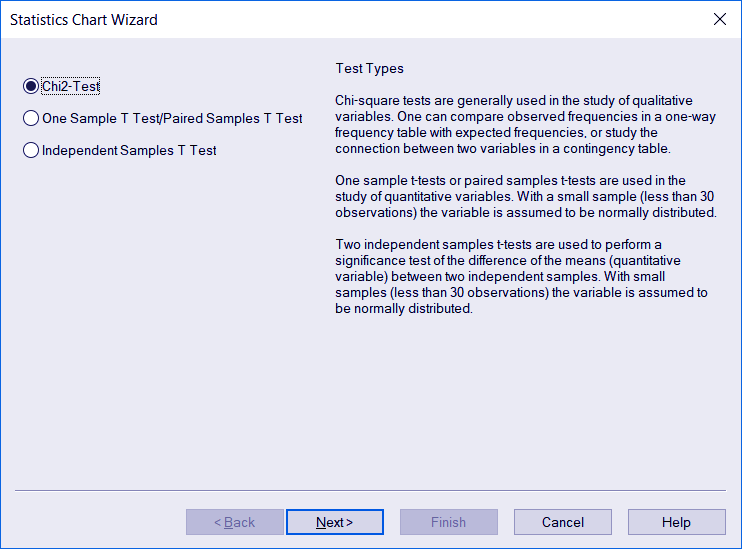
QlikView Statistics Chart Wizard – Chi Square Test
Follow this link to know about QlikView Time Chart
In the next step, you are asked to enter Column name, Row and Value you want to take in as test parameters. Click Finish once you make selections according to your requirements.
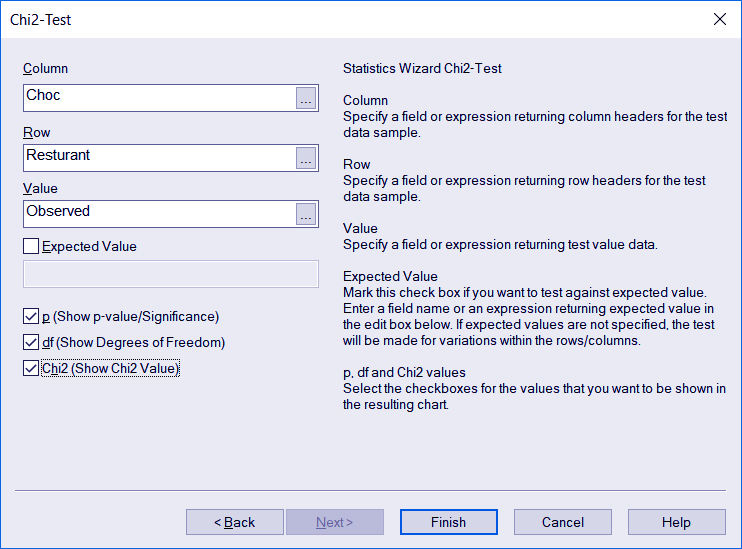
QlikView Statistics Chart Wizard – Chi Square Test
In the table given below is the description of each option given in this step.
| Column | For specifying the column headers or fields to be used in the test. |
| Row | For specifying the row names or headers to be used in the test. |
| Value | For specifying a field or expression which returns a test value. |
| Expected Value | For specifying an expected value that you want to conduct the test against. You can specify the expected value’s field or expression in the edit box provided. |
| P(Show p-value/ significance) | Check this box if you wish to include the p-value or significance value in the resultant chart. |
| Df(Show degrees of Freedom) | Check this box if you wish to include the df value or degrees of freedom value in the resultant chart. |
| Chi2 (Show Chi2 value) | Check this box if you wish to include the chi2 value which is the test value in the resultant chart. |
Before we proceed with viewing the chi2 test resultant table and interpret results from it. There is an important thing to do. This test is a statistical hypothesis test, so we need to make two hypotheses for this scenario.
The first hypothesis is that the two observations i.e. the feedback values for restaurant 1 and 2 are similar. Such hypotheses which assumes that no change/difference exists between the two data groups is also called a Null hypothesis. In our example, this hypothesis holds that two restaurants have a similar reputation.
The second hypothesis is that the two sets of observations are significantly different from each other. It is also called the Alternative hypothesis. In our example, this hypothesis holds that there is a difference between the reputation and likability of the two restaurants.
Do you know How to Create QlikView Macro?
Next, we select a Confidence level in percentage to state or mark the extent to which we are expecting an outcome.
Confidence level-95% is chosen for the first hypothesis i.e. we are 95% sure that there is no difference in the reputation of the two restaurants (null hypothesis).
And, the remaining 5% is for the second hypothesis which says that they do differ.
Now, let us look at the resultant table from the test.
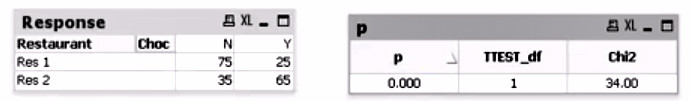
Chi Square Test in QlikView – Result
In this table, we got three results i.e. a ‘p’ value (probability), a ‘TEST_df’ value (degree of freedom) and a ‘chi2’ value. We will focus on the p-value for the result. If p-value falls between 0.06 to 0.95 then we must not reject the null hypothesis. Note that it does not indicate that the null hypothesis is entirely correct, rather it shows that the outcome stated in the null hypothesis is possible.
If the p-value falls between 0.00 to 0.05 then the second or alternative hypothesis consider correcting, rejecting the null hypothesis.
In the table given above with test results, the p-value is very small (it is not 0.00 but too small to display in a normal numeric format). This value of p is, however, greater than 0.00 and so it makes the second hypothesis true that restaurant 1 and restaurant 2 have different likability.
The result can also interpret using the chi value. For that, a reference table needs from which if we know the degree of freedom (df) and the confidence level, we can interpret the outcome of the test.
So, this was all about Chi Square Test in QlikView. Hope you like our explanation.
Conclusion
So, this was all about QlikView chi square test in statistical chart wizard. We saw how to conduct the test by stating two important and hypothesis and interpreting the test results to conclude with which hypothesis about the data you observed is true.
Furthermore, If you have any queries regarding Chi Square in QlikView, please drop them in the comment box below. We shall answer them to the best of our capabilities.
Related Topic – QlikView Synthetic Keys
Did we exceed your expectations?
If Yes, share your valuable feedback on Google


