Discovering and Analysing Data in QlikView – Selection & its Style
We offer you a brighter future with industry-ready online courses - Start Now!!
After reading How to Load Data in QlikView, now its time to Discovering and Analysing data in QlikView. In which we will learn about selection for data discovery in QlikView.
Along with this, we will learn the selection style and current select of discovering and analysing data in QlikView.
One of the areas of focus in QlikView’s functioning is discovering and analysing data.
If the data only gets loaded into QlikView’s memory and the user has no idea of what the best way is to discover and analyse the loaded data. All the information is of no use.
So, for the sake of extracting meaning out the information, discovering important aspects from the data and analysing the data is crucial.
So, let’s start Discovering and Analysing Data in QlikView.
Discovering and Analysing Data in QlikView – Selection & its Style
Discovering and Analysing Data in QlikView
In QlikView, the user deals with a plethora of data values and so getting to work with only that data which is relevant to your purpose of analysis.
The discovering and analysing data in QlikView is working with the data values of relevance and derive lucrative inferences from it.
The best way to discover important data is through making selections in the sheet objects you have created with the loaded data.
Once you have filtered out the unnecessary data and kept only the required one, you can carry different kinds of analysis on it.
You can do a routine analysis, an exploratory analysis or save the selections made as a bookmark in QlikView.
For instance, we have a sales record, having sales details over a period.
You can conduct some routine analysis on this sales data like checking the total sales per day or total sales status as compared to the same time last year, sales per region etc. Or, you can conduct exploratory analysis like comparative analysis, multiple sections etc.
Do you know the best practice for Data Modeling in QlikView?
QlikView Data Discovering & Analysing – Selection
The most important way of discovering and analysing data in QlikView is by making selections. A selection is said to be made by simply clicking on the data field value you want to focus on.
Discovering and Analysing Data in QlikView – Selection
Selections help the analyst to gain deeper insights into specific data values.
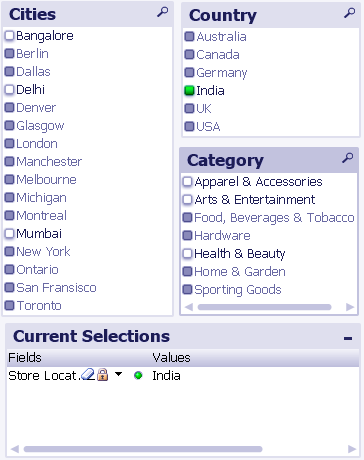
For instance, we have a sample document on store details. We have created a table box, and two list boxes (Country and Cities). Also, we have added a Current Selections box.
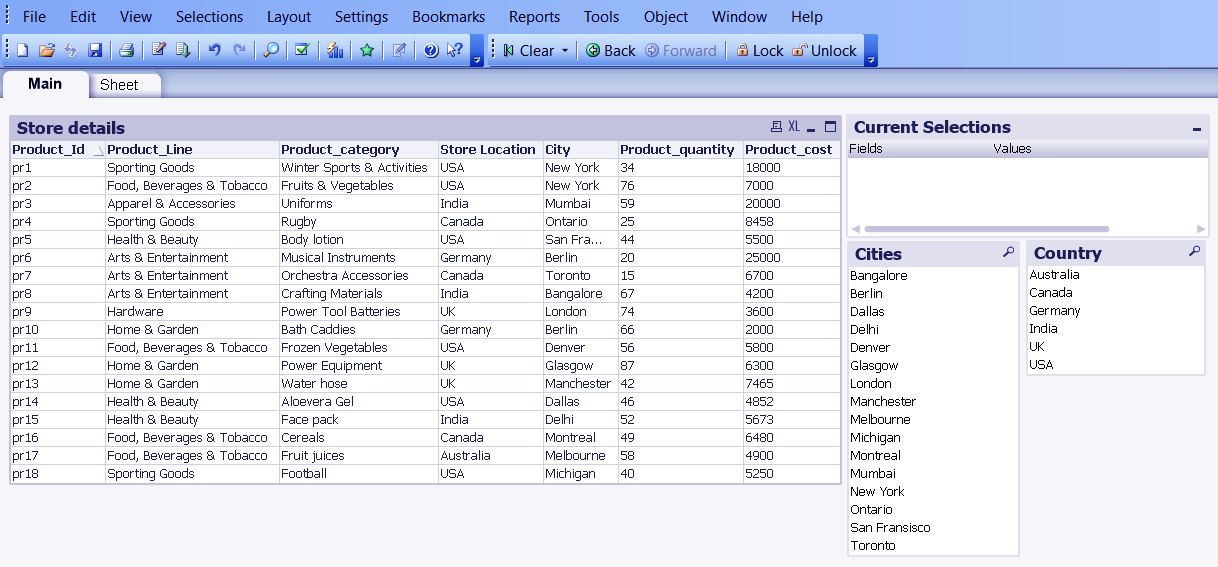
Discovering and Analysing Data in QlikView – Selection
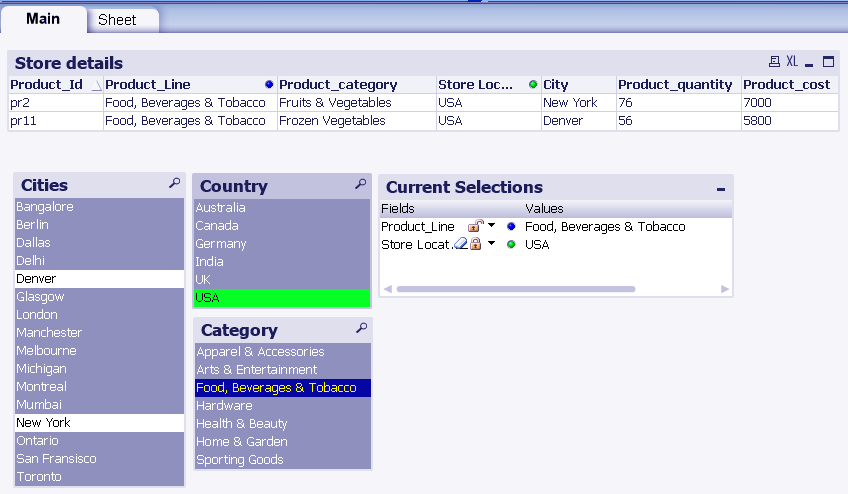
Now, if from this information, we need to see the store information related to the only USA, then we’ll make a selection on USA by clicking on the value name (USA) either in the table box or from the list box.
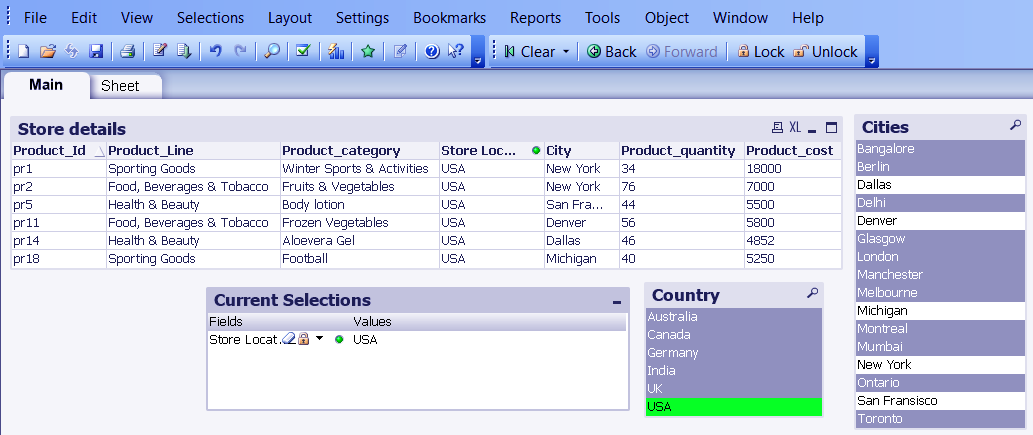
Discovering and Analysing Data in QlikView – Selection
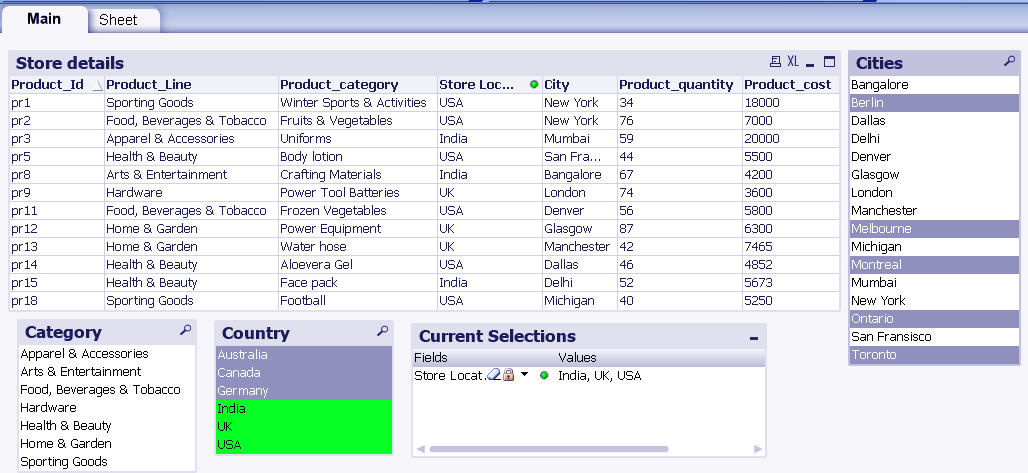
As you can see in the screenshot above, the filter applied on the data values through the selection made is indicated through colours.
The selected values or current selections appear in green, the optional field values appear in white and the excluded/ irrelevant values appear in grey.
These selections can manage from the Selections menu in the menu bar.
The current selections clear from Object> Clear or Clear All Selections. The state will return to normal and all the values will deselect.
a. Color Schemes
There is a color scheme set in QlikView to indicate what state a particular field value is in. Refer to the table below to see what each color indicates.
COLOR
SELECTION STATE
Green Active/current Selected values
White
Optional values
Grey
Excluded values
Blue
Locked values
Red
Forced exclusion values
Another way of indicting selections state is through Indicators, which are beacons appearing at different places (on sheet tabs, field name etc) to indicate selections.
Do you know How to Create QlikView Dashboard?
Discovering and Analysing Data in QlikView – Color Schemes
In the current selections box as well, the selection state is shown through indictor beacons of respective colors.
Also, if you have made a selection on one sheet and because of association, that selection ripples through and occurs in objects on a different sheet in the same document, then green indicator will be shown on the tab of the second sheet.
This makes the user aware that there are relevant selections made in other sheets also. If a selection is made on the data value, the field in which that value resides will also have an indicator in the field name cell.
b. Locking Selections
You can make selections one over other to drill further down into the data you are analysing.
But if you want the first or the selection made in a previous step to not change when you make new selection down the process, you can lock that selection. A selection can lock in several ways,
Through the Object menu in the menu bar.
Through the Selections menu in the menu bar.
The Current Selections box, by enabling the lock/unlock option. It displays a lock symbol in the current selections box, clicking on it you can lock/unlock a selection or field value.
Refer to the images given below to see how a selected field value is locked.
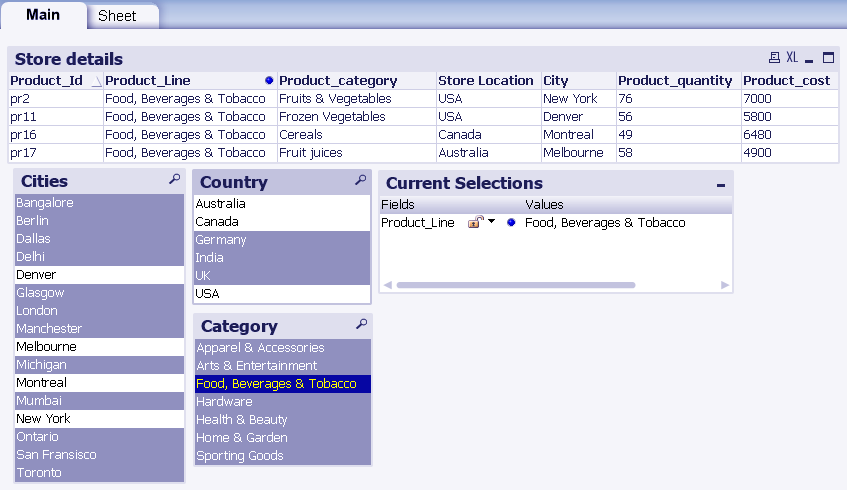
Discovering and Analysing Data in QlikView – Locking Selections
Discovering and Analysing Data in QlikView – Locking Selections
We selected and locked the value ‘Food, Beverages & Tobacco’. As you can see, the color indicating locking is blue. Now, if you make any other selection after locking that field, the locked field values will not change.
We recommend you to read – QlikView Ports
c. Moving Selections
Selections can move or navigate using the keyboard keys. Four keys use to go up and down in the field values.
Up Arrow
The up arrow key moves the selection one field value up in the list box.
Down Arrow
The down arrow moves the selection one field value down in the list box.
Page Up pg up
It moves the selection zone as per the number of values selected in the multiple selections.
By pressing the page up key, the selection will go up two field values i.e. on C and D.
Page Down pg dn
By pressing page down, the selection zone will go two values down, as per the two selections made on values E and F. Page down key will select two values below E and F i.e. G and H.
d. Multiple Selections
You can select multiple values in several ways.
By keeping the cursor at the field value, pressing and holding the mouse button and dragging the cursor down to the value you need.
Ctrl+click on the desired values.
Select the top value by clicking on it, then press Shift and click the bottom value of the list of values you want to select.
Enter the values through the text search of the list box and get all the required values selected.
Discovering and Analysing Data in QlikView – Moving Selections
QlikView Data Discovering & Analysing – Selection Style
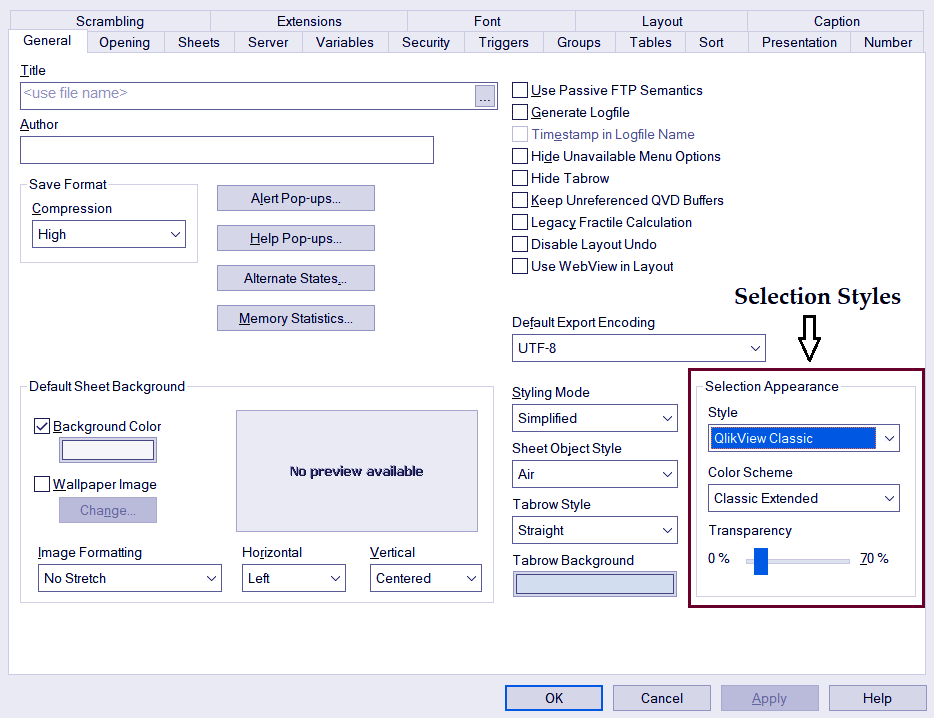
The selection styles are different ways or themes of displaying the sheet objects under the state of selection. There are five types of themes which can select from the Settings>Document properties>General tab.
At the bottom right of the general properties tab, is a section named ‘Selection Appearance’ from where you can select the Style and Color Scheme.
Within each style you can choose from several color scheme types; Classic, Extended classic, Forest, Spring, Lime, Light. These all are defined color schemes which vary in the shades of the color.
Discovering and Analysing Data in QlikView – Selection Style
Let us understand each selection style individually.
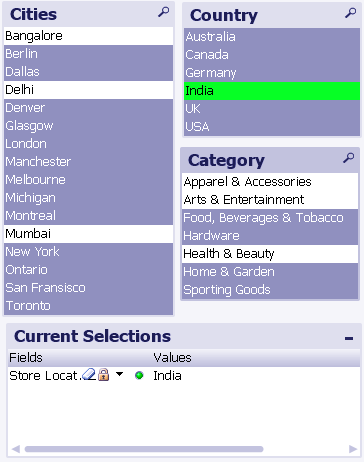
i. QlikView Classic
It is a default style using color codes. The selected values appear in green, available values in white and excluded values in grey.
Discovering and Analysing Data in QlikView – QlikView Classic
Follow this link to know different types of QlikView Search
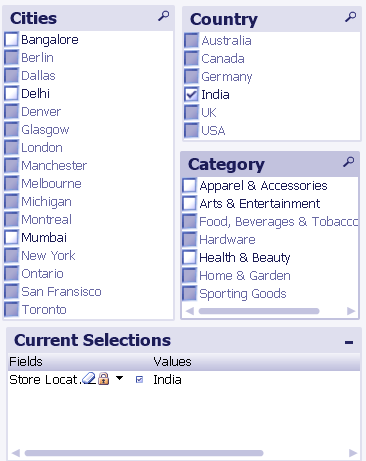
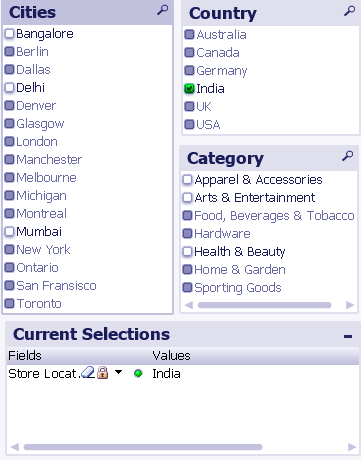
ii. Windows Checkboxes
This style used checkboxes similar to the windows theme and does not follow the color code. All the values will have checkboxes in front of them and when you select a field, a tick will appear in the checkbox.
This ticked checkbox is used in place of the green beacon of the QlikView classic style.
Discovering and Analysing Data – Windows Checkboxes
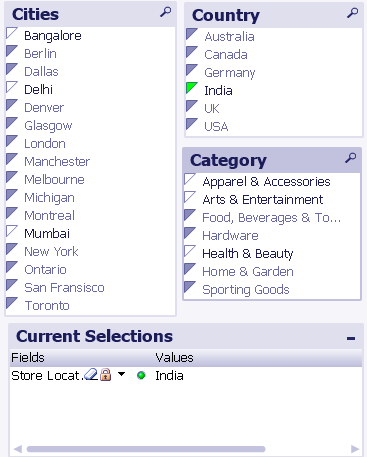
iii. Corner Tag
In this style, corner tags appear like the ones shown in the image below. This style also follows color code.
Discovering and Analysing Data in QlikView – Corner Tag
iv. LED
The LED style use green, white and grey squares to indicate the selection state.
Discovering and Analysing Data in QlikView – LED
Must Refer – QlikView Simple Network Management Protocol (SNMP)
v. LED Checkbox
The LED checkbox is a combination of LED and Windows checkbox styles where the ticks use in windows checkbox used to show selected field within the LED color-coded theme.
Discovering and Analysing Data in QlikView – LED Checkbox
QlikView Data Discovering & Analysing – Current Selection
The current selections boxes, use to keep a record of what selections made within a document. There two ways to see the current selections.
One is by making the Current Selection sheet object from Layout>New Sheet Object>Current Selection or by View>Current Selections menu on the menu bar.
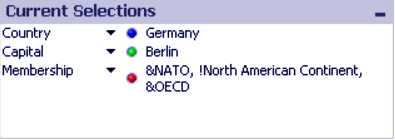
By making a current selection sheet object, you will get all the details relating to the values selected. The box shows field names, value names, color beacons/indicators. Also, clear and lock/unlock symbols if selected from the properties dialog.
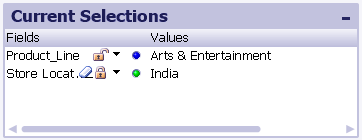
QlikView Discovering and Analysing Data – Current Selections
Another way to access a current selection dialog is through the View menu. This dialog also shows all the current selections and corresponding color indicators. You can work on your document with this window kept open. When you right click in this dialog box, a menu with some options will appear. The options are Clear All Selections, Lock All Selections, Unlock All Selections and Data. With the Data option, you can copy the value names and field names on the clipboard.
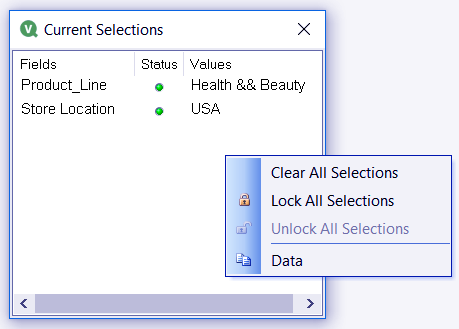
Discovering and Analysing Data in QlikView – Current Selections
So, this was all about discovering and analysing data in QlikView. Hope you like our explanation.
Conclusion
Hence, in this way, we wrap up our lesson on discovering and analysing data in QlikView. In addition, we discussed the selection, selection style, and current selection in discovering and analysing data in QlikView.
Furthermore, if you have any query, feel free to ask in the comment box.
Related Topic – QlikView Publisher Repository (QVPR)
Your 15 seconds will encourage us to work even harder
Please share your happy experience on Google


