Independent Sample T test – QlikView Statistics Chart Wizard
Interactive Online Courses: Elevate Skills & Succeed Enroll Now!
The last session ends on QlikView T-test. Here, we will explore an another Statistics Chart Wizard – Independent sample T test in QlikView.
It is different from the other T-tests in ways in which it evaluates the data sets and produces relevant results. Moreover, we will learn how to perform Independent Sample T-test on the data loaded into QlikView.
So, let’s start QlikView Independent Sample T test.
QlikView Independent Sample T text
Independent sample T test in QlikView is another type of T test and the third test option in the statistics chart wizard of QlikView.
An independent test tests two such sets of observations which are not related to each other or does not have the same origin.
Unlike in the dependent T test that we did in the earlier lessons, where we test two such observations that are related to each other. Let’s try to understand this through the example we used while doing paired (dependent) T test.
There, we tested the marks of the same set of students (dependent) in two different situations. But, it is not the same in the case of independent Sample T test.
We do not use the same set of items which gives us two different observations, but we will use distinct sets of items which are not related to each other per se.
Through this test, we can check whether the two independent observations follow the same pattern or are different from each other by evaluating their mean/averages.
Do you know What is QlikView Chi-Square Test?
How Independent Sample T test Works in QlikView?
To do an independent sample T test in QlikView, open the Statistics Chart Wizard from the Tools menu.
Now the sample data or observations we will be using here is based on the scenario given below,
In a school, there are two sections 9A and 9B. The section 9A by far holds the position to be better than 9B section in many ways. But, the administration wants to check the credibility of this assumption through the independent T test.
The marks of students in section 9A and 9B are given in the table below.
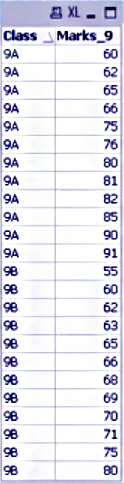
Sample Data
Now, based on this scenario, our two hypotheses would be,
The null hypothesis which says that both the sections are similar, and one is not superior than the other.
Whereas, the alternative hypothesis states that both sections are significantly different from each other.
To perform the test, select the Independent T test in the wizard and click Next.
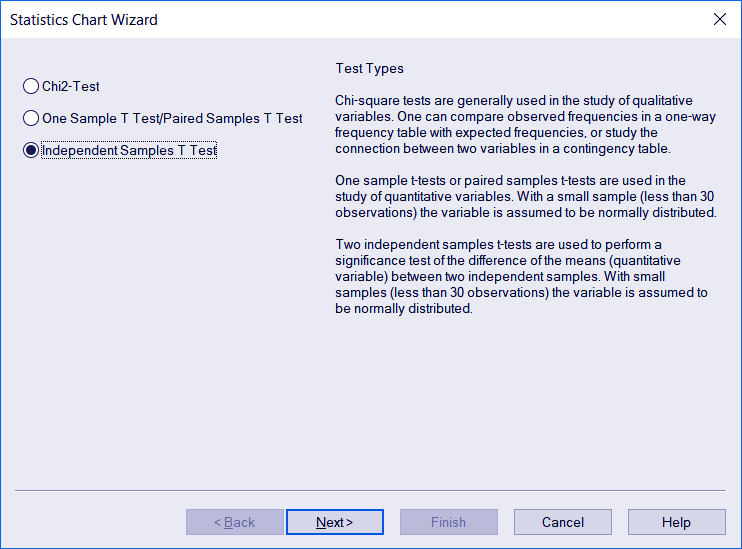
QlikView Statistics Chart Wizard – Independent Sample T test
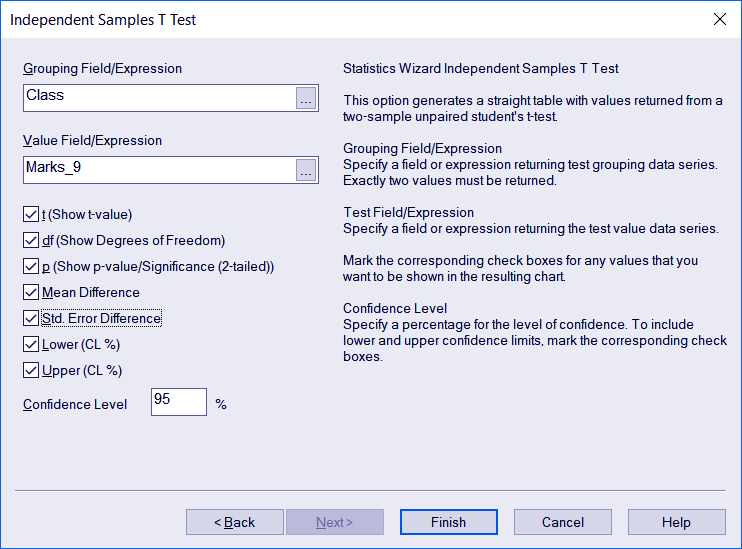
In the next dialog, enter the Grouping field or expression, we have entered the field as ‘Class’ from the table to group the marks of section 9A and 9B.
And, the test value will be ‘Marks_9’ which are the marks of students from the two sections.
We recommend you to read this Dollar Sign Expansion in QlikView
Independent Sample T test
The description of other test value options available on this step of the wizard are described in the table below.
Grouping Field/ Expression
Returns test grouping data series. This option returns exactly two values.
Value Field/Expression
Returns a test value series.
t (Show t-value)
For including the t-value in the resultant chart.
df (Show Degrees of Freedom) For including the df or Degrees of Freedom value in the resultant chart.
p (Show p-value / Significance (2-tailed)) For including the two-tailed p-value or significance in the resultant chart.
Mean difference
For including the mean difference value in the resulting chart.
Lower (CL%)
To set the lower limit of the level of confidence percentage.
Upper (CL%)
To set the upper limit of the level of confidence percentage.
Confidence Level
Specifies or sets the percentage for the level of confidence.
Click Finish to see the resultant table for independent Sample T test in QlikView.
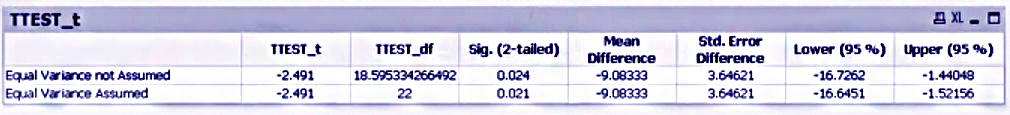
Independent Sample T test – QlikView Statistics Chart Wizard
As you can see in the table, we have two rows named ‘Equal variance not assumed’ and ‘Equal variance assumed’. Test values have been calculated separately for the two assumptions.
To infer the result, we refer the T table. We will need two values to be able to extract result from the T table i.e. the T test value and df (degree of freedom) value.
Also, we will have to decide a confidence level i.e. 95% in our case. Now, for both the assumptions made, T test value is the same which is, -2.491. But, the df is different, in one case it is around 19 and 22 in the other.
Do you know How to apply Trellis in Pie & Bar Charts in QlikView?
Pin the df values on the horizontal plane and pin 0.05 (two-tailed) in the vertical plane. In this example, we are analysing in a two-tailed manner i.e. we check of the value in a plus-minus range.
So, for the first assumption, we take 19 df and 0.05 in the two-tailed column and see the value at their intersection.
The value is ±2.093. Now, our T test value is -2.491 which falls out of the ±2.093 range hence rejecting the null hypothesis.
Same is the case with the value in the second assumption, where df is 22 and the T-table value comes to be ±2.074. In this case too the null hypothesis is rejected because -2.491 falls out of the given range.
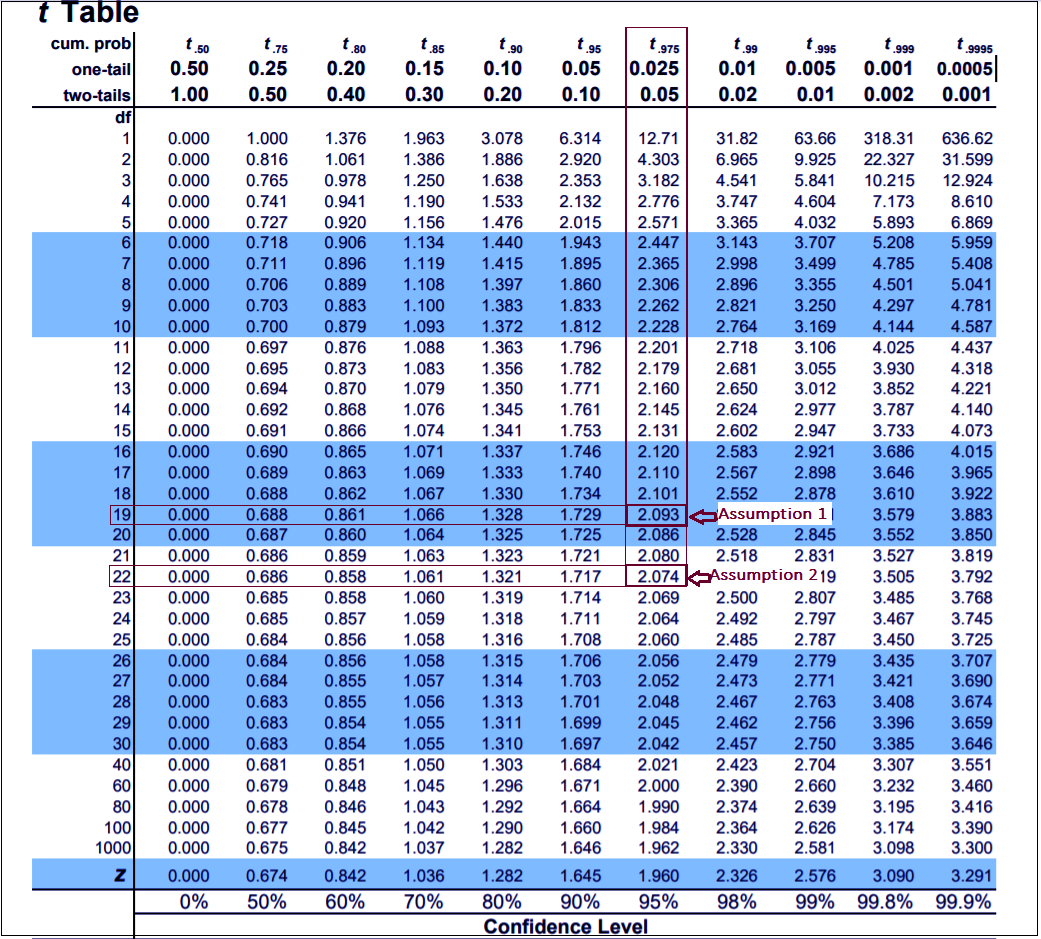
Independent Sample T test – T Table
Hence, from this QlikView Independent Sample T test we can conclude that the alternative hypothesis is correct that two sections are different from each other and probably sections 9A is still actually superior (although this test cannot prove this point).
So, this was all about Independent Sample T test in QlikView. Hope you like our explanation.
Conclusion
Hence, in this lesson, we learned about an important statistical test called QlikView Independent sample T test. In this test, the way you interpret the values in the T table and come to conclusion is very important.
You must keep in mind whether you want to do a one-tailed or a two-tailed test depending on the scenario you are testing the data in. Still, have a confusion, feel free to write us!
Related Topic – QlikView Themes
Did you like this article? If Yes, please give DataFlair 5 Stars on Google


