QlikView Rank Function – How to Use Peek & Rangesum Functions
Expert-led Courses: Transform Your Career – Enroll Now
In this QlikView Aggregate Function, we will learn about three important functions: QlikView Rank function, Peek Function and Rangesum Function. We will learn about each of them in separate sections with elaborate examples using real data.
So, let’s start with QlikView Rank Function.
QlikView Rank Function – How to Use Peek & Rangesum Functions
QlikView Rank Function
QlikView Rank function as the name suggests ranks field the expression according to the criteria you set in the code. We will understand this better while we go through our example. Rank function in QlikView basically returns the ranking values in the rows in front of the row expressions. You can analyze your data more efficiently by ranking it.
Do you know various kinds of QlikView Functions?
How to Apply QlikView Rank Function?
Follow the steps to apply QlikView Rank()function in Chart,
1. Step
We will load the CSV file Productrecords.csv into the load script.
LOAD Product_Id,
     Product_Line,
     Product_category,
     Product_quantity,
     Product_cost
FROM
[C:\Users\admin\Desktop\Dataflair\productrecord.csv]

(txt, codepage is 1252, embedded labels, delimiter is ',', msq)
2. Step
Reload the script and open CHART sheet object from LAYOUT. In the dialogue box now open, select the STRAIGHT TABLE from the chart types.
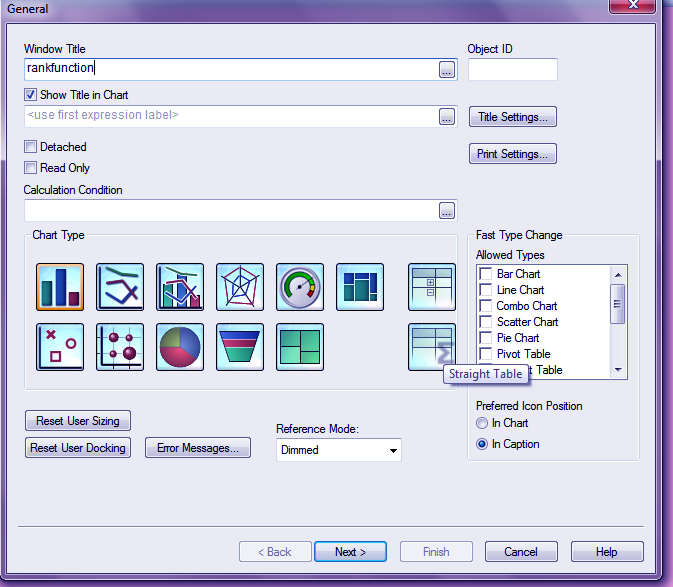
Step.2 To Apply QlikView Rank Function
Let’s Explore What is QlikView Join Functions?
3. Step
Click on NEXT, now you will have to select a dimension for your chart. We have selected Product_Line and have added it to the Dimensions. Click NEXT.
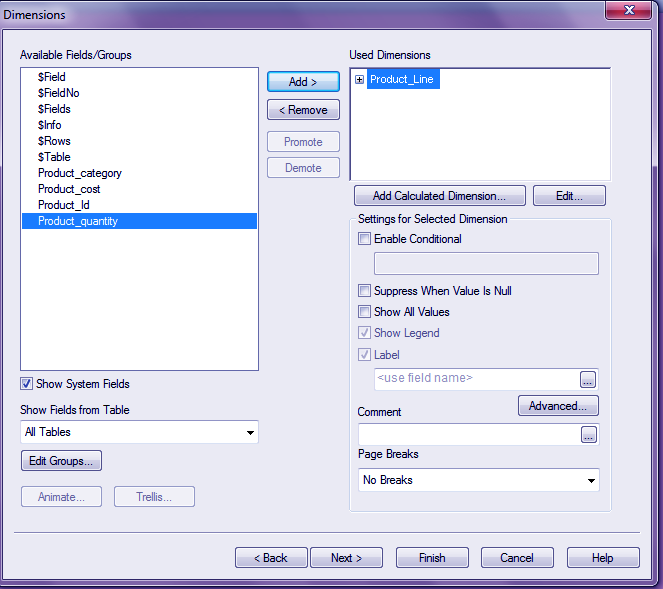
Step.3 To Apply QlikView Rank Function
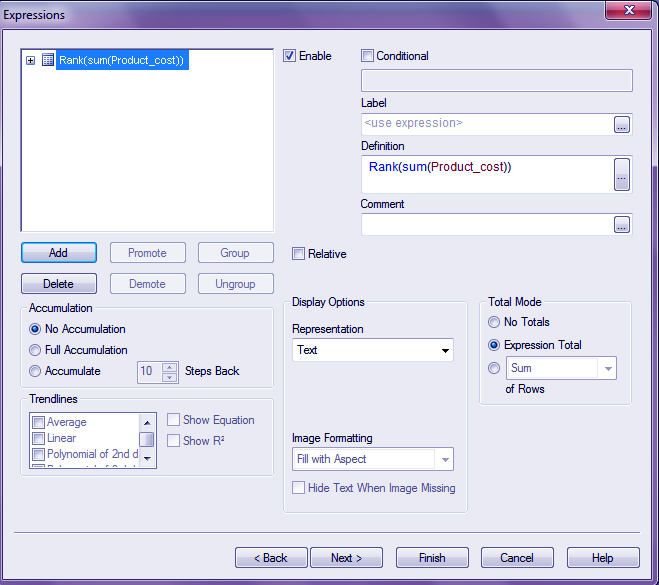
4. Step
Next will appear an Expression tab, where you have to select a RANK function from the FUNCTIONS tab or write it manually on the editor. Enter the expression for applying Rank function to the selected chart dimension. Here, in the expression, we wrote we want the ranking to be done of the sum of the cost of all the products sorted by the product line.
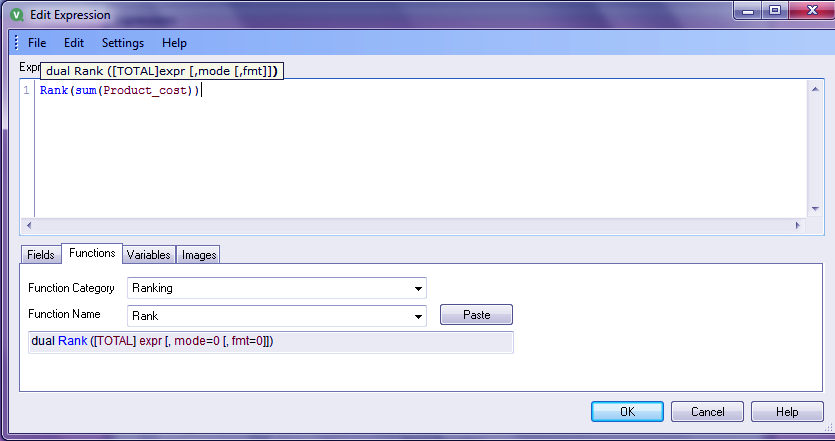
Step.4 To Apply QlikView Rank Function
5. Step
Click on FINISH.
Step.5 To Apply QlikView Rank Function
Must Refer – Left, Right, Inner Keep Functions
6. Step
You will have a final table displayed on the sheet having all the product lines ranked according to the sum of their sales or cost.
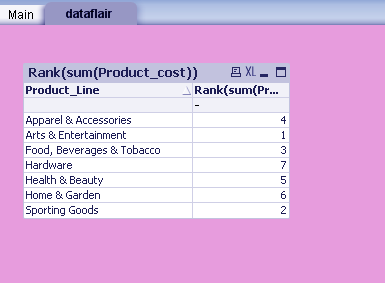
Step.6 To Apply QlikView Rank Function
You can also use a rank function within aggregate functions like Min, Max. The rank can be mentioned in the statement itself. Like Max (expression, rank), the rank can you mention will be criteria in the output. If you want the highest selling product line and its cost then you put the rank as 1.
LOAD
    Product_Line,
    max(Product_cost,1)
FROM
[C:\Users\admin\Desktop\Dataflair\productrecord.csv]

(txt, codepage is 1252, embedded labels, delimiter is ',', msq);

Group by Product_Line;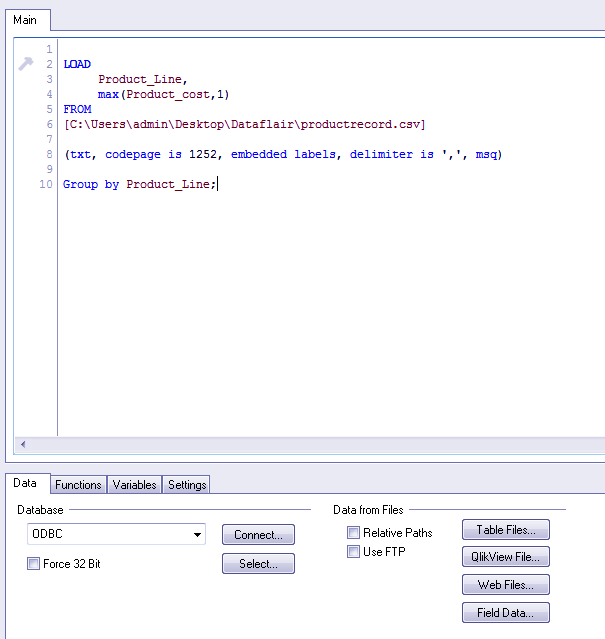
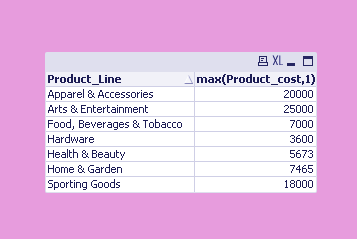
Step.8 To Apply QlikView Rank Function
Here, in the screenshot, as you can see, in front of each product line is the price of the highest sold item.
QlikView Peek Function
Through Peek Function in QlikView, you can get the data of one field or column, roll over in the next column for comparative or calculation purposes. For explanatory purposes we have taken a sample data file salesvol.csv.
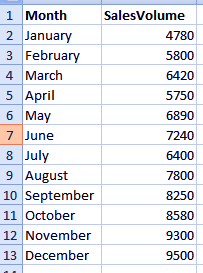
QlikView Peek Function – Sample
LCSV the CSV data file in Qlikview script. Open the script editor with CTRL+E or from the script editor symbol on the toolbar. Go to INSERT and load your data file from LOAD STATEMENT option. We will write the peek statement after loading the filed Month. Click OK and Reload the script.
LOAD Month,
     [SalesVolume],
     Peek(SalesVolume) as PreviousMonth
FROM
[C:\Users\admin\Desktop\Dataflair\Salesvol.csv]
(txt, codepage is 1252, embedded labels, delimiter is ',', msq);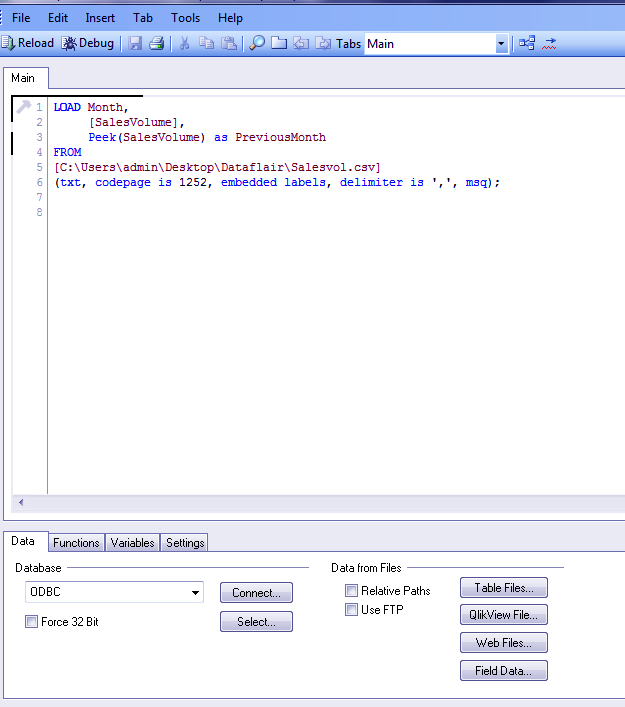
QlikView Peek Function – Load your Data
Follow this link to know about QlikView Data Files (QVD)
Next, we will create a sheet object, Table Box to see how the data is displayed and the peek function works.
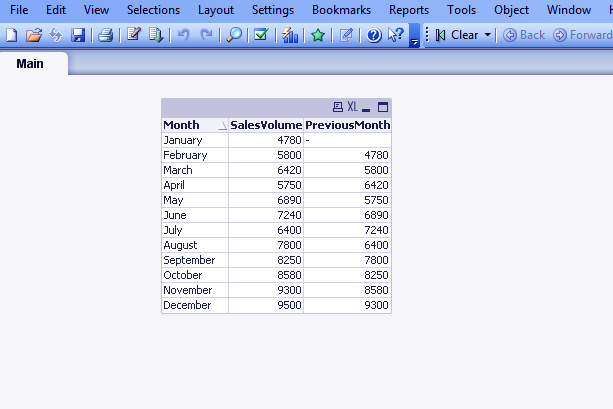
Sheet Object – QlikView Peek Function
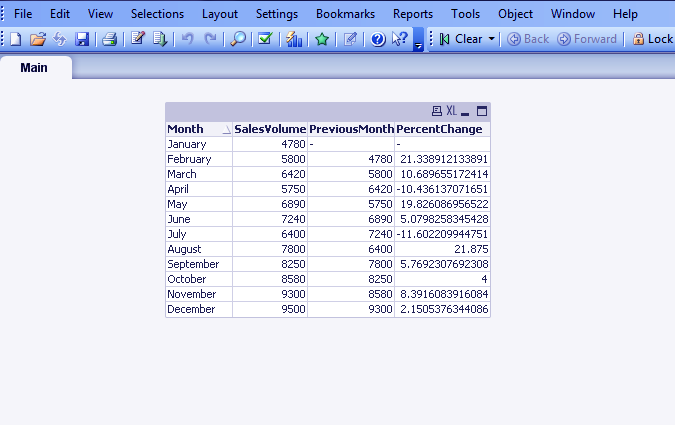
As you can see, a third column PreviousMonth is also displayed in the table as a result of the peek function. The sales volume from the month of January will be shown in front of February month in the PreviousMonth column.
You can also code for calculations to be made using the actual column and the column made by peek function. We have added the code to calculate Percent change per month in sales volume. The code for it is shown in the screenshot below.
LOAD Month,
     [SalesVolume],
     Peek(SalesVolume) as PreviousMonth,
     (([SalesVolume] - Peek(SalesVoulme))) / peek(SalesVoulme)*100 as PercentChange

FROM
[C:\Users\admin\Desktop\Dataflair\Salesvol.csv]
(txt, codepage is 1252, embedded labels, delimiter is ',', msq);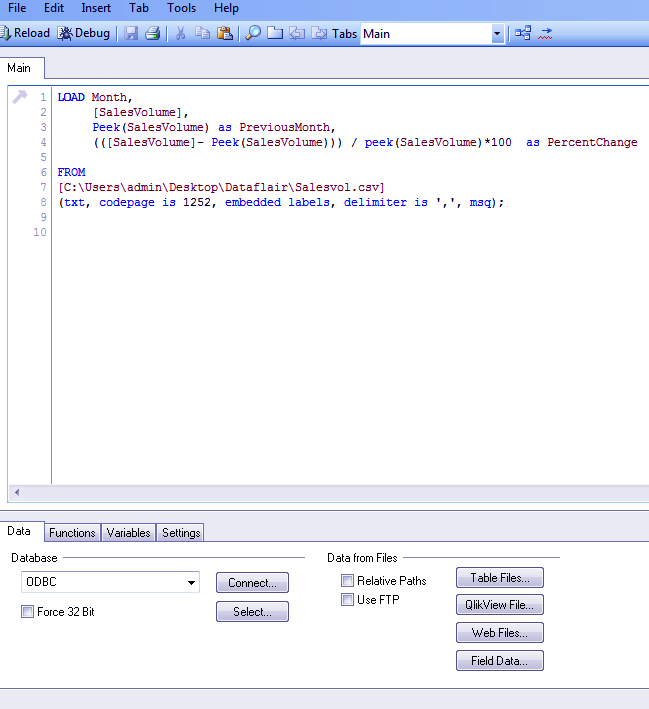
Peek Function in QlikView – Reloading the Script
After reloading this script, the table box will show the percent change for each month. Decreased percentage change indicate by a minus sign.
QlikView Peek Function – Table Box
You can apply many other such mathematical operations on through QlikView peek function.
Also, Read – QlikView Publisher Repository (QVPR)
QlikView Rangesum Function
Rangesum function in QlikView, use to calculate the sum of a selected set of data. Why this function when we already have SUM function? Well, SUM function might have some limitations. It can not apply on a select lot of data but the whole of it.
Whereas Rangesum can use according to your preference and can also apply within other function expression and can return the sum of the expression as well.
How to Use QlikView Rangesum() Function?
Load the script in the script editor and edit the code to apply the Rangesum function on the fields. In our data sample, we have applied rangesum function on the SalesVolume field and have also applied to peek function on SalesVolume field.
LOAD Month,
     [SalesVolume],
     RangeSum([SalesVolume], Peek('SalesVolume')) as Rollover

FROM
[C:\Users\admin\Desktop\Dataflair\Salesvol.csv]
(txt, codepage is 1252, embedded labels, delimiter is ',', msq);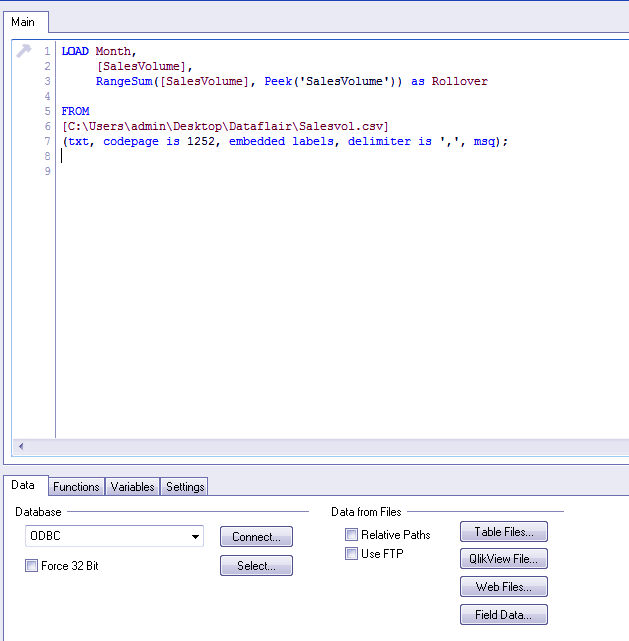
Step.1 How to Use QlikView Rangesum Functions
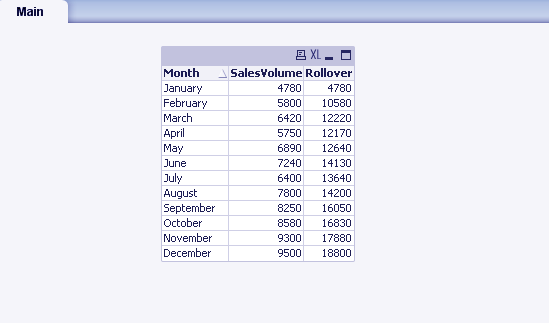
After creating the Table Box, we have a new column named Rollover as entered by us in the code. This Rollover column has the SalesVolume from each month which roll over to the next month along with it’s sum.
Step.2 How to Use QlikView Rangesum Functions
So, this was all about QlikView Function. Hope you like our explanation
Conclusion
All the three QlikView functions we saw, Rank, Peek and Rangesum, gives the user the convenience to apply these functions on data to gain meaningful insights from it. QlikView Rank function allows you to rank the data based on different criteria, QlikView Peek function gives you a column of data rolled over from the previous columns so that you can do a comparative analysis.
Wheres QlikView Rangesum function let’s you perform additions on the rolled over data value or any selected lot of data values. Furthermore, if you have any query, feel free to ask in the comment box.
Related Topic – QlikView Chart Expressions
We work very hard to provide you quality material
Could you take 15 seconds and share your happy experience on Google


