QlikView Circular Reference – Loosely Coupled Tables in QlikView
FREE Online Courses: Dive into Knowledge for Free. Learn More!
After studying QlikView Master Calendar. Here, we are going to study QlikView Circular Reference, in which we cover 3 major ways for resolving circular reference in Qlikview. Moreover, we will learn QlikView loosely coupled tables.
QlikView Circular References can encounter during the time of data analysis. This occurrence resembles in some ways with that of synthetic key’s scenario. Although the cause and cure to a circular reference are different from that of a synthetic key.
So, let’s start QlikView Circular Reference Tutorial.
What is Circular Reference in QlikView?
QlikView Circular References are loops that generate in QlikView’s data models in a situation when three or more tables can associate with each other through two or more ways or paths.
As we already know, that QlikView supports an associative data model which automatically links the tables having one or more fields in common. In the case of a circular reference, there are two or more than two common fields between three or more tables which creates an ambiguity in the logical structure and interpretation of data along with disrupting the data model.
Formation of a circular loop or reference must avoid as much as possible because they degrade the performance by creating a logically distorted data structure.
When a data with QlikView circular reference is viewed in a table, it gives incorrect and errored information. However, QlikView software detects the presence of a circular reference during script execution and prevents the original data from being corrupt.
Do you know the Properties of Documents in QlikView?
Let us consider a scenario where a QlikView circular reference creates. We load three tables into QlikView’s memory.
Table 1 – SalesRecords
Product_Id,Product_Line,Product_category,Product_quantity,Product_cost,Country
pr1,Sporting Goods,Winter Sports & Activities,34,18000,USA
pr2,”Food, Beverages & Tobacco”,Fruits & Vegetables,76,7000,USA
pr3,Apparel & Accessories,Uniforms,59,20000,India
pr4,Sporting Goods,Rugby,25,8458,Canada
pr5,Health & Beauty,Body Lotion,44,5500,USA
pr6,Arts & Entertainment,Musical Instruments,20,25000,Germany
pr7,Arts & Entertainment,Orchestra Accessories,15,6700,Canada
pr8,Arts & Entertainment,Crafting Materials,67,4200,India
pr9,Hardware,Power Tool Batteries,74,3600,UK
pr10,Home & Garden,Bath Caddies,66,2000,Germany
pr11,”Food, Beverages & Tobacco”,Frozen Vegetables,56,5800,USA
pr12,Home & Garden,Power Equipment,87,6300,UK
pr13,Home & Garden,Water hose,42,7465,UK
pr14,Health & Beauty,Aloe vera Gel,46,4852,USA
pr15,Health & Beauty,Face pack,52,5673,India
pr16,”Food, Beverages & Tobacco”,Cereals,49,6480,Canada
pr17,”Food, Beverages & Tobacco”,Fruit juices,58,4900,Australia
pr18,Sporting Goods,Football,40,5250,USA
Table 2 – CountryCIty
Country, City
USA, New York
USA, New York
India, Mumbai
Canada, Ontario
USA, San Fransisco
Germany, Berlin
Canada, Toronto
India, Bangalore
UK, London
Germany, Berlin
USA, Denver
UK, Glasgow
UK, Manchester
USA, Dallas
India, Delhi
Canada, Montreal
Australia, Melbourne
USA, Michigan
Also, See QlikView Star Schema
Table 3 – Product line & City
Product_Line, City
Sporting Goods, New York
Food & Beverages, New York
Apparel & Accessories, Mumbai
Sporting Goods, Ontario
Health & Beauty, San Fransisco
Arts & Entertainment,Berlin
Arts & Entertainment,Toronto
Arts & Entertainment, Bangalore
Hardware, London
Home & Garden, Berlin
Food & Beverages, Denver
Home & Garden, Glasgow
Home & Garden, Manchester
Health & Beauty, Dallas
Health & Beauty, Delhi
Food & Beverages, Montreal
Food & Beverages, Melbourne
Sporting Goods, Michigan
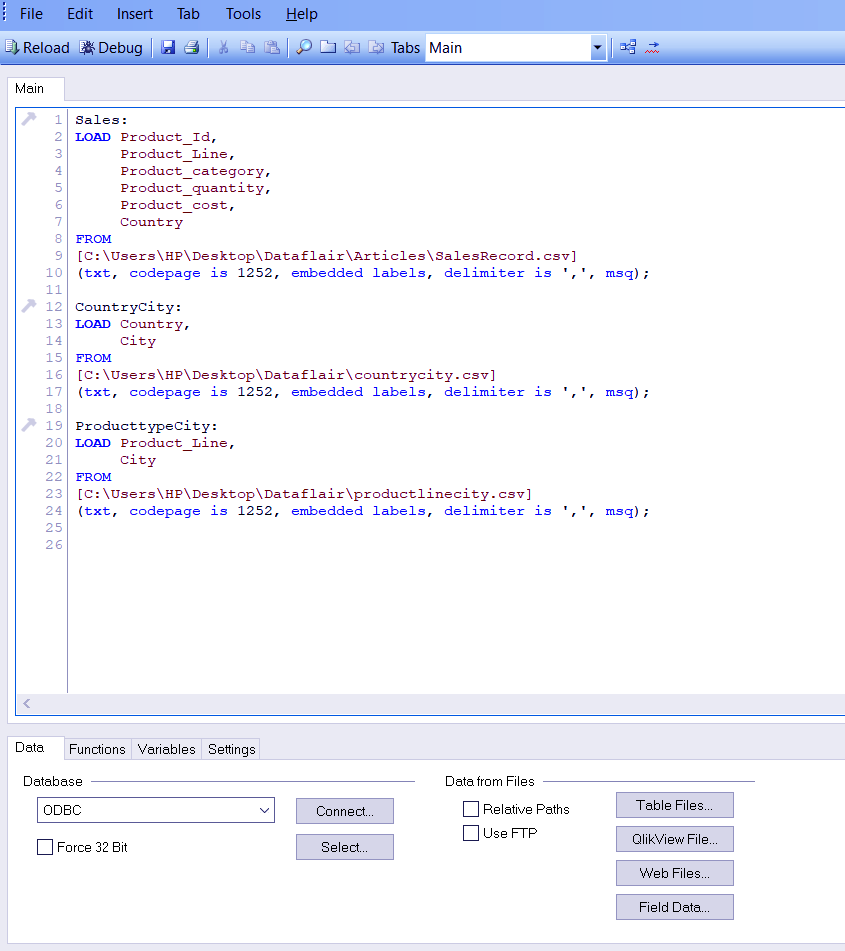
Now if you pay attention to the field heading of table 2 and 3, you will see that they have the field ‘City’ in common. This will cause a circular loop. Next, we will load these files into a script.
Sales:
LOAD Product_Id,
     Product_Line,
     Product_category,
     Product_quantity,
     Product_cost,
     Country
FROM
[C:\Users\HP\Desktop\Dataflair\Articles\SalesRecord.csv]
(txt, codepage is 1252, embedded labels, delimiter is ',', msq);

CountryCity:
LOAD Country,
     City
FROM
[C:\Users\HP\Desktop\Dataflair\countrycity.csv]
(txt, codepage is 1252, embedded labels, delimiter is ',', msq);

ProducttypeCity:
LOAD Product_Line,
     City
FROM
[C:\Users\HP\Desktop\Dataflair\productlinecity.csv]
(txt, codepage is 1252, embedded labels, delimiter is ',', msq);Follow this link to know How to Make – Bar, Pie & Text Box
As soon as you load the script and save it, you will get an error message warning you of the loop detection and comprehension ambiguities caused by the same.
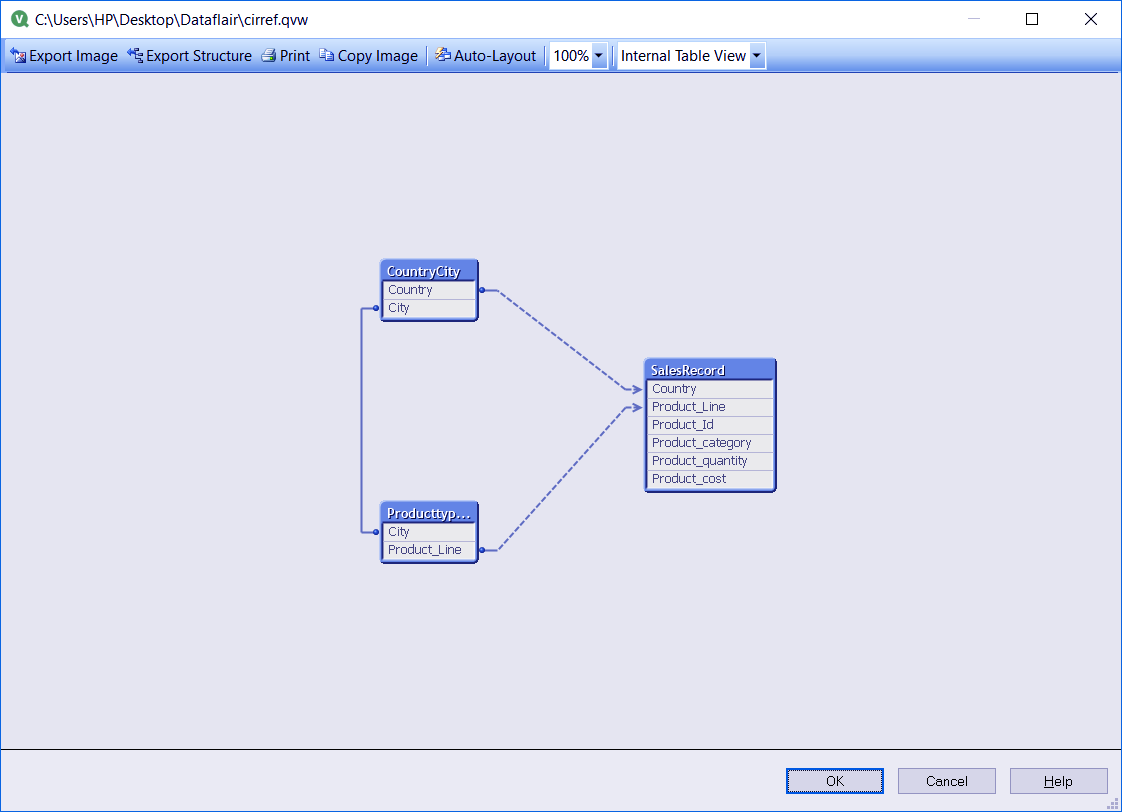
The table structure, invoked by CTRL+T, will look like that shown in the screenshot attached below. This is the table structure when tables are caught in a loop. There are three different pathways between these three tables, which are,
Table SalesRecord is linked to table CountryCity by the key field ‘Country’.
Table SalesRecord is also linked with the table ProductlineCity by the key field ‘Product_Line’.
Also, the third connection is between Table CountryCity(Table2) and ProductlineCity(Table3) with the field ‘City’.
Thus, this setup will form a QlikView circular reference as Table1 (SalesRecord) can connect to Table2 via Table3 creating a loop. To counter this situation, QlikView automatically makes at least one of the three tables (usually the longest table or a fact table) loosely-coupled.
Let’s Explore the QlikView Join Functions with its types & Practical Examples
What are Loosely Coupled Tables in QlikView?
A QlikView loosely coupled table is a table which does not follow the logical structure of data properly. QlikView automatically creates one or more tables as loosely-coupled to cut the logical association between tables forming a circular loop.
As the loosely-coupled table cannot function according to the associative data model it will automatically break the loop and weaken the circular reference in QlikView. The tables can also manually made loosely-coupled by adding a code line after loading the table into the script-
Loosen Table SalesRecords;
Consider the three tables shown in the image below and observe the pattern of association between the three of them.
When these three tables are associated normally, they will react upon making a selection like the way shown the image below. You can notice how the data filters travel like a ripple from one table to another making them display only relevant values.
Next, we will see what happens when we make the Table2 loosely-coupled. Upon making the selection ‘2’ in table one, the logic did not flow through the table2 as it did earlier but shows ambiguous results.
This shows that the association between columns A and C in Table2 is been disrupted by loose-coupling. Thus, the table box will show all possible results between the values when the selection is made.
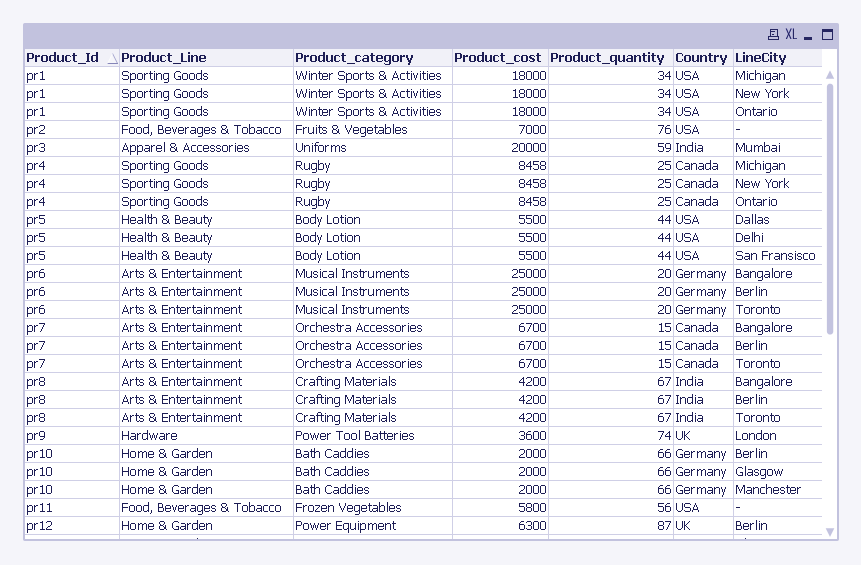
Same happened with the data files we loaded having the circular reference in QlikView, one of them was made loosely-coupled and displayed data with the same ambiguity as we saw earlier. Each Product_ID is been shown three to four times as the table box is showing all possible combinations between data values.
Ways to resolve QlikView Circular Reference
With the help of the three ways mentioned below, you can remove the QlikView circular reference or loop formed between tables.
Follow this link to know about QlikView Navigation Pane
i. Renaming
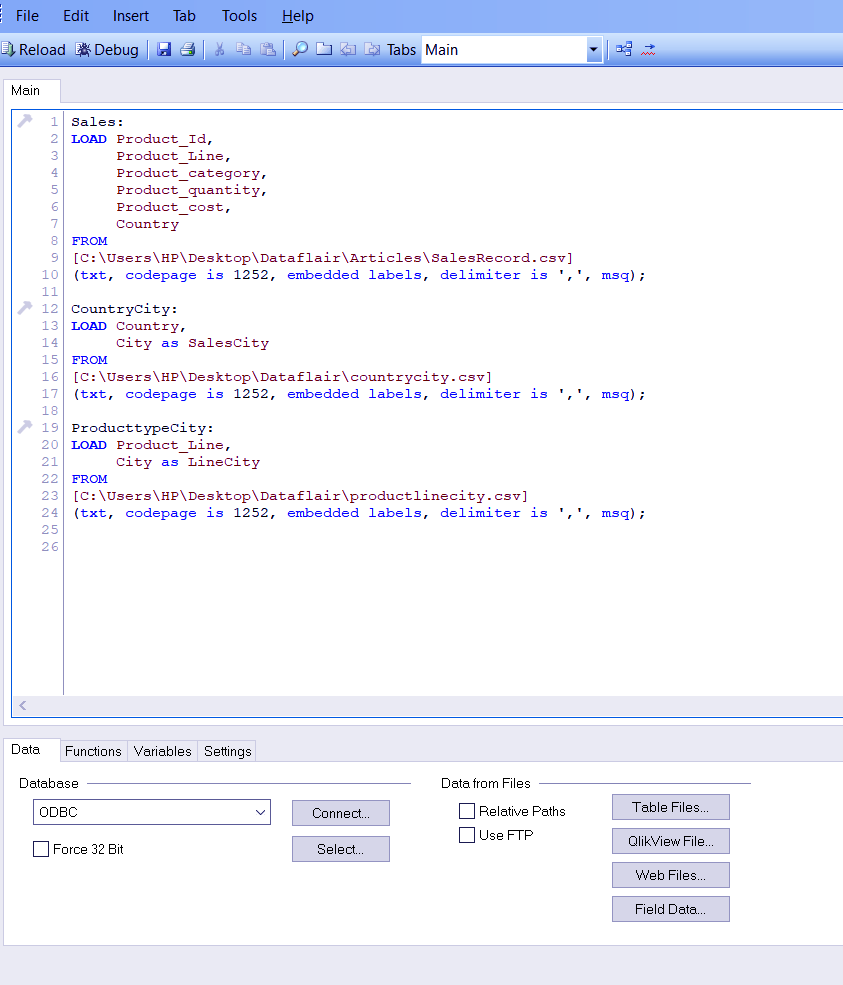
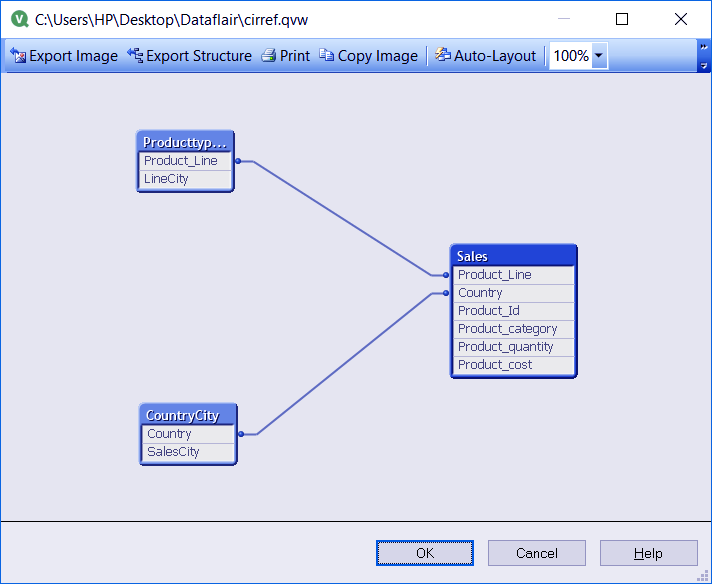
As we know in the data sets we have used, the field ‘City’ was the cause of circular reference in QlikView. One way to resolve this problem is by renaming the field ‘city’ (or whichever field is causing CR in your case) so that the system interprets it as two different fields.
Sales:
LOAD Product_Id,
     Product_Line,
     Product_category,
     Product_quantity,
     Product_cost,
     Country
FROM
[C:\Users\HP\Desktop\Dataflair\Articles\SalesRecord.csv]
(txt, codepage is 1252, embedded labels, delimiter is ',', msq);

CountryCity:
LOAD Country,
     City as SalesCity
FROM
[C:\Users\HP\Desktop\Dataflair\countrycity.csv]
(txt, codepage is 1252, embedded labels, delimiter is ',', msq);

ProducttypeCity:
LOAD Product_Line,
     City as LineCity
FROM
[C:\Users\HP\Desktop\Dataflair\productlinecity.csv]
(txt, codepage is 1252, embedded labels, delimiter is ',', msq);If you check the table structure (CTRL+T) after renaming the fields, you will find that the QlikView circular reference has been removed.
Do you know the Difference between QlikView and Tableau?
ii. Concatenating
If the data files in use have rows or data values in common, then concatenate function can use to merge the repetitive data values and form one single table eliminating circular reference in QlikView. However, if the tables do not have common rows or fields but have distinct values rather, the link function proves to more useful.
iii. Link Tables
Linking tables is useful when there are multiple fact tables with distinct fields. Multiple fact tables link with each other by adding a specific code. Firstly, all the key fields in a table are taken to form a composite key. Then a new table called ‘Link Table’ is made using the composite keys and other common fields. After that, the original fields from each table drop so as that the fields from the newly formed Link Table only remains.
So, this was all about QlikView Circular Reference Tutorial. Hope you like our explanation.
Conclusion
Hence, we studied the QlikView circular reference is the situation when synthetic keys are formed, in that case, all the loaded files have at least one field in common. However, the resolving methods, in that case, are also similar to those of QlikView circular reference we just discussed.
A user must take care and formulate data files keeping in mind to avoid causing a circular reference in QlikView. Furthermore, if you have any query, feel free to ask in the comment section.
Related Topic – QlikView Certificate Exams
Did you like this article? If Yes, please give DataFlair 5 Stars on Google
