QliK Sense Managing Data – Viewing & Loading
We offer you a brighter future with industry-ready online courses - Start Now!!
1. Objective
Earlier, we discussed Qlik Sense Script Syntax. Today, we will see Qlik Sense Managing Data. In this lesson, we are going to discuss how data is managed in Qlik Sense using various managing tools provided. We will learn about how to add and manage data from the data manager, how to connect to different data sources, and how to load data using the data load script. At last, we will see, how can a user view the entire data structure or data model.
So, let’s start Qlik Sense Managing Data Tutorial.
QliK Sense Managing Data – Viewing & Loading
2. Qlik Sense Managing Data With the Data Manager
In the explore menu present on the left of the sheet, you get an option called Data manager. Using the data manager, you can add data from different data sources like device files, or Qlik DataMarket or can enter data in the app itself as inline data. After adding data, you can manage the data tables and the associations between them through the data manager.
Have a look at Qlik Sense System Functions
To open the data manager, go to the exploration menu and select the Data manager option.
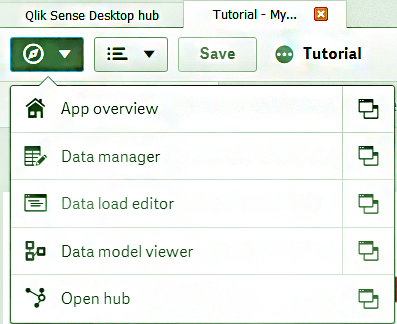
Open Data Manager
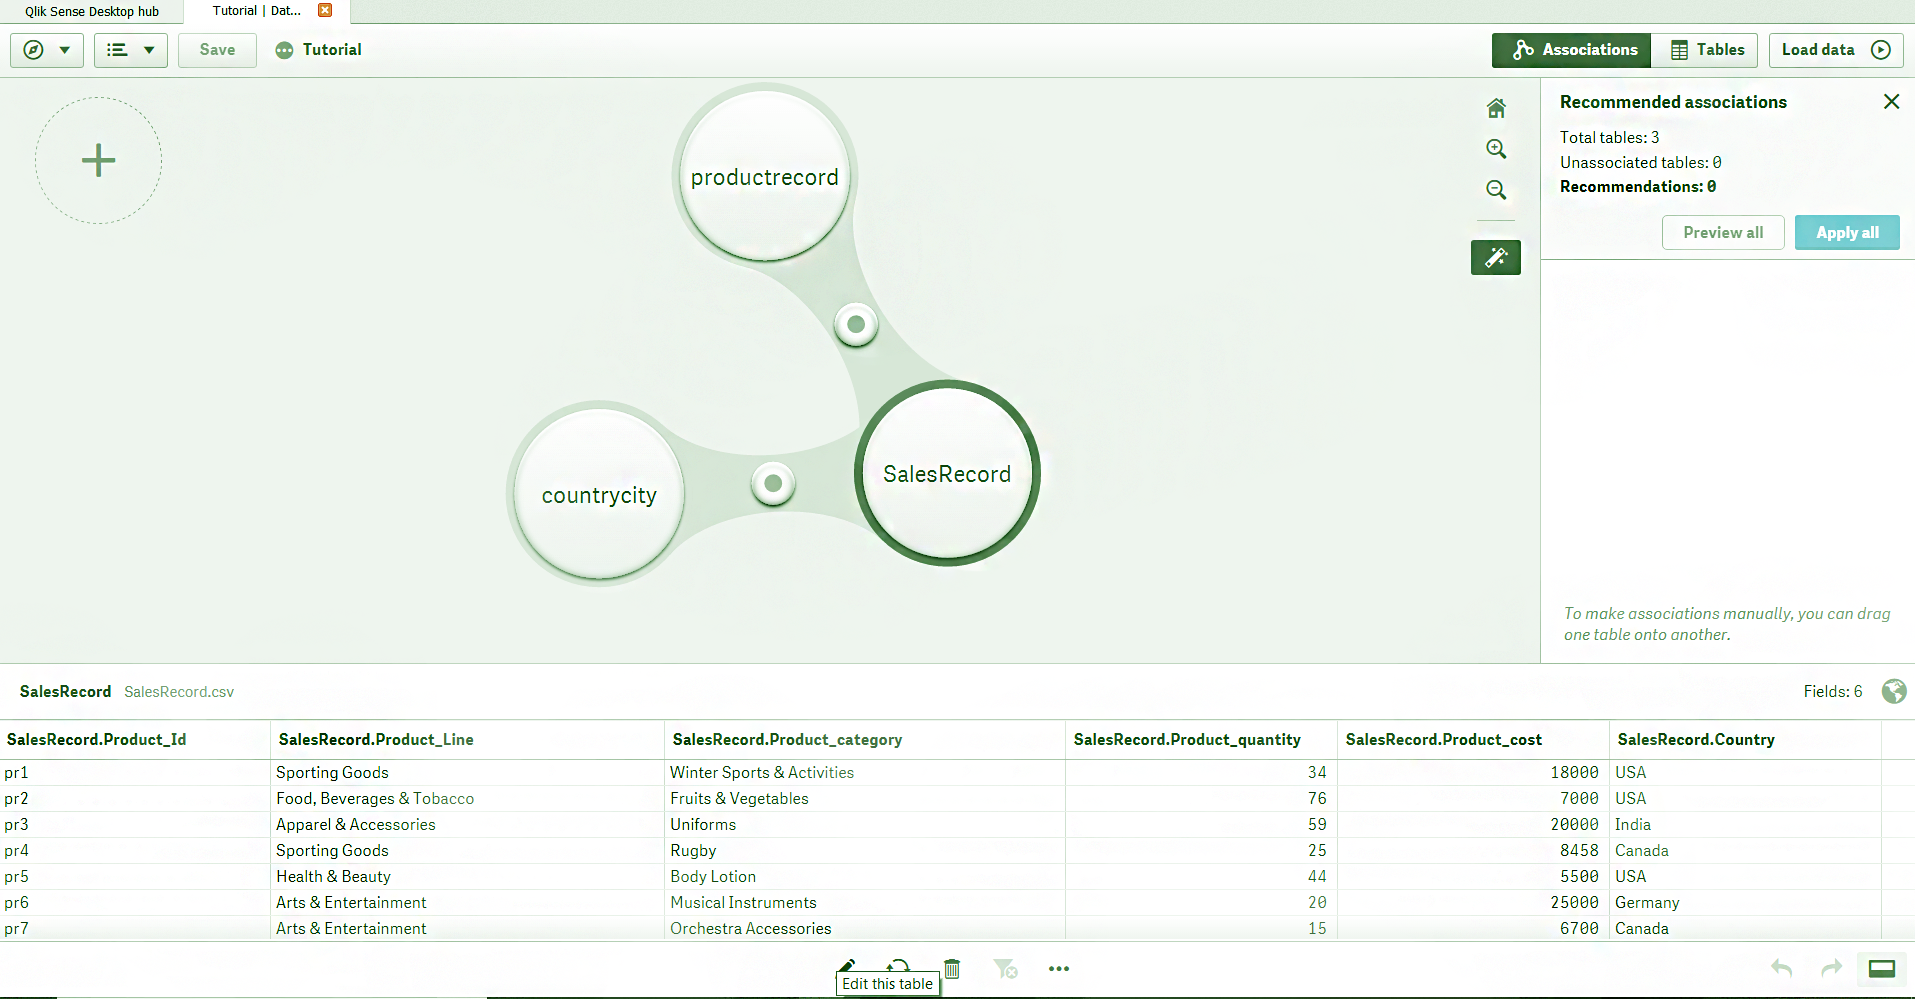
The data manager opens with the existing loaded tables showing the associations between them at the center. Below the associations section is the preview pane where the contents of the selected table(s) are shown as tables.
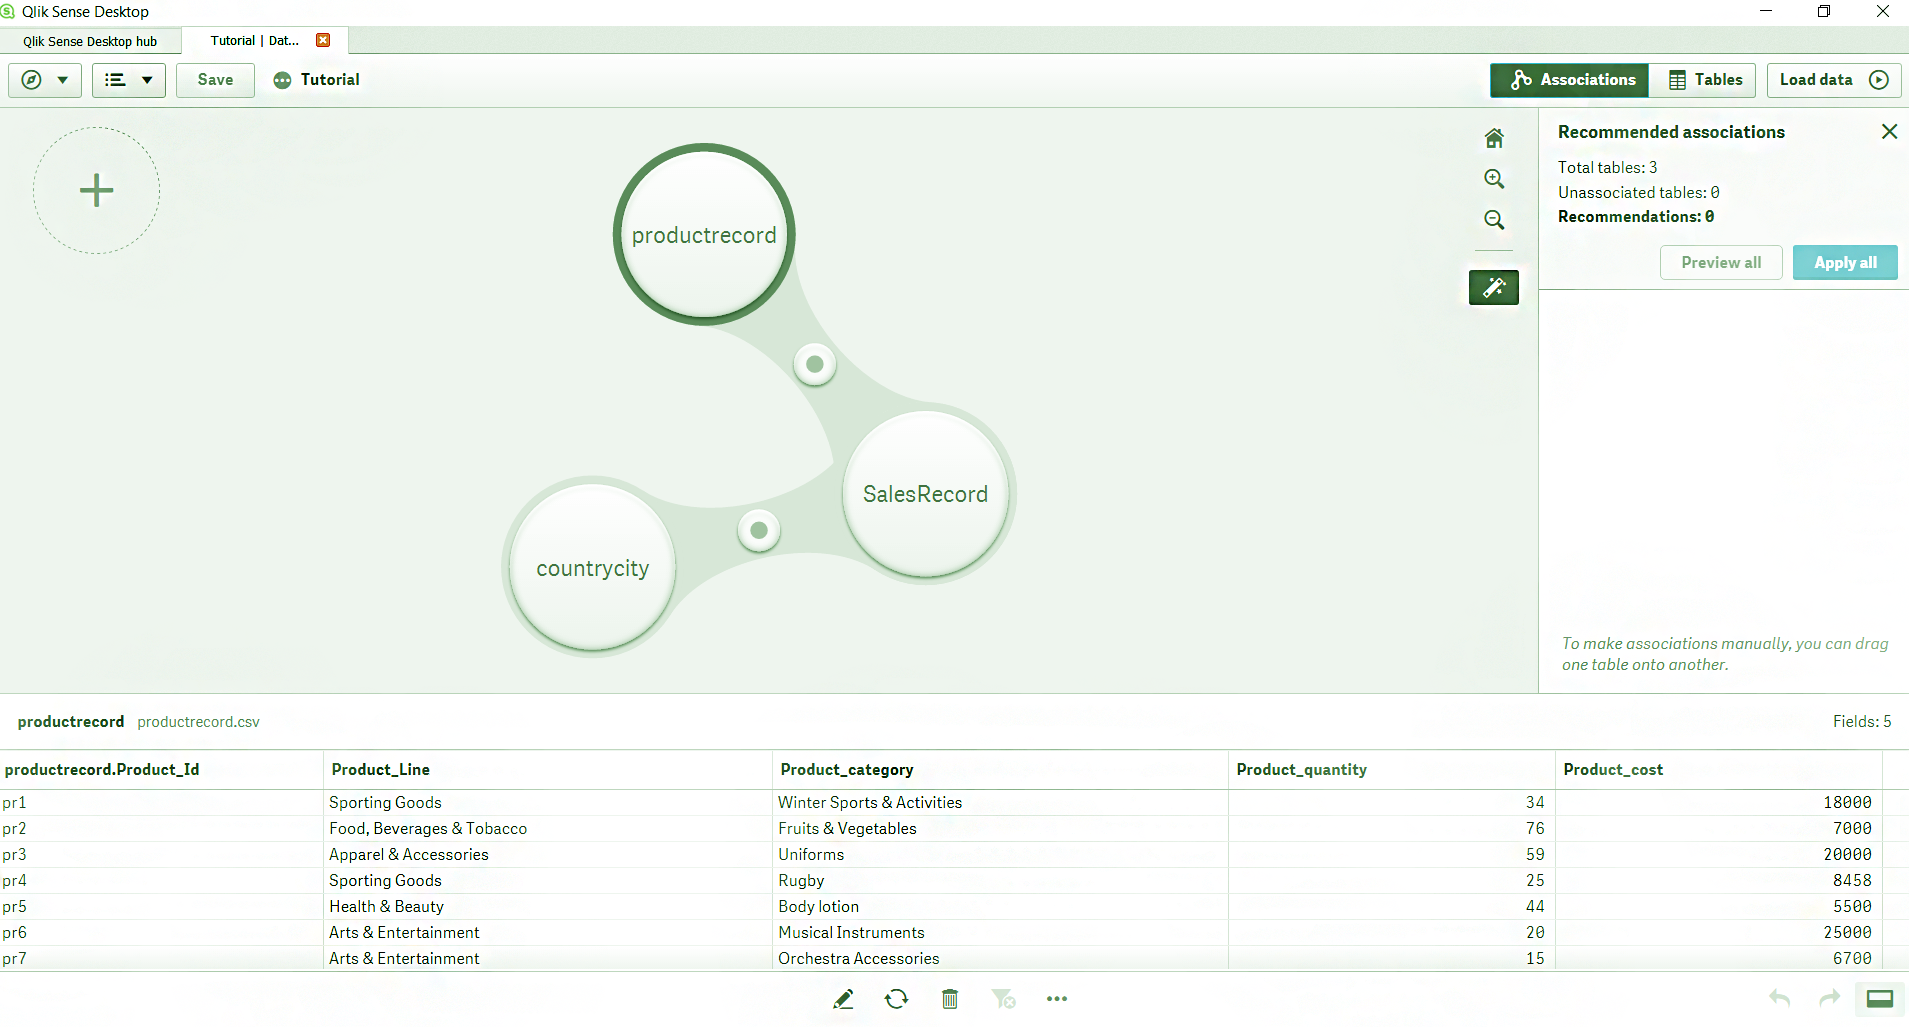
View Loaded Data Tables
You can view loaded data tables or data files in two views, namely, Associations and Tables.
Do you know about Qlik Sense Selections
In the associations view, you can see the existing associations between the data tables and edit them as well. The software recommends how good is or will an association between two data tables be. This is indicated by a color-coded recommendation, i.e. green for a strong recommendation, orange for moderate and red for a poor recommendation. You can make associations between table (if they have some fields in common) by dragging the table head towards the another until a bridge between them is made.
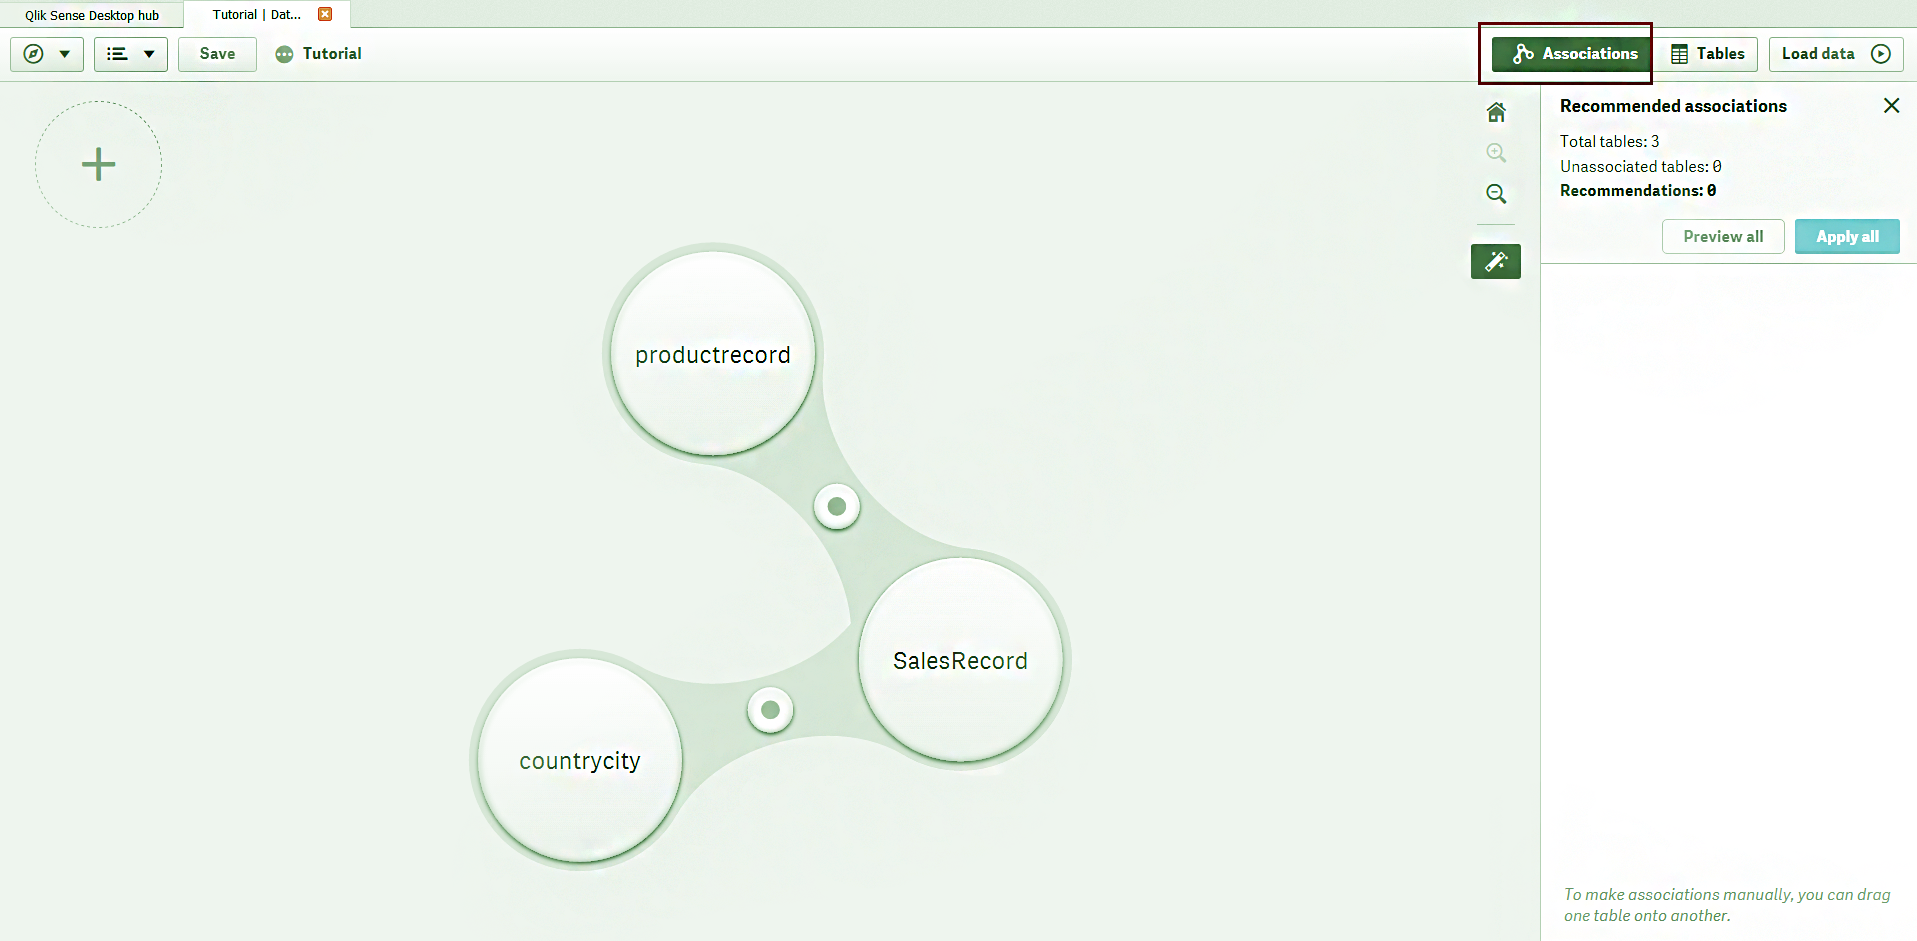
Make Associations Between Table
In the table view, all the data tables are shown separately.
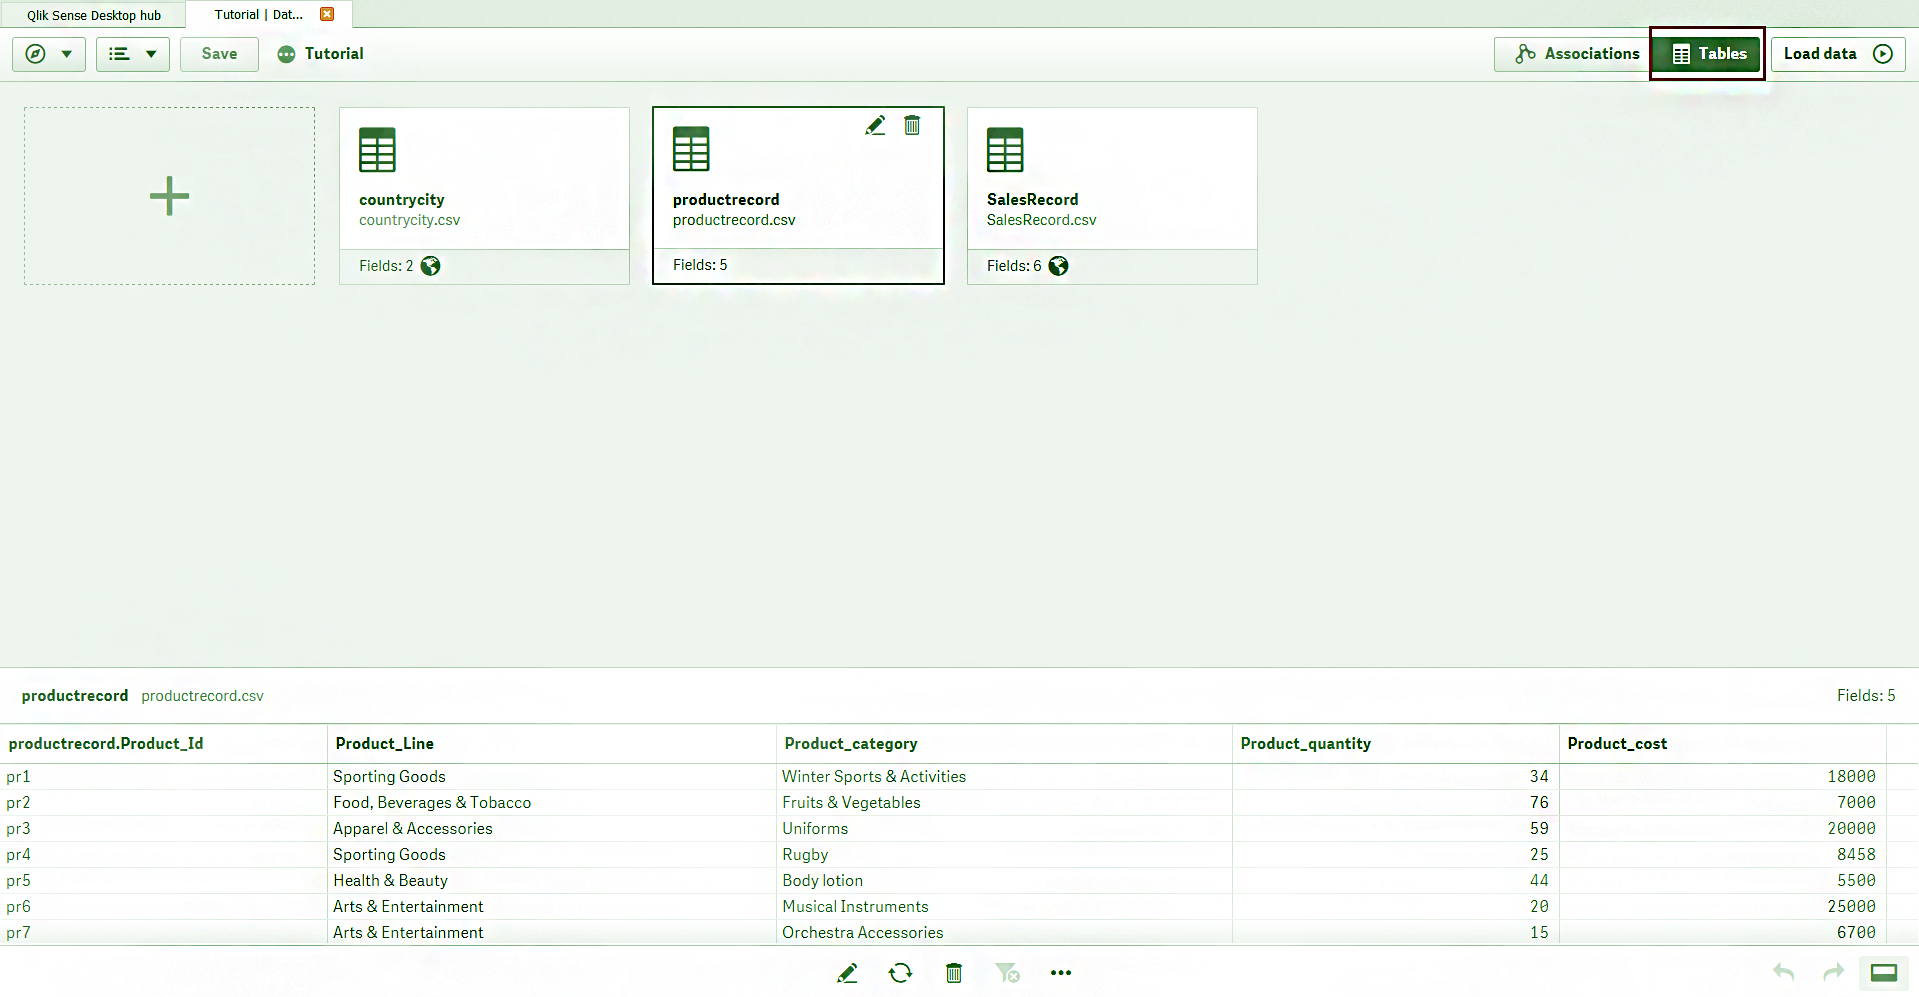
Qlik Sense Managing Data – Table View
Recommended Reading – Qlik Sense Geospatial Function
a. How to add a Data Table?
You can add a new data table in the data manager in two ways.
- By the plus icon given on the top left.
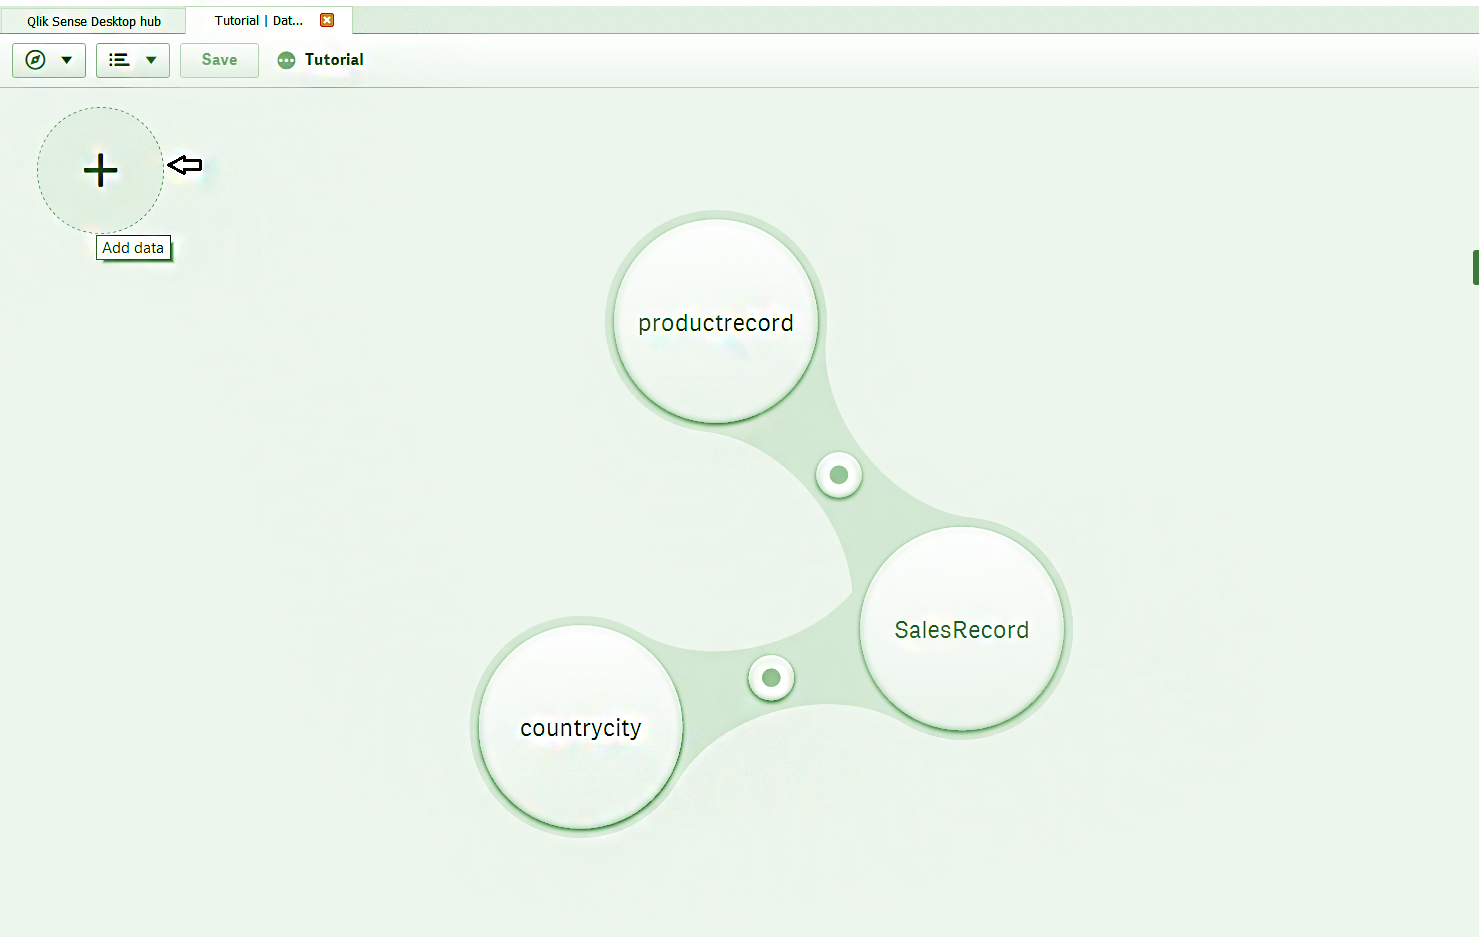
Add a Data Table
- By the Add data option given in the menu present on the toolbar.
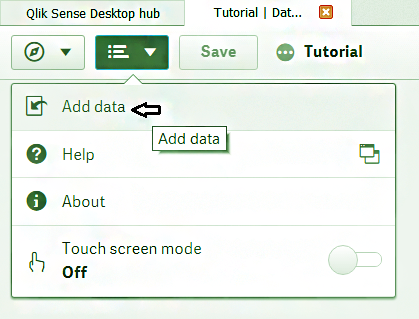
Add Data in the Table
You can add data from three types of sources.
- In-app, where you can manually enter data in an excel-like entry column.
- Data connections are all the user or administer defined data sources which reside in your system.
- Data content which are the Qlik DataMarket databases.
You must read Qlik Sense Statistical Functions
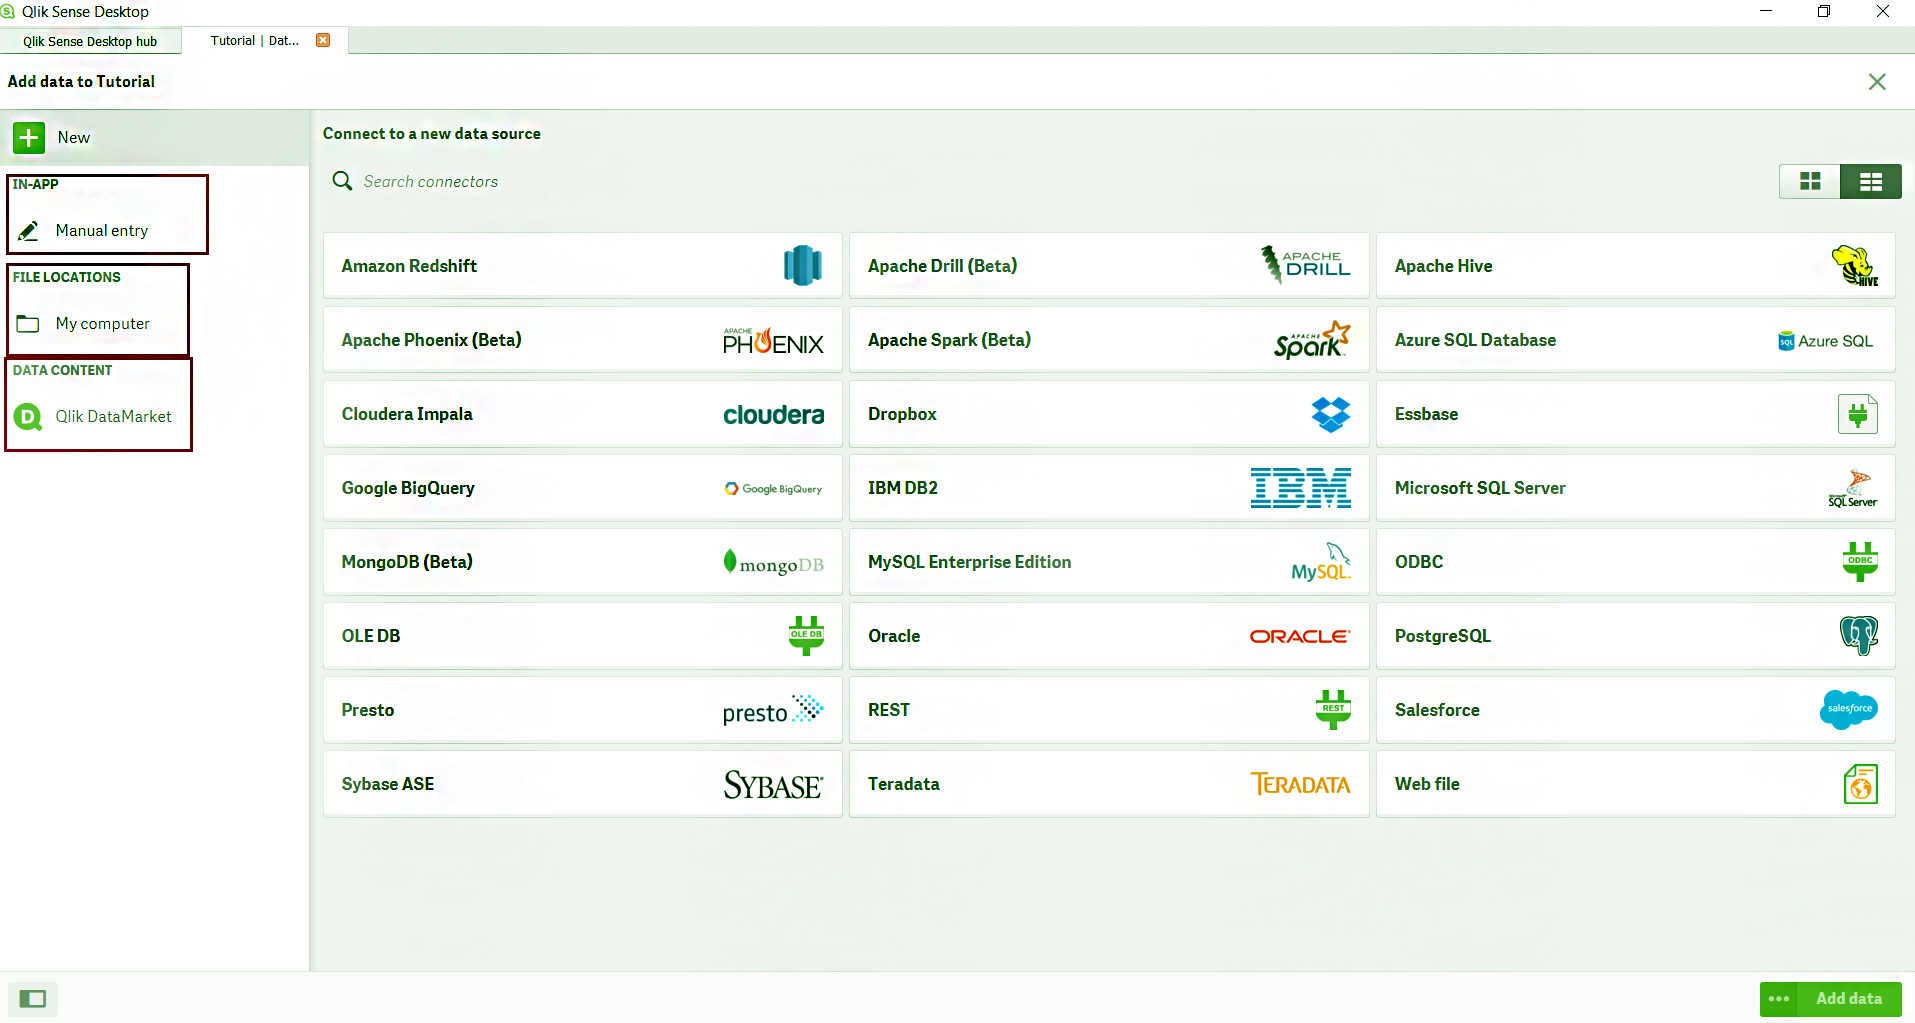
In-app, Data Connections, and Data Content
b. How to edit a Data Table?
A data table can be edited in the data manager. Select the table you want to edit and go the edit icon given at the bottom.
Edit a Data Table
In the editor, you can add a new field, rename an existing field name, associate with other fields, etc.
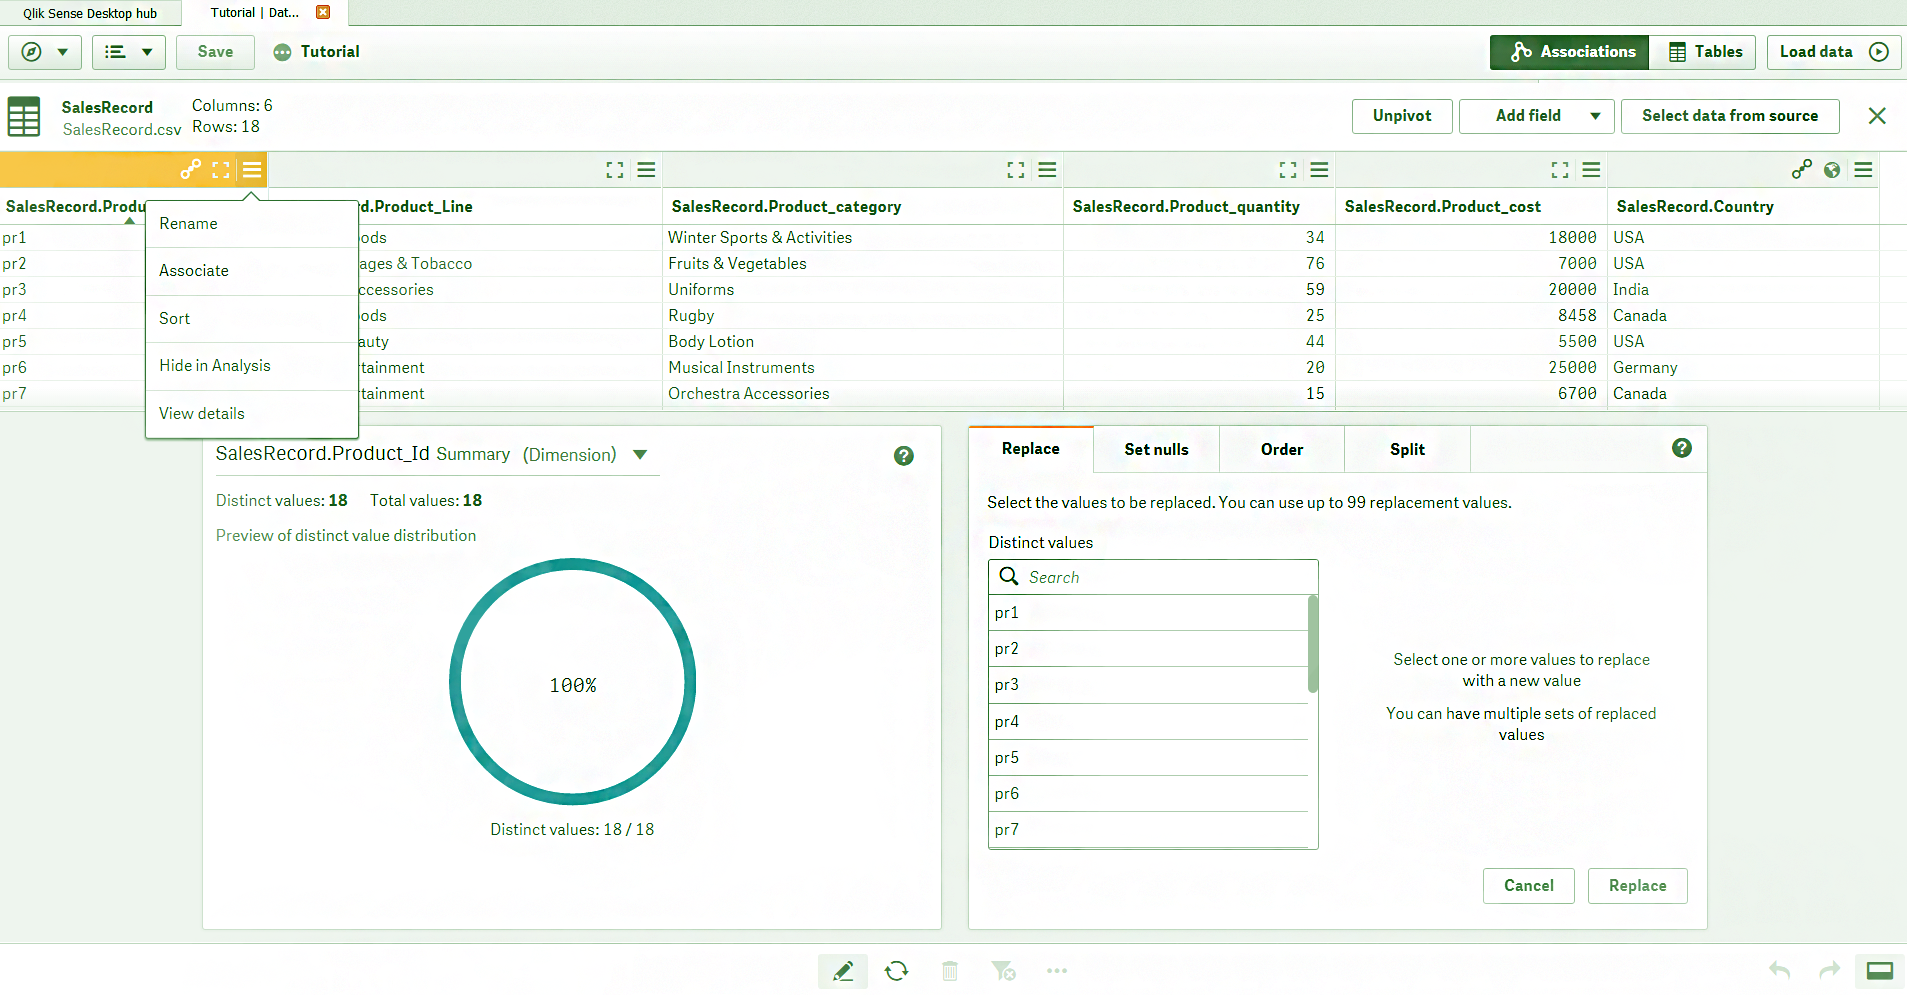
Rename existing Field
If you wish to delete a table, select the delete icon given at the bottom bar of the data manager. Also, you can reload or update a table from the reload icon.
Let’s revise Qlik Sense Aggregation Functions

Delete a Table
You can also concatenate two data table if they have some fields in common. This joins two or more tables and makes it a single table. Concatenation reduces the number of tables and frees up some space.
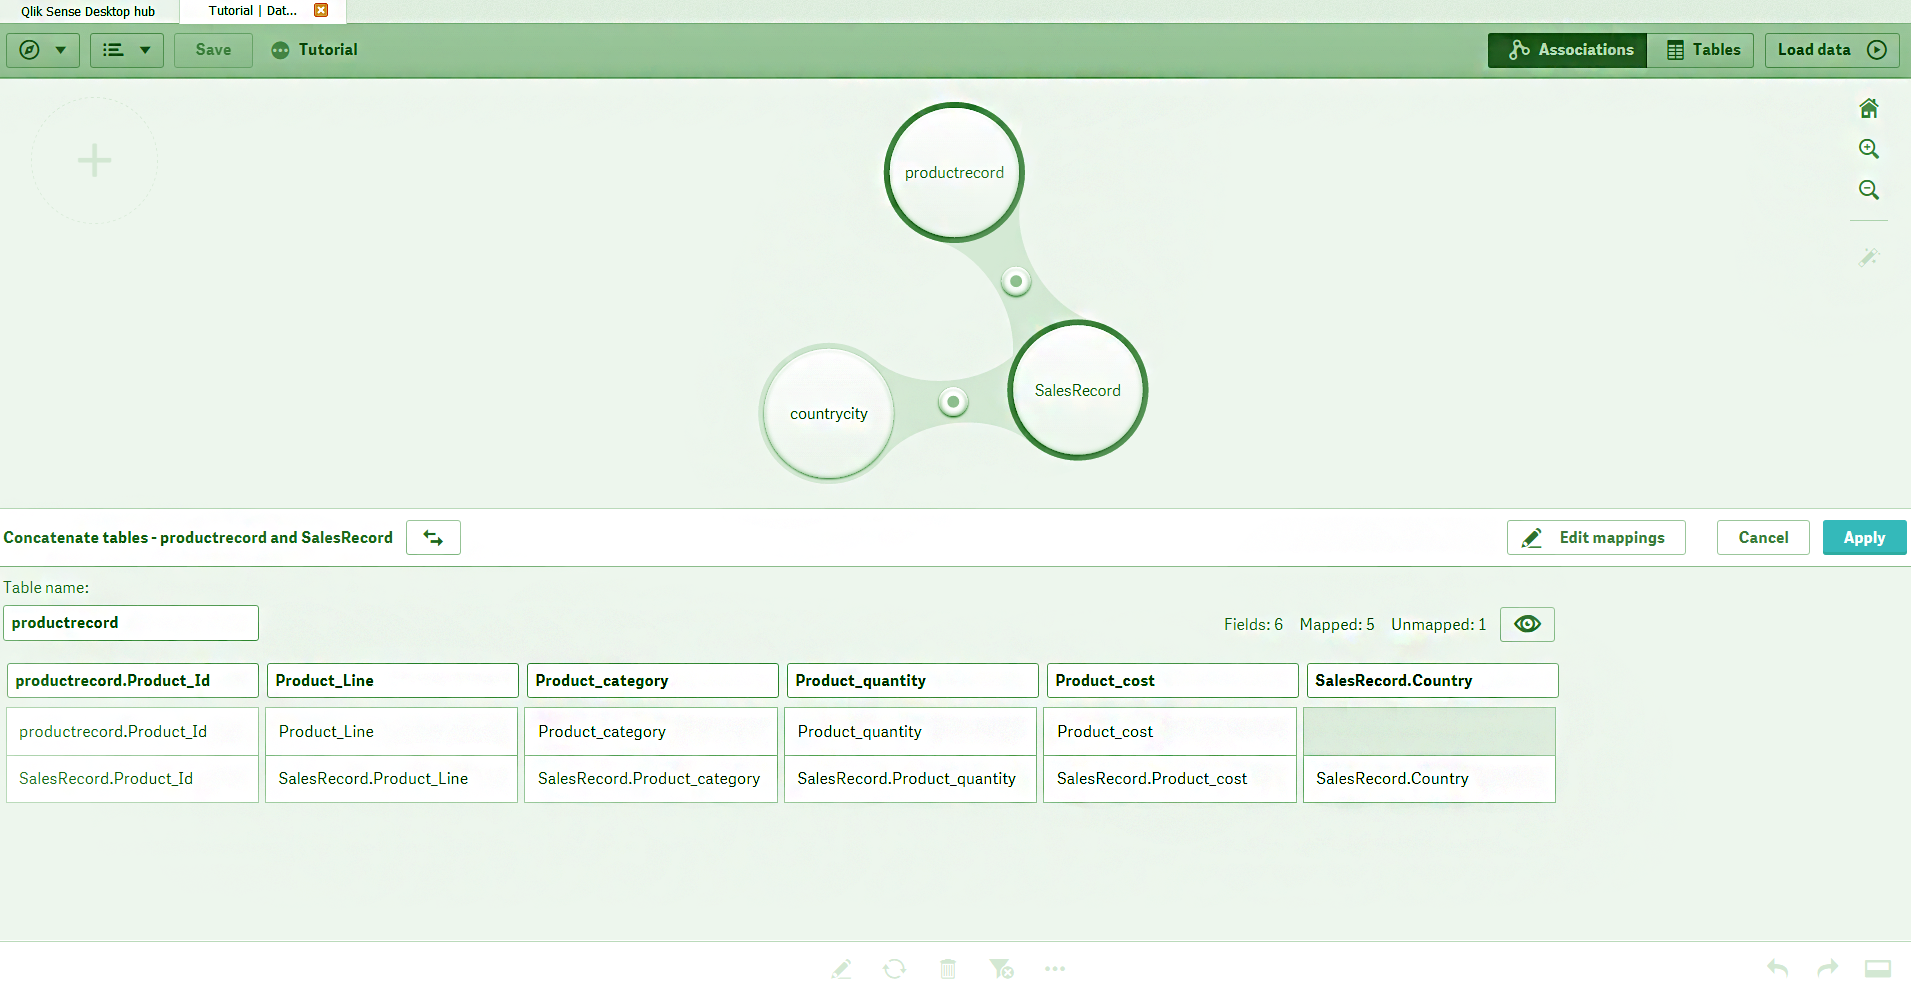
Concatenate Two Data Table
3. Connecting to Data Sources
Qlik Sense provides a wide range of data sources from which you can fetch data. You can connect to databases, load social media data, load local files, remote files or web files. You can access the files stored in your system and once you select and load data from that file, the path save for later use.
Data connections can be established to fetch data files from different file sources. Many database connectors come built-in in Qlik Sense. Below is the list. You can also add new connections and use the Qlik DataMarket as a source of data files.
- Amazon Redshift
- Apache Drill (Beta)
- Hive
- Apache Phoenix (Beta)
- Apache Spark (Beta)
- Azure SQL
- Cloudera Impala
- Google BigQuery
- IBM DB2
- Microsoft SQL Server
- MongoDB (Beta)
- MySQL Enterprise
- Oracle
- PostgreSQL
- Presto
- Sybase ASE
- Teradata
- Essbase
- ODBC
- Salesforce
- Web file
4. Loading data with the Data Load Script
You can also load data tables through the data load script which is found in the Data load editor.
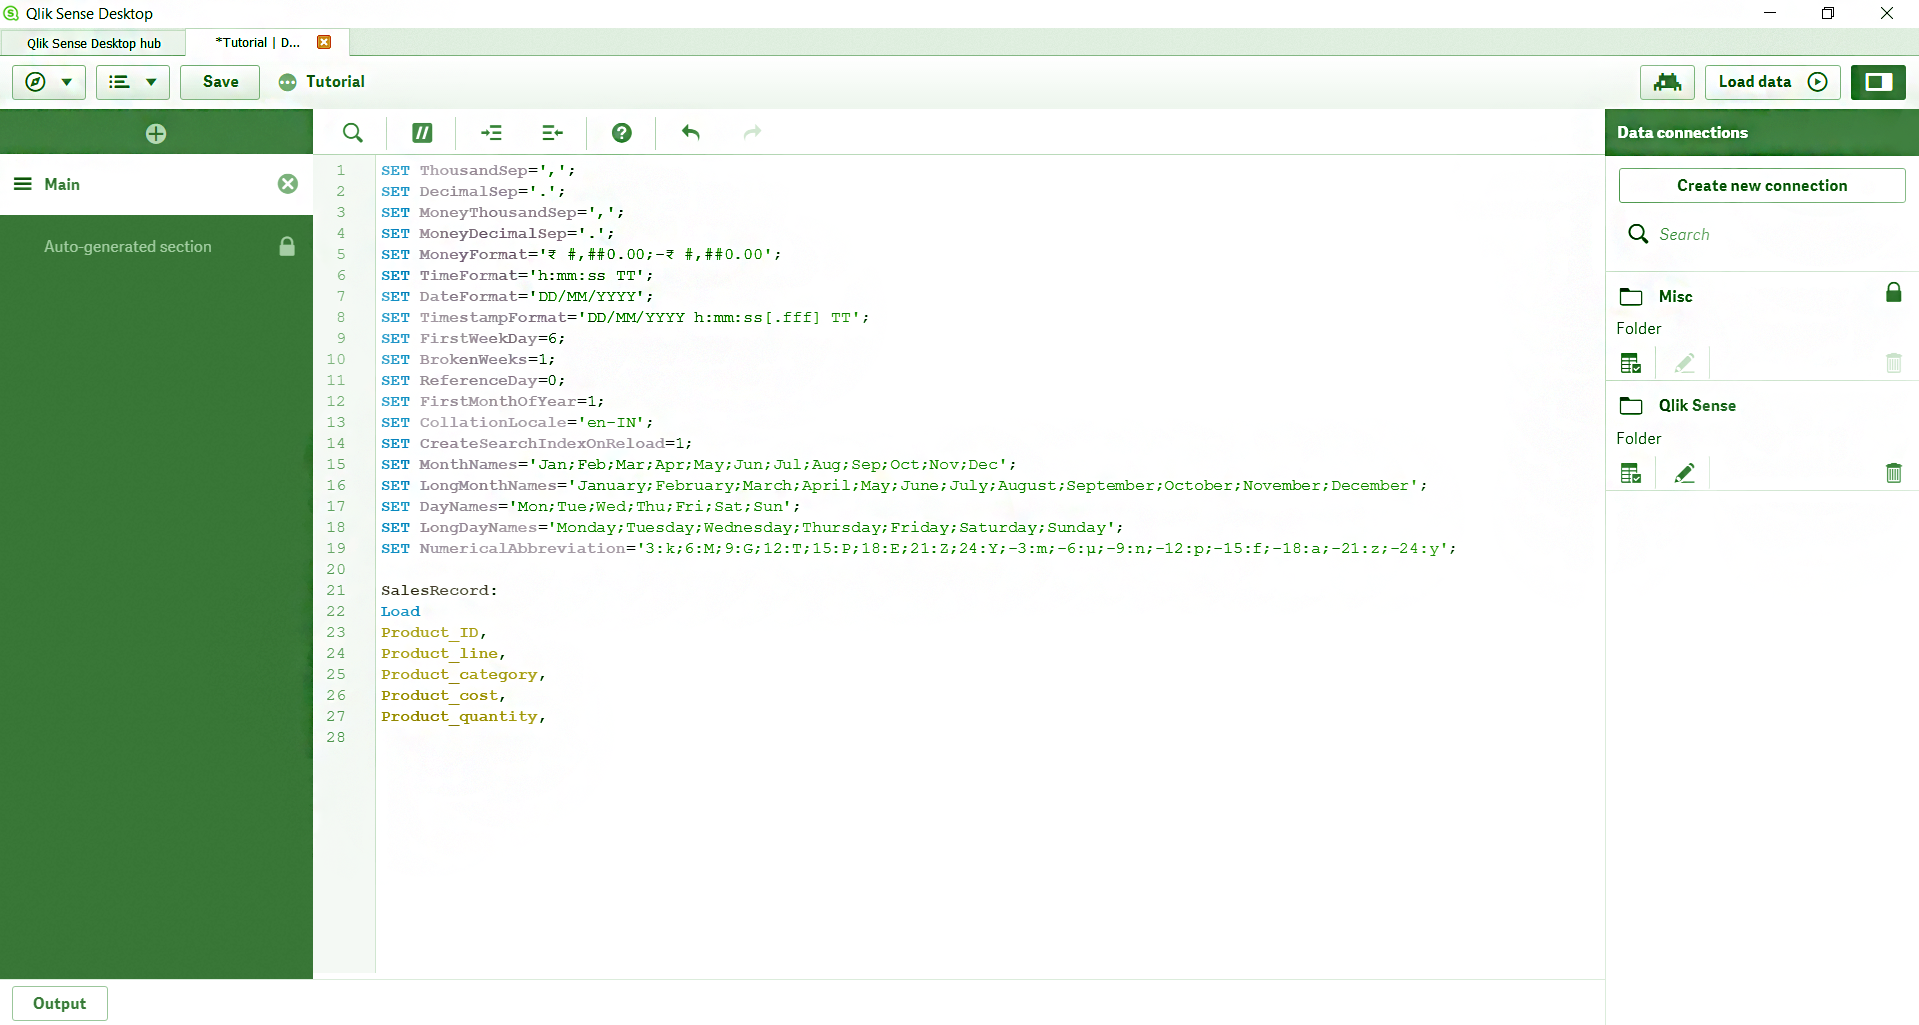
Qlik Sense Loading Data
You can do so, by using script statements like LOAD or SELECT. The process of loading data can be in a data load script is known as Extract, Transform and Load (ETL).
Recommended Reading – Qlik Sense String Functions
- The first step is ‘Extract’ where you extract data from data sources. In a data load script, it is achieved by using LOAD or SELECT as a keyword before adding the table name and field details.
- The next step is ‘Transform’, where you can manipulate data in different ways like, calculating new values, translating coded values, renaming fields, joining tables, aggregating values, pivoting and data validation.
- The last step is ‘Load’, where the table is finally loaded into Qlik Sense’s memory, as instructed in the script during script execution.
5. Viewing the Data Model
After loading data tables from all the different data sources that you required to, you can view the data structure or data model from the Data model viewer. In this viewer, you get to see all the data tables that are currently loaded in the app and the key fields in them. A connecting line shows the two key fields joining the two tables or associating them with each other.
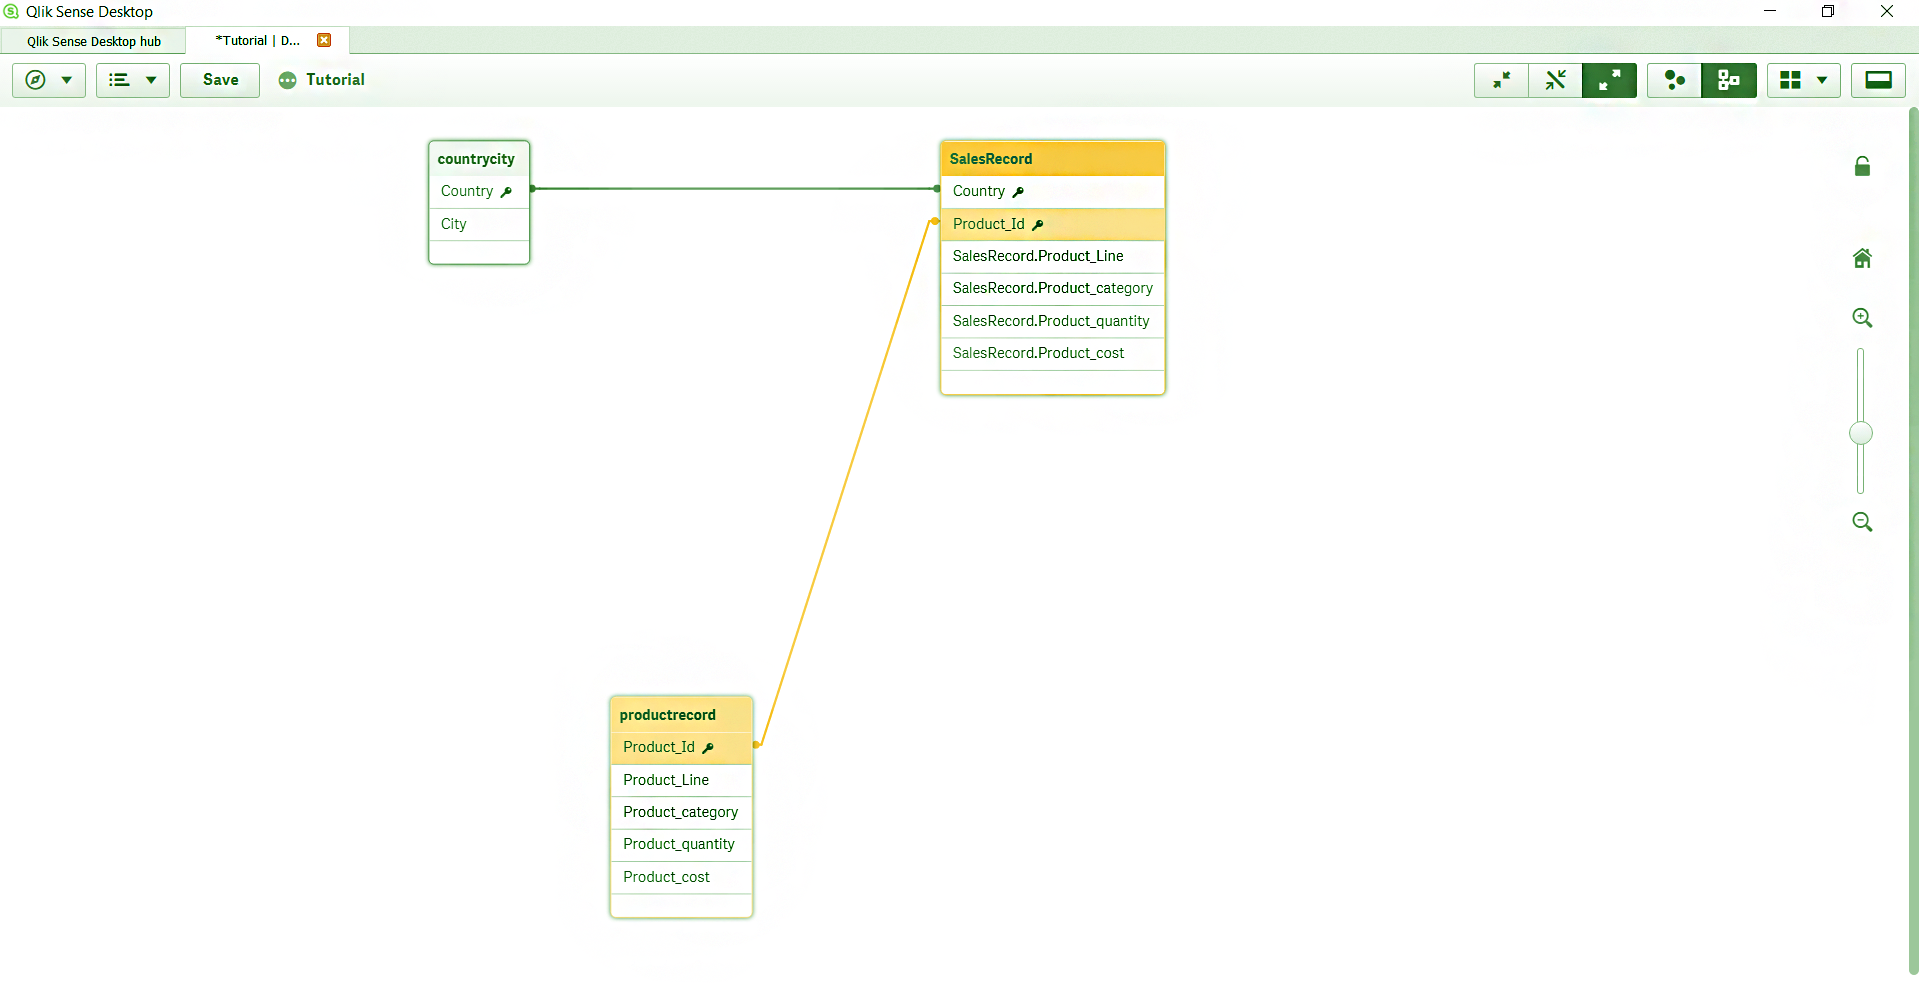
Viewing the Data Model
There are several options available in the toolbar of the data model viewer which applies certain changes into the data model that it shows. We will discuss each option starting from left to right.
- The navigation menu provides options to go to other data management sections like data manager, data load editor, etc.
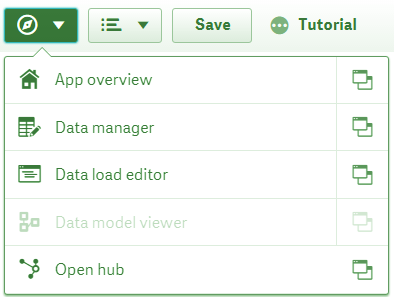
Navigation Menu in Qlik Sense Managing Data
- Next is the menu with two options, Help, About and On/Off touch screen.
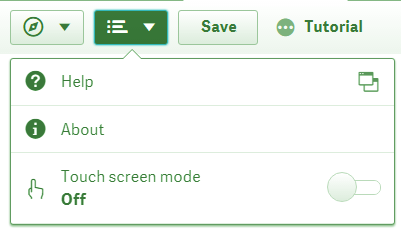
Qlik sense Viewing the data
- From the Save option, you can save the changes made so far.
Save Option
- Next is the option for show/hide app information like app title etc. Using this, you can edit the title, or style the app.
Show/Hide App
- From this panel, you can select how much details will the table show. The first option from the left shows only the table’s name, the second option shows the table name and the fields that link to other, and the third option shows a table in all its details.
Do you know about Qlik Sense Smart Search
Details in Table
- This panel gives you options to switch between the Internal table view and the Source table view.
Internal/Source Table View
- Layout menu gives three layout options i.e. grid layout, auto layout and restore layout.
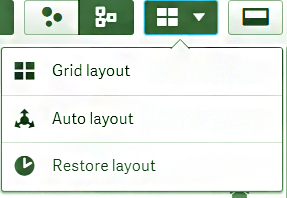
Layout Menu
- The last option in the toolbar is for opening and closing the preview pane.
Opening and Closing the preview
So, this was all in Qlik Sense Managing Data. Hope you like the explanation.
6. Conclusion
So, we have completed our Qlik Sense Managing Data Tutorial. If you have any queries, please drop them in the comment box below. We will be happy to help.
See also –
Did you like this article? If Yes, please give DataFlair 5 Stars on Google


