Interacting With Qlik Sense Visualizations
Job-ready Online Courses: Click for Success - Start Now!
Earlier we have discussed interacting with Qlik Sense UI. Today, we will see Qlik Sense Visualizations interactions. In this, we will see types of selection, data of visualizations, and visual exploration.
So, let’s start interacting with Qlik Sense Visualizations.
Interacting with Qlik Sense Visualizations
How to Interact With Qlik Sense Visualizations?
Visualizations are a key part of a Qlik Sense application as they display data in different forms and representations. You get to interact with visualizations mainly when you are making selections in them. Following the associative model, relevant data values are linked to each other and upon making selections these values change the state of visualizations accordingly. To make selections in a Qlik Sense sheet, you can either use different selection methods to select values from the visualizations or use filter panes or searches.
i. Types of Selections
There are different ways in which you can make selections in Qlik Sense sheets. These are discussed in detail in a separate article based on Qlik Sense selections. Also, there are different selection states which are also discussed in detail in the same article.
- Click selection
- Draw selection
- Range selection
- Lasso selection
- Legend selection
- Label selection
ii. Viewing Data of Visualizations
In Qlik Sense, you get to create many types of visualizations like bar charts, histograms, combo charts, line charts, pie charts etc. There is an option with a selected few visualizations out of all of viewing its data in tabular form. If a selection is made in the visualization, the data table will contain only the selected values. This is done to be able to read and understand the data values being displayed in the respective visualization properly.
To switch a visualization to a table view, right-click on the respective visualization and select the View data option.
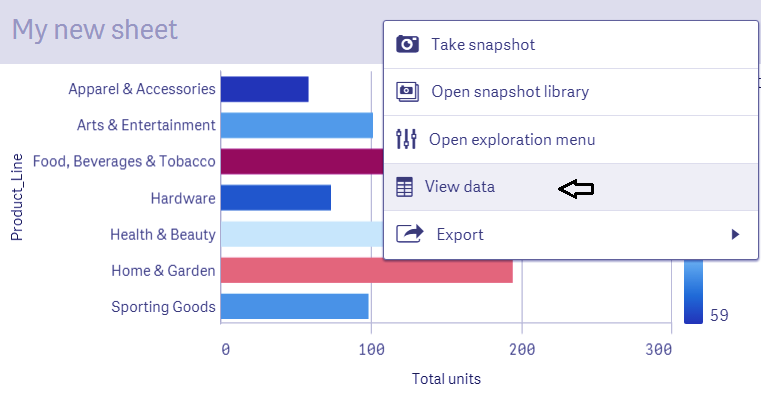
Switch Visualization to Table View
You will get all the field names and field values displayed in a simple tabular form.

Field values displayed in tabular form
Now, to go back to the visualization again, right-click on the table view and select View chart option.
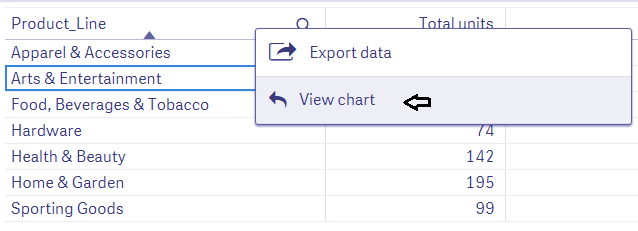
View Chart Option
This will return to the chart representation.
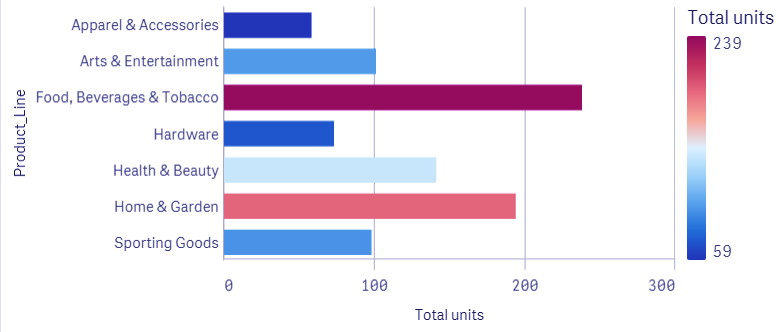
Chart Representation
The charts or visualizations where view data option is available are,
- Bar chart
- Box plot (with one or more dimensions)
- Combo chart
- Distribution plot
- Histogram
- Line chart
- Pie chart
- Pivot table
- Scatter plot
- Treemap
- Custom widget (with one or more dimensions)
iii. Visual exploration
The visual exploration is like the properties menu for every visualization that is available for use. You can manage properties of charts in areas like data, data sorting, appearance, coloring by dimension or measure, show or hide legend, adjust the labels etc.
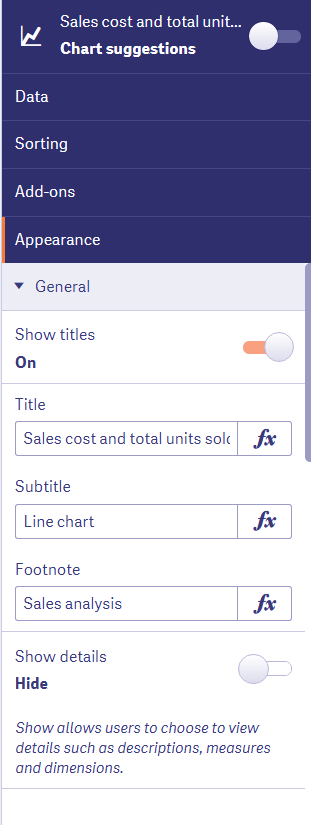
Visual Exploration
You can access the exploration menu for a particular visualization either from icon present on the visualization itself or in the Edit menu. Every visualization has properties in the visual exploration related to the purpose that visualization serves.
So, this was all in Qlik Sense Visualization Interaction. Hope you liked our explanation.
2. Summary
Hence, in this Qlik Sense Visualization tutorial, we discussed how to interact with Qlik Sense Visualization. Moreover, we saw types of selections, viewing data of visualizations, and Visual exploration. Still, if you feel any doubt regarding Qlik Sense Visualization Interaction, ask in the comment tab.
You must check – Latest Qlik Sense Interview Questions
Your opinion matters
Please write your valuable feedback about DataFlair on Google


