Qlik Sense Color Functions With Syntax and Example
We offer you a brighter future with industry-ready online courses - Start Now!!
1. Objective
Today, we will see Qlik Sense Color Functions. Moreover, we will discuss the example and syntax of color functions in Qlik Sense. The Qlik Sense color functions are used to set the color properties of the visualizations. These functions are used in script code.
So, let’s start the Qlik Sense Color Functions Tutorial.
Qlik Sense Color Functions With Syntax and Example
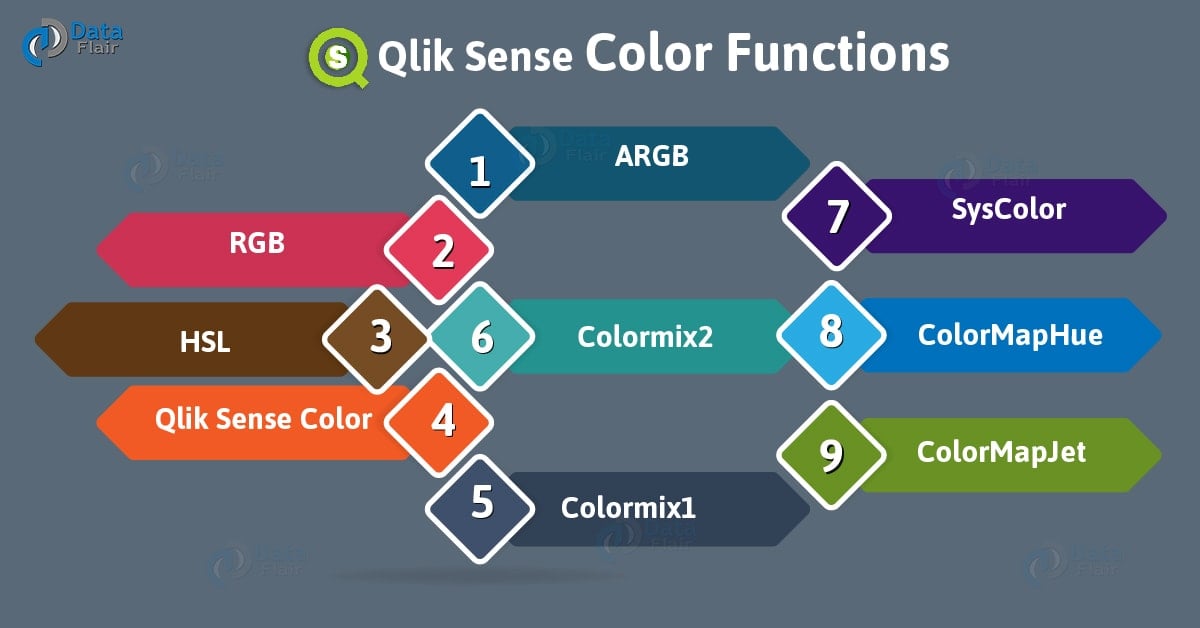
2. Qlik Sense Color Functions
i. ARGB
The ARGB() function is used to set a color code to the data points in tables and charts. The colors are defined by distinct components in the function for red (R), green(G), blue(B) and an alpha value (A) which decides opaqueness.
Syntax:
ARGB(alpha,r,g,b)
Where the alpha is a value in the range of 0 to 255 which defines the opacity of the color. If you select the alpha value to be 0 then it is interpreted as transparent and if it is 255 then it is fully opaque. Any value between these two will decide the degree of opacity accordingly.
The value for r decides the color component for red, g for green and b for blue. The value returned when this function is used is in dual data format.
For example, using the argb on a map where colored spots define different levels of call priorities.
if([Call Priority]='Must Call', argb(175,242,0,0), //this will return red dot
if([Call Priority]='Need To Call',argb(175,254,197,80), //this will return yellow
if([Call Priority]='Recent Call', argb(175,111,176,29), //this will return green
if([Call Priority]='Not Targeted',argb(175,190,190,190) ) //this will return grey
ARGB functions are used especially when the opacity of the colored object needs to be handled. This is needed much in maps, scatter charts etc. where data values are represented as points and by reducing their opacity using ARGB() one can manage such a chart where many data points are overlapping each other. If the opacity is low, and the data points are more transparent and so, overlapped data points can easily be seen separately. The argb value can also be interpreted in the hexadecimal notation. For instance, the argb value for light green is the number 4278255360, which in hexadecimal notation is FF00FF00. Where the first two FF represents the alpha factor (255), and next two 00 denotes the amount of red component, the next FF denotes green component and last 00 denotes the blue component.
ii. RGB
RGB() function is similar to the ARGB() function, the only difference being that when RGB() is used the alpha factor value is fixed and you cannot adjust the opacity of the color.
Syntax:
RGB(r, g, b)
Where the r, g, and b are the places where values for the three color components (red, green and blue) are mentioned. There are predefined values for some of the colors given below. It is interpreted as rgb() values if the alpha factor is not specified in the color function. For example, if we write Blue() then the result will be an RGB value RGB(0,0,128) but if you write Blue(128) then 128 will be the value defining opacity (alpha factor) and will result in an ARGB value, ARGB(128,0,0128).
| Color function | RGB value |
| Black ([alpha]) | (0,0,0) |
| Blue([alpha]) | (0,0,128) |
| Brown([alpha]) | (128,128,0) |
| Cyan([alpha]) | -128,128 |
| Darkgray([alpha]) | -128,128,128 |
| Green([alpha]) | (0,128,0) |
| Lightblue([alpha]) | (0,0,255) |
| Lightcyan([alpha]) | -255,255 |
| Lightgray([alpha]) | -192,192,192 |
| Lightgreen([alpha]) | (0,255,0) |
| Lightmagenta([alpha]) | (255,0,255) |
| Lightred([alpha]) | (255,0,0) |
| Magenta([alpha]) | (128,0,128) |
| Red([alpha]) | (128,0,0) |
| White([alpha]) | -255,255,255 |
| Yellow([alpha]) | (255,255,0) |
When an RGB value is written in hexadecimal notation then the first two values i.e. FFs are fixed for opacity (255, opaque). RGB() function is used mostly in tables and charts where opacity is not needed to be adjusted.
iii. HSL
The HSL() function is used to set the components of a color like hue, saturation and luminosity. The values for the three range between 0 to 1. The syntax for an HSL() function is given below.
HSL(hue, saturation, luminosity)
For example, the HSL value for an rgb() function RGB(0,255,0) will be HSL(0.33,1,0.5), this will set a certain degree of hue, saturation and luminosity for the respective color.
iv. Qlik Sense Color
The Color() function returns the numeric value of a color used in the code. The value is stored in dual form i.e. both alphabetically(text) and numerically. The text representation is in the form of rgb(r, g, b) which, by using the Color() function gives the numeric values of the red, green and blue numeric components.
Syntax:
Color(n)
For example, if we write Yellow(), then the color function will return rgb(255,255,0) which is the numeric interpretation of the color components (r, g, b) of Yellow color.
v. Colormix1 Qlik Sense
The Colormix1() function is used to mix two colors which makes a specific shade.
Syntax:
Colormix1(Value, ColorZero, ColorOne)
Where Value is a real number between 0 and 1. If Value = 0 ColorZero is returned and if Value = 1 ColorOne is returned. And, if it is in the range of 0 < Value< 1 the appropriate intermediate shading is returned.
ColorZero is a valid RGB color representation of a color, it is one of the two colors that we want to mix and makes the lower end of the interval.
ColorOne is also valid RGB color representation which is the second of the two colors to be mixed. It marks the higher end of the two-color range or interval.
For example:
Colormix1(0.5, red(), blue())
Returns- ARGB(255,64,0,64) (purple)
In this example, we mixed two colors red and blue with the mixing value 0.5 which returns the numeric values in the ARGB() function and specify the resultant color from mixing red and blue i.e. purple.
vi. Colormix2 in Qlik Sense
The Colormix2() function is used to mix two colors to make a color gradient. This function also specifies an intermediate color for the central(0) value or position.
Syntax:
Colormix2(Value, ColorMinusOne, ColorOne[ , ColorZero])
The extent of grading of the mixed color is defined by the Value which lies between -1 and 1. If the Value = -1 then first color i.e. ColorMinusOne is returned. If Value = 1 then second color i.e. ColorOne is returned. And, if the Value lies between -1 and 1, then ColorZero is returned.
The ColorMinusOne is a valid RGB color which makes the lower end of the color interval.
The ColorOne too is a valid RGB color representation which makes the higher end of the color range.
The ColorZero is an optional valid RGB color which is assigned to the central position of the range.
For example,
ColorMix2(0, red(), green(), brown())
This will return brown because the value is 0. If the value was -1 or 1, then red or green would have been returned respectively.
vii. SysColor in Qlik Sense
This function returns the ARGB value of the windows system color scheme. Here nr is the color parameter used in the Windows API.
Syntax:
SysColor(nr)
viii. ColorMapHue in Qlik Sense
The ColorMapHue() hue function returns the ARGB color value or color name of from the range or gradient of hue component in the HSV color model. The value of hue component lies between 0 to 1 (including 0 and 1). The colormap ranges from red passes to several other colors like yellow, green, cyan, blue, magenta, and then returns back to red. That, if your x value is between 0 and 1 then chances are that the hue component returned will be from the middle colors like green, cyan, blue, magenta. If the x value is near 0 or 1 then the hue component will be reddish.
Syntax:
ColorMapHue (x)
Where x is any value from 0 to 1 defining the hue component from the colormap.
ix. ColorMapJet in Qlik Sense
The function ColorMapJet() returns the ARGB color value or name for the colormap range starting from blue, and then passing through cyan, yellow and orange, and returns to red. The value of x must be specified as a value between 0 and 1. That is if you select the value of x at 0.5 or something, you will get a color which is a shade of yellow. If you go towards 0 then the color shade will become bluish and if you move towards 1 then the color shade will get reddish.
Syntax:
ColorMapJet (x)
So, this was all in Qlik Sense Color Functions. Hope you like our explanation.
3. Conclusion
Hence, in this Color Functions in Qlik Sense tutorial, we discussed different Qlik Sense Color Functions. Moreover, we looked example and syntax of each Qlik Sense Color Functions. So, these color functions in Qlik Sense use to set up the colors, shades, and gradients for the visualization objects.
Still, if you have any query regarding Qlik Sense Color Functions, ask in the comment tab.
Did you like our efforts? If Yes, please give DataFlair 5 Stars on Google


