Introduction to Qlik Sense – Key Concepts of Qlik Sense
Job-ready Online Courses: Click, Learn, Succeed, Start Now!
1. Introduction To Qlik Sense
Today, we will see an introduction to Qlik Sense. Moreover, we will look at all the basic concepts of Qlik Sense to understand it better.
In order to learn any software, one must be familiar with its key concepts. We define any software’s fundamentals or a basic design by its concepts. In this lesson of the introduction to Qlik Sense, we will learn about some of the very important concepts of Qlik Sense. Also, read it carefully as everything we will learn and perform in Qlik Sense in the coming lessons will have these concepts or key elements playing a pivotal role. Without the knowledge of these elements, you won’t be able to work efficiently in the software.
So, let’s start the introduction to Qlik Sense.
Have a look at Qlik Sense Use Cases
Introduction to Qlik Sense – Key Concepts of Qlik Sense
2. Qlik Sense Key Concepts
Here, in this introduction to Qlik Sense Tutorial, we are going to discuss the basic concepts of Qlik Sense –
i. Associative selections
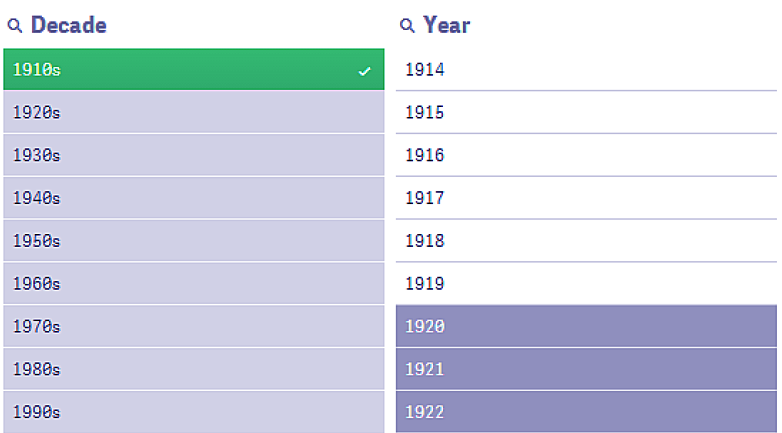
Usually, making selections is a trusted way of searching for data and relations in data. In Qlik Sense just like QlikView, you can make selections on field values and by the virtue of associative model, every data value related to the selection you just made will filter out and display a subset of data with just the data values relevant to the selected value. The selection you make can call as an input and the resultant data set or the response that indicates by the colors call as the output.
Basically, the output is a colored representation with different value cells indicated in different colors has a certain method or depiction. We can understand this by learning the specific color that assigns for each selection state.
- Green (with a tick mark) indicates Selected.
- White is for the selection state Possible.
- Light Gray represents Alternative.
- Dark Gray is represents Excluded.
- Dark Gray (with a tick mark) shows the Selected Excluded state.
Do you know about Qlik Sense Capabilities
Introduction to Qlik Sense – Associative selections
ii. Applications
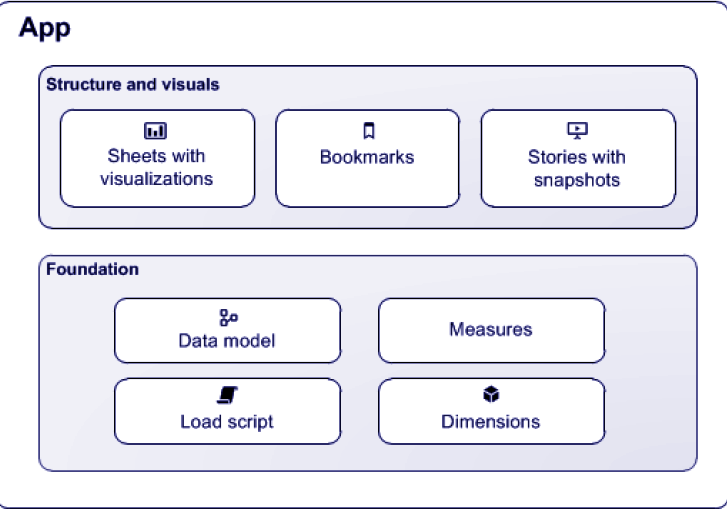
An application is like a Qlik Sense file which you make to perform the certain analysis. So, you can create any number of applications in Qlik Sense. An app is an entity which contains data as dimensions, measures, visualizations, sheets, sheet objects stories etc. The data structure keeps intact in an application and you can use it any number of times you want for viewing, modifications, sharing etc. The extension in which we save these files or apps is ‘.qvf ’. Logically and structurally, we can divide a Qlik Sense app into two parts, a Foundation, and a Structure and Visualization part. The foundation consists of all the components that make up the very base or foundation of the app’s structure, whereas the elements like bookmarks, visualizations, stories, snapshots are a part of the structure and visualization.
Introduction to Qlik Sense – Applications
Let’s revise Qlik Sense Advantages and Disadvantages
iii. Sheets
The sheets in Qlik Sense apps are like individual pages of a book. There can be n number of sheets in an application. So, the sheet acts as a container of all the visualizations and sheet objects that represent data. The sheets do not cut the associations or links between data tables, the associations reflect in all the tables regardless of which sheet they lie on.
Introduction to Qlik Sense – Sheet
iv. Visualizations
Once you load data into Qlik Sense, there is a list of options in which you can visualize your data. Choices of visualizations range from chart types, tables, maps, texts, images, KPIs, etc. You have simple drag and drop the visualization of your choice to the editing pane and start modifying it as per your requirement. Each sheet object or visualization has its own exploration menu from where you can dynamically modify the respective visualization in several ways.
Let’s revise Qlik Sense system requirements
Introduction to Qlik Sense – Visualizations
Introduction to Qlik Sense – Visualizations
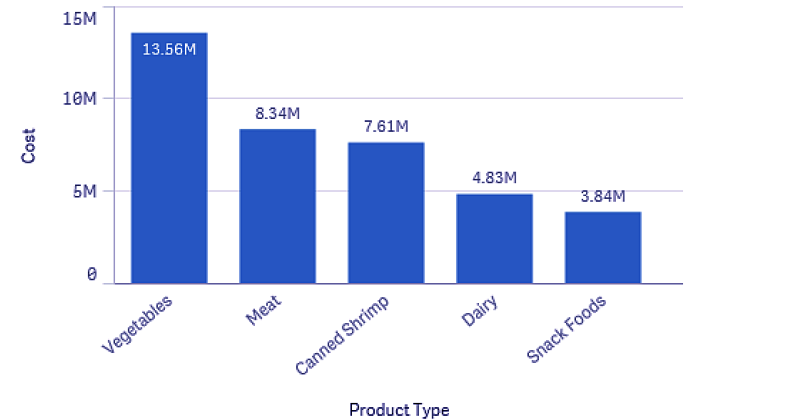
v. Dimension
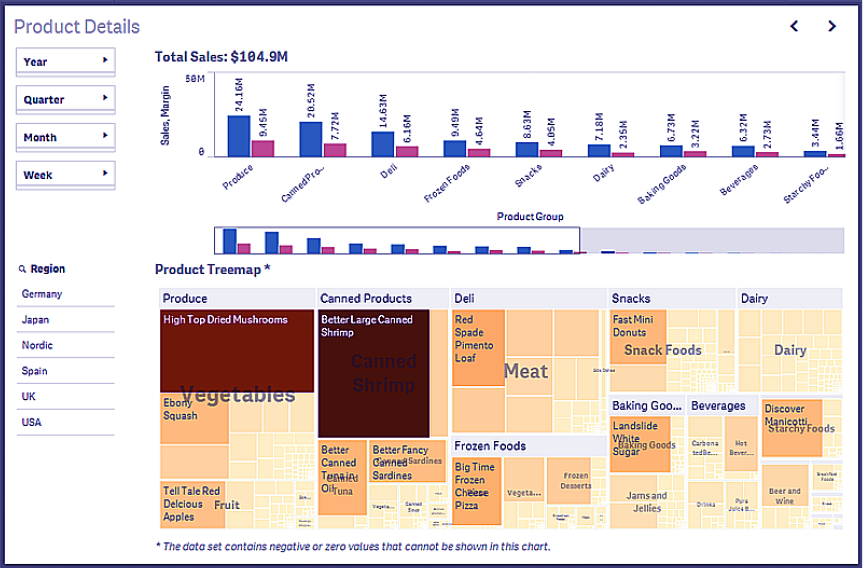
Dimensions are those fields in a data table which are composed of descriptive or informative text values. You cannot perform mathematical operations on the dimension values. And that is why usually the x-axis of the bar charts and the slices of the pie chart are dimensions. As you can see in the image below which is a bar chart, the values of the filed ‘Product type’ are dimensions.
Do you know about Qlik Sense Selections
Introduction to Qlik Sense – Dimension
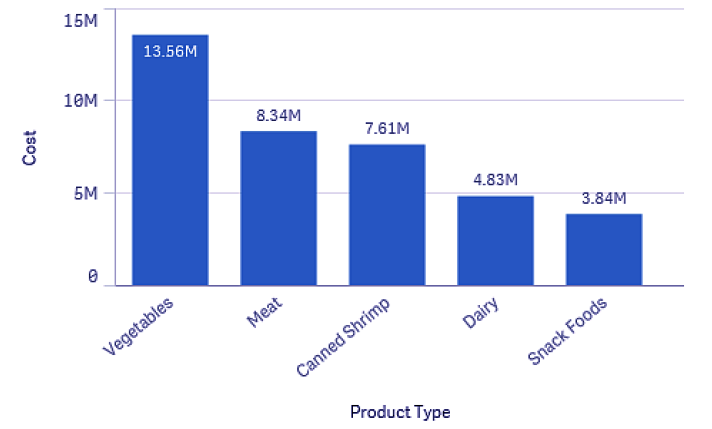
vi. Measures
As the counterpart of dimensions, measures are those data fields which contain numeric or such values which are calculable. We perform Mathematical operations on measure values. Basically, we usually plot Measures on the y-axis of a graph or chart. All the measures are used in some kind expressions. These expressions contain any of the aggregation functions available like Sum, Min, Max, Avrg, Count etc.
Introduction to Qlik Sense – Measure
vii. Data searching
We can search all the data residing within the limits of your Qlik Sense application with the data search tool. It is located at the top left of the Qlik Sense app. Also, the search tool powered by Qlik Sense’s associative engine. You can carry out different sorts of text searches in the search bar.
Let’s take a tour to Qlik Sense Gauge Chart
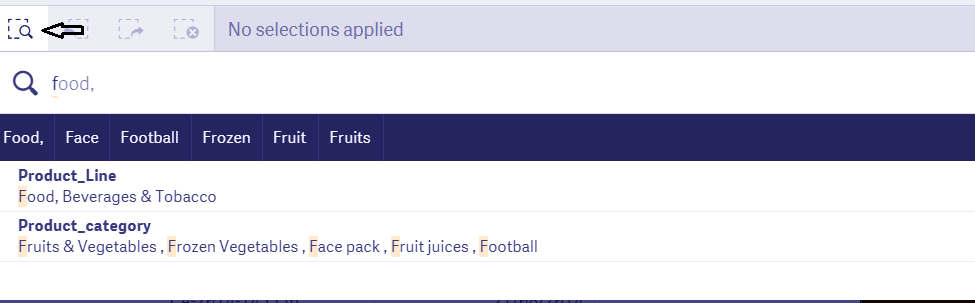
Introduction to Qlik Sense – Search
viii. Navigation
The navigation option, at the top left of the app window, consists of some important options that relate to app and data management. You can overview the entire app and the situation of the components in it. Also, to view and manage data, you have the options like Data manager, Data load editor, Data model viewer.

Introduction to Qlik Sense – Navigation
ix. Data Model and Data model viewer
Every Qlik Sense application, having data organized in tables will naturally create a data model for that application. A data model visually represents the structure of data residing in the application you made. The optimal data model is considered as a normalized start schema or snowflake schema. These schemas must not have any circular references as it distorts the data structure and disrupts the smooth functioning of the tool. Hence, to make your data model optimum, you need to make sure that there is a central fact table having keys to the dimensions liking with other tables and connected to this central tables through unique keys are individual tables having key dimension and measure fields. To view the data model of your application, you can go to the Navigation icon and select Data model viewer from there.
x. Data load script
Data can be loaded from external sources and the existing data can be modified and manipulated in the Data load script which you can access by going to Navigation icon in the toolbar and then selecting Data load editor. The common fields form discrete data tables are recognized by the software’s logic and associations are created thereof. You can manipulate the data in many ways through scripting by using keywords, functions, variables, and expression hence, creating a code.
Explore Qlik Sense Career Opportunities
xi. Bookmarks
Bookmarks are made to save the work in the state in which it is presently in. Similarly, in Qlik Sense, you can create bookmarks from the bookmark icon given at the toolbar to save the current state of selections made. You can open and work in the bookmarked sheet anytime you want.
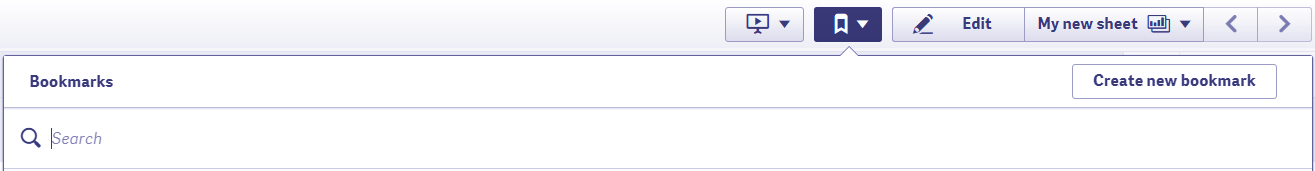
Introduction to Qlik Sense – Bookmarks
xii. Snapshots
A screenshot or snapshot as called in Qlik Sense can be taken of any visualization created in a Qlik Sense app. The state of a data object captures forever in the snapshot and does not change with any changes that we make in the original data object. Snapshots are taken for using it in Qlik Sense stories. And every visualization that you create is present an icon which is used to take a snapshot of that visualization and is saved as an image.
xiii. Story
Data storytelling is a unique feature of Qlik Sense. Using this, you can summarize your data analysis and tell it as a story to share insights and opinions on data you analyzed. A story has several slides which have images (snapshots), descriptive texts and shapes used for pointing and emphasizing on important data points. So, you can create a story from the icon given at the toolbar.
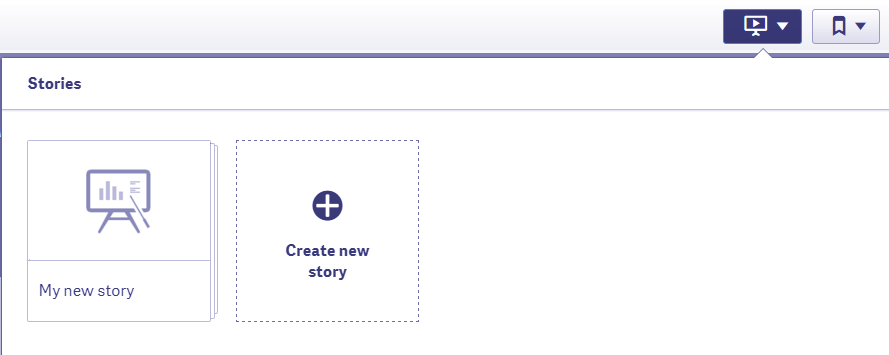
Introduction to Qlik Sense – Story
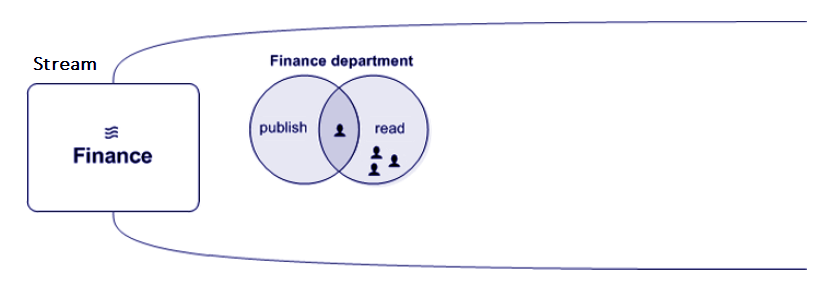
xiv. Streams and Publishing
All the applications made by the user resides in a centralizes Qlik Sense Hub. Logically, these applications are a part of a stream, which means that only a selected group of users will have access to the applications of a specific stream. Suppose you are authorized to access only the apps from stream 1 and we are authorized to access the apps from stream 2. We cannot gain access to each other’s streams.
Learn more about Qlik Sense Histogram Visualization
Also, each user has an access type for the apps in their stream. The two types of access are Publish and Read. Publish is the right for publishing your own apps into the stream which cannot be edited by any other user but you. So, the Read type access lets the users, including you, only view and analyze the data and not manipulate the existing apps or publish new ones. You can have either of the two access types or both of them.
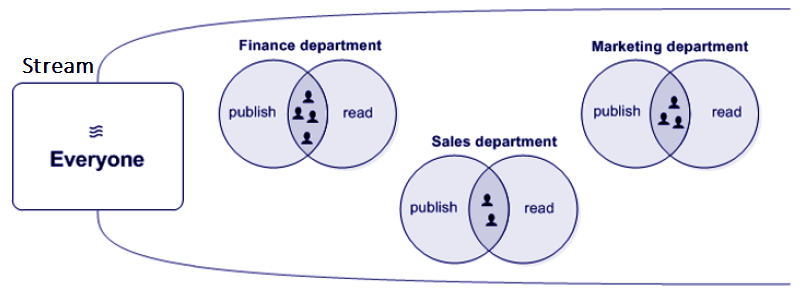
Introduction to Qlik Sense – Stream
Introduction to Qlik Sense – Stream
The two images show how the concept of stream works. In the first image, the stream type is Everyone, which means that everyone can access the apps in it and the second image shows a narrower stream in which only the users from finance department can access apps relevant to them. If you have the right, you can publish apps into specific streams and can also update new stories or sheets into existing apps. The apps are published in the respective streams from the Qlik Sense Management Console (QMC).
xv. Authorization and Access
Qlik Sense System Administrator manages Authorization and access. This decides the user’s access, modification, and publishing rights. By default, the settings are that only the one who created an unpublished app can see and modify it, an app cannot be modified once after publishing and only the users to whom access to a certain stream has been granted can have access to the apps within that stream.
Have a look at Qlik Sense Box Plot
So, this was all in the introduction to Qlik Sense. Hope you like our explanation.
3. Conclusion
Hence, in this introduction to Qlik Sense tutorial, we saw different concepts such as associative selection, applications, sheets, visualization, Dimensions. Moreover, we saw measures, data searching, data model, bookmarks, snapshots, streams and publishing in Qlik Sense. These were all the key concepts of Qlik Sense that were important for you to know. We will gain a better understanding of each concept as we work with the software in further depth.
Still, if you any doubt regarding our article on introduction to Qlik Sense ask in the comment tab.
See also –
Did you know we work 24x7 to provide you best tutorials
Please encourage us - write a review on Google


