Qlik Sense Desktop Tutorial | Components of Qlik Sense Desktop
Job-ready Online Courses: Click, Learn, Succeed, Start Now!
Today, we will see the Qlik Sense Desktop Tutorial. It is important to understand all the windows and options of a Qlik Sense Desktop before we learn to create an app in Qlik Sense. You must have good knowledge of all the components of Qlik Sense Desktop while creating the app.
So, let’s start Qlik Sense Desktop tutorial.
Qlik Sense Desktop Tutorial | Components of Qlik Sense Desktop
2. What is Qlik Sense Desktop?
The Qlik Sense Desktop is loaded when you are an unauthorized user of Qlik Sense and have downloaded and installed the free version of Qlik Sense. As soon as you click on the Qlik Sense icon added on your desktop after installing, the software will open and show a page asking if you want to create a new app. We will learn to create a new app in upcoming articles.

Qlik Sense Desktop Tutorial
In this lesson, we will navigate in the Qlik Sense Desktop user interface and learn about the different components of it.
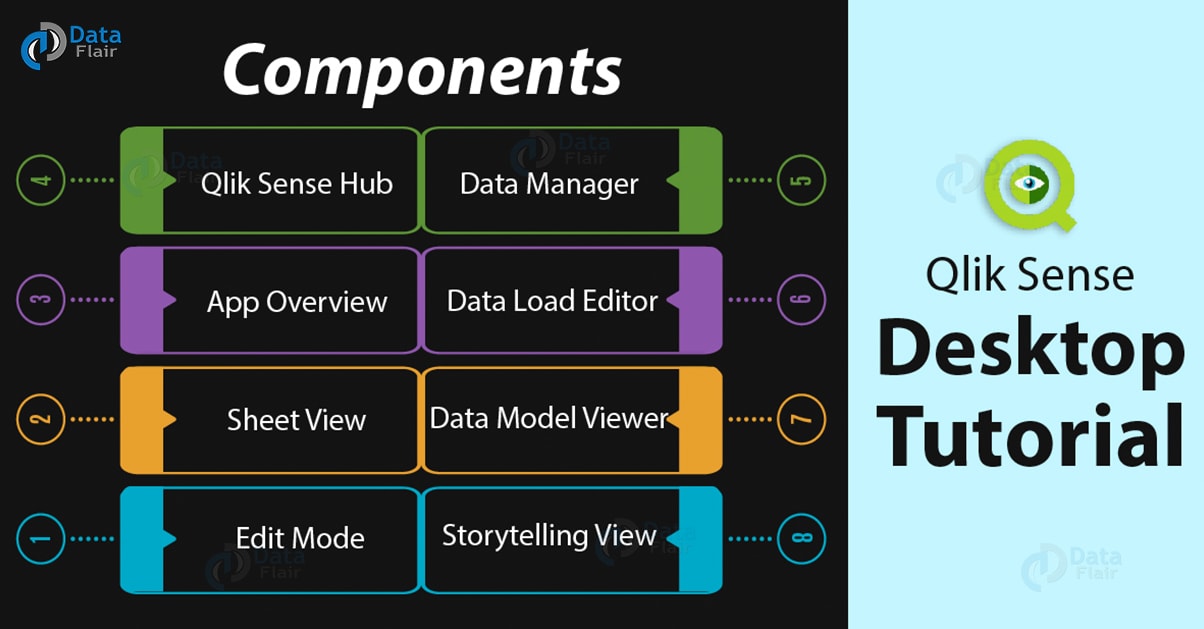
3. Components of Qlik Sense Desktop
i. Qlik Sense Hub
The first page that opens is the Qlik Sense Hub which is a centralized collection of all the apps for you to have access. So, let us take a tour of this hub following the marks or labels given in the image below.
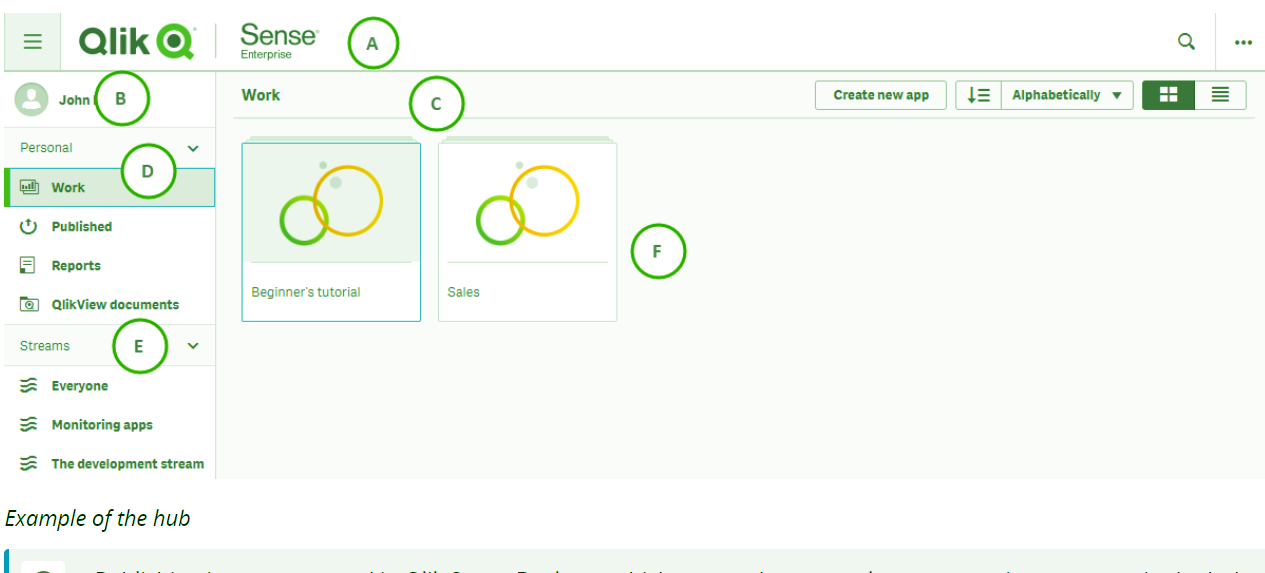
Qlik Sense Hub
A: It is the toolbar that contains the navigation pane show/hide option, a search option to search for apps and a global menu.
B: Shows the user login information like name and picture.
C: It is the bar from where you can create new applications and manage the old ones. You can sort and arrange the applications alphabetically and select the view option from the list and grid view.
D: It is the personal menu from where you can access your apps (Work option), published apps, reports and shared QlikView documents. The Work option basically shows all the unpublished apps made by you.
E: Shows all the streams you have access to and gives the details of apps published in respective streams. You can publish a new app into a stream from here and also share or move the apps published by you between the streams.
F: This central panel will show contents according to the selection you make in the navigation panel i.e. it will show all the published apps if you chose Publish option from the Personal menu of the navigation panel.
So, the image of a hub given above is of an enterprise version of Qlik Sense, the hub of desktop version looks something like this.
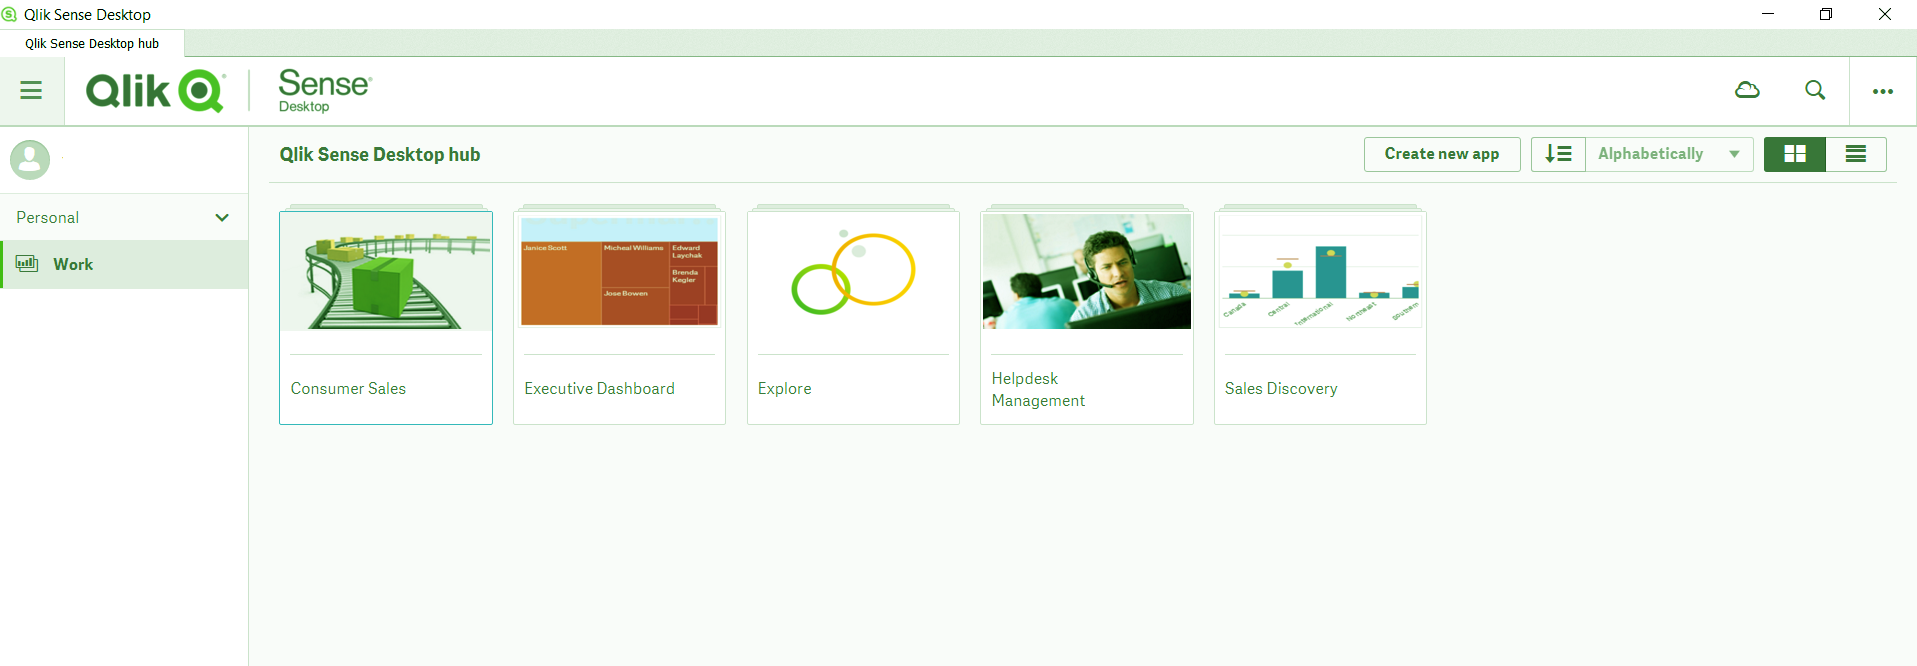
Qlik Sense Desktop Hub
ii. App Overview
When you click on an app from the hub, you reach the app overview page. All the contents of an app like sheets, bookmarks, and stories are present here. You can access, manage and modify these contents from here.
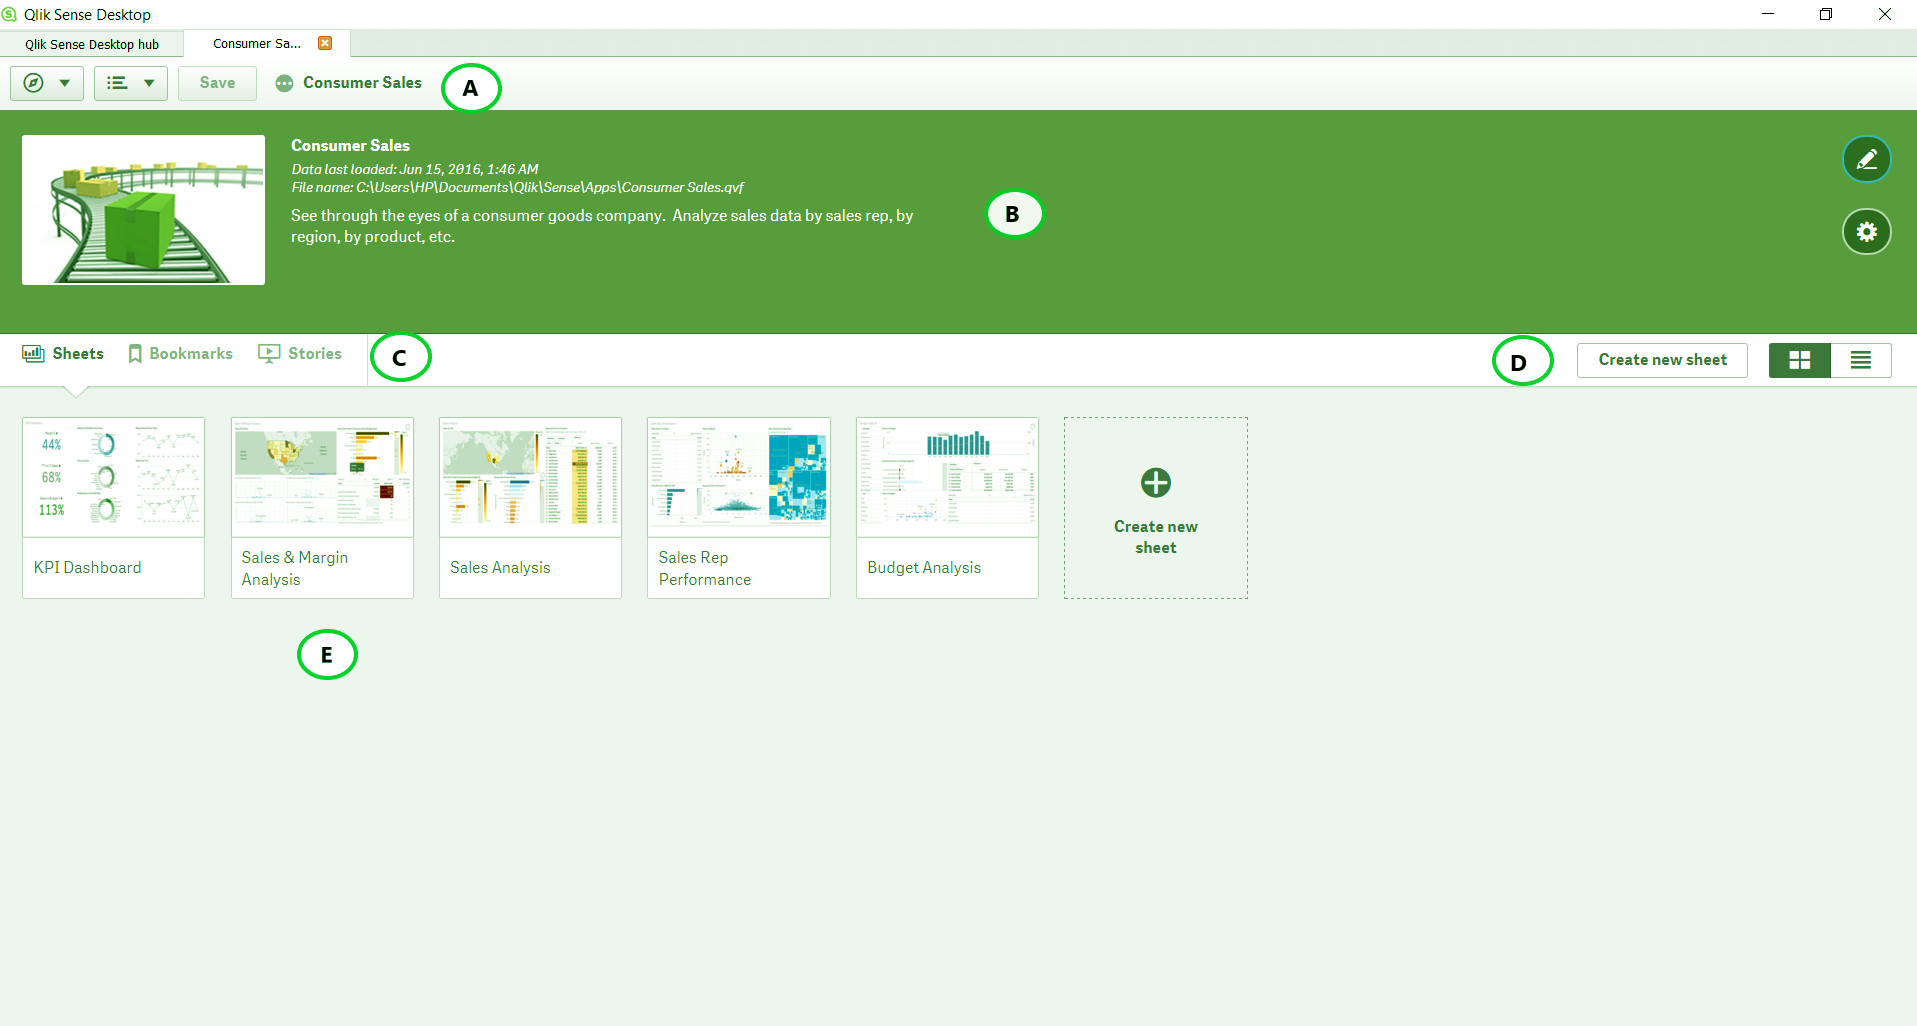
Qlik Sense Desktop – App overview
So, the image given above is a basic app overview of a Qlik Sense Desktop.
A: This is the toolbar that starts from the leftmost corner and contains the Navigation menu, Global menu, Save button and the name of the application.
B: It shows the app information like the image, app name, date and time of last loading, destination of the app and a brief description of the app. You can edit and manage this information from the icons given at the right of this section.
C: From this bar, with the icons given at the left side, you can select whether you want to view the contents of an app/sheets, bookmarks or stories.
D: From these options given at the right side, you can create a new sheet and select the mode of display from the grid view or list view options.
E: From this display panel, you can view each sheet individually and open them to work on. You can create a new item (sheet, bookmark or story page) from here.
iii. Sheet View
You can enter into the sheet view once you open a sheet from the app overview section. This is the main viewing level where all the sheet objects or data visualizations like charts, KPIs, maps, tables etc. reside displaying the data in various forms. In the sheet view, you get to analyze data by looking at it and making selections as you like and the way you like to analyze the data. You can edit these objects from the edit and explore options, you can take a snapshot of the sheet objects or visualizations.
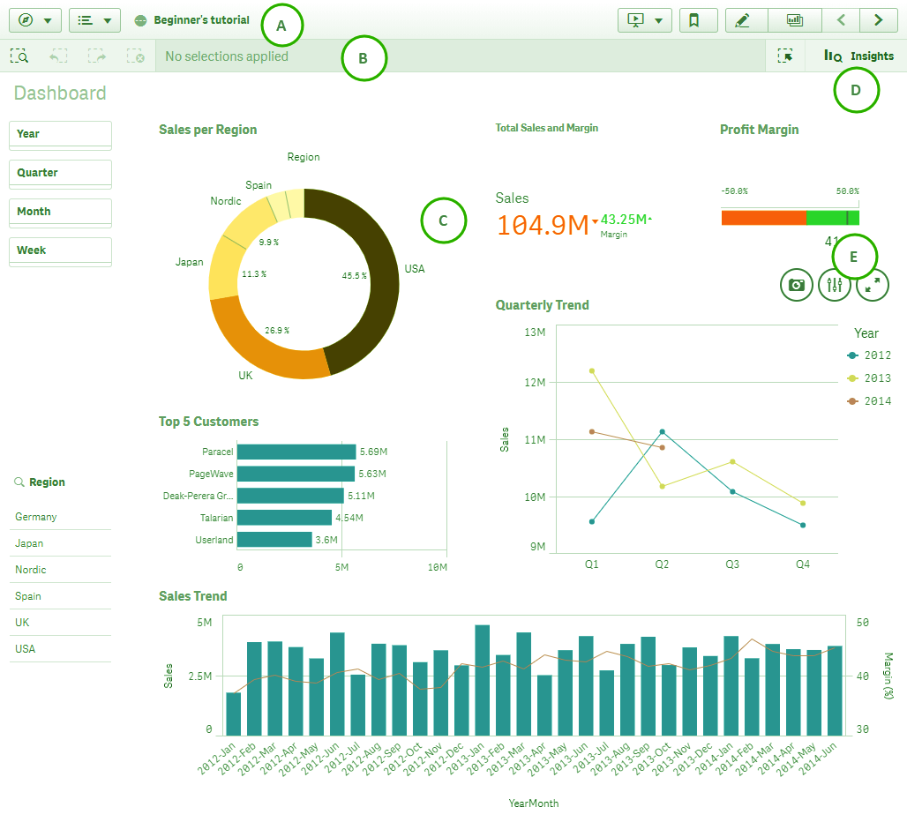
Qlik Sense Desktop – Sheet View
A: From the toolbar, you can manage the data from the navigation menu.
Add data or export a sheet from the global menu. You can store your work from the save button. Moving to the right of the toolbar, you can access the stories using the stories icon and edit the story. We can access, manage and add bookmarks from the Bookmarks icon. You can edit the sheet by edit icon and access the sheets from the icon. To move back and forth with the sheets use these buttons.
B: This is the selections bar where you can handle the selections. It is the smart search icon from which you can search for data. You can go back and forward in the selections from these icons. Use this icon to clear all the selections and to go to the selection tool to use this icon.
C: It is the main display panel where you can see and make selections on all the visualizations on the sheet.
D: In this bar, there is also an insights option from where you can get automatically generated insights on your data.
E: It is the hover menu from where you get the options like take a snapshot, go to the exploration menu, view data and expand the visualization.
iv. Edit Mode
If you wish to edit the existing visualizations or create new visualizations using the loaded data, you need to click on the icon and you will enter the edit mode.
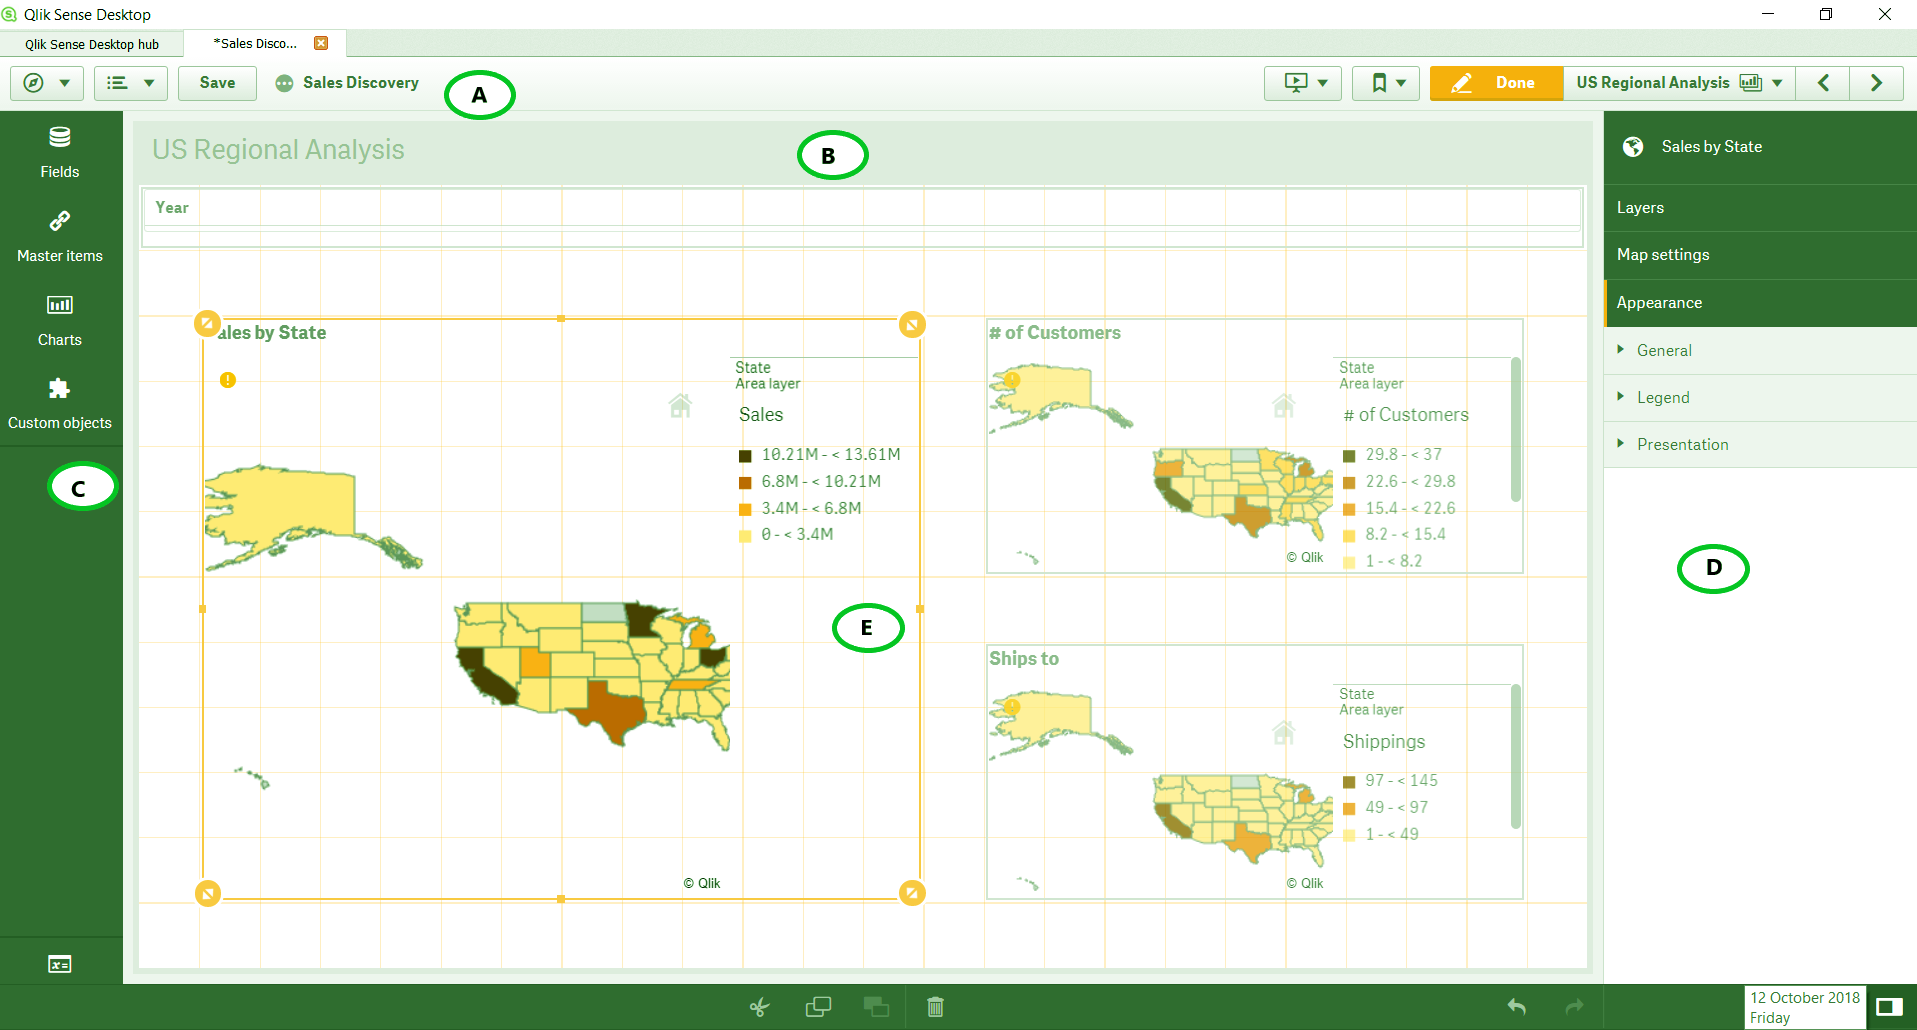
Qlik Sense Edit Mode
A: This is the toolbar with options for navigation, global menu, story editor, bookmarks, sheet editor etc.
B: This is the main gridded panel where you can view and work with visualizations. On the top, there is name of the sheet that you are working with, is displayed.
C: This is known as the Assets panel where you get options like fields, master items, charts, and custom objects.
D: It is the properties tab of the corresponding object you select. You can select the dimensions, measures, and expressions to be applied and the appearance of the visualization from here.
E: It shows the active visualization which is currently in edit mode. You can resize the object from here or change its position.
v. Data Manager
The data manager manages and displays all the associations in the data model graphically. You can go to the data editor from the navigation menu.
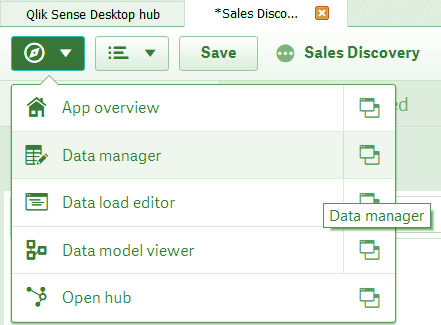
Qlik Sense Data Manager
This will open the data manager.

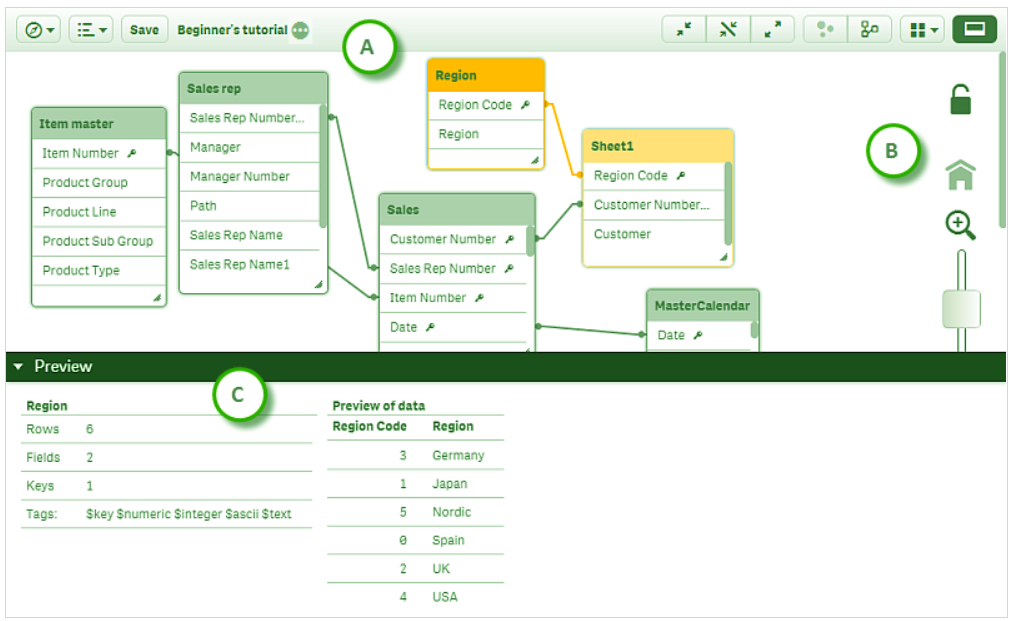
Qlik Sense Desktop – Data Manager
A: From the toolbar, you can select the view option from the Associations or Tables view. You can also load data from here.
B: Basically, this is the main view panel of associations present in the sheet. It is a flexible graphic from which you can resize as per your requirement. The bubbles represent individual tables and the size of these bubbles corresponds to the size of data in that table i.e. more the data bigger is the size of the bubble. Each bubble links to another table with a visual connector. You can also add more tables and associate them manually in whichever way you want.
C: In this bar, you can see the two associated tables that are currently selected. You can make changes in the association or rename the association from here.
D: You can preview the contents of the two selected and associated tables from here. The contents in this panel changes as per the tables and associations you select from the associations viewing panel.
E: There are several options given in this bar using which you can Edit, Reload and Delete the tables. You can clear the data filters and concatenate the selected tables from here.
F: From the options given here, you can undo or redo all the operations performed.
vi. Data Load Editor
We use the data load editor to connect to the databases and fetch data from there for analysis.
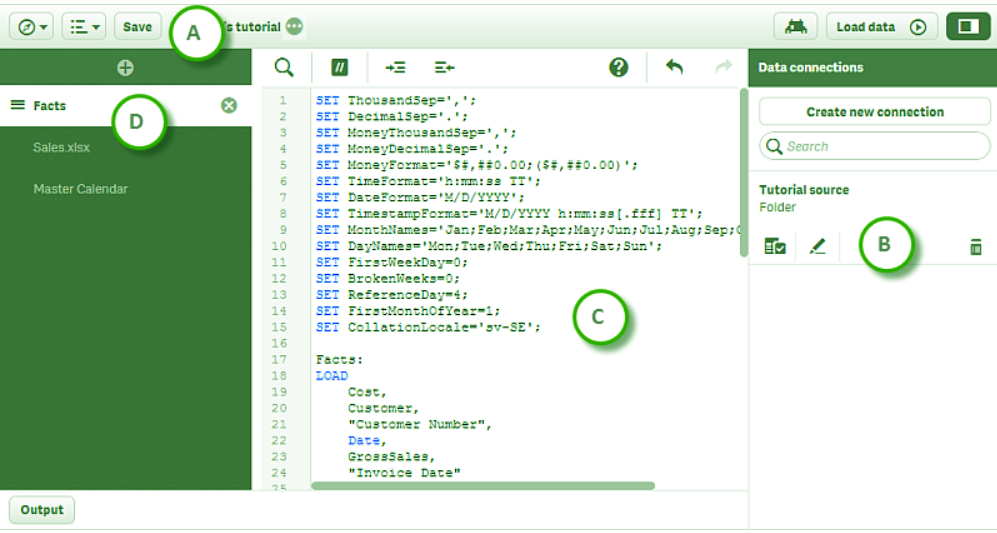
Qlik Sense Data load editor
A: This is the toolbar with a navigation menu, global menu, debug option, load data option and a viewer option.
B: You can establish a connection with the databases from this section and also create shortcuts for future use.
C: This is the main code or text editor where the code manipulating data is entered in proper syntax. On the top it has some options like search, comment/uncomment, indent and outdent code, activating syntax and undo/redo changes in the script.
D: From this section, you can create or delete the script sections and manage them in different ways.
vii. Data Model Viewer
The data model viewer shows the data model of the app or sheet graphically. It gives an overview of the application’s data structure. It provides detailed metadata that is, information about the data.
Qlik Sense Data Model viewer
A: From this toolbar, you can manipulate data in several ways like collapsing the tables and only show names, reduce the table’s size, expand the size to the fullest, see the internal table view, and, source table view. You can select the layout from the layout menu like Grid, Auto and Restore layout.
B: This is the display panel where all the tables with associations between them are shown. You can zoom in/ zoom out, lock/unlock the layout of the data model.
C: This is the preview panel having details about the data tables.
viii. Storytelling View
The storytelling editor or view mode can be opened by this icon present at the toolbar of both, app view or sheet view. From here you can create and publish a story.
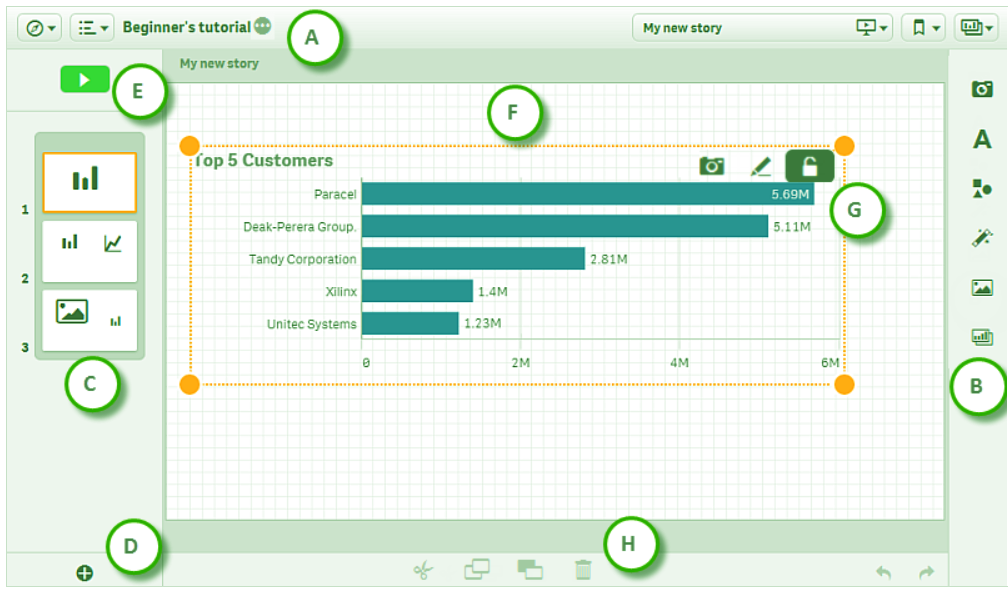
Qlik Sense Desktop – Story Telling View
A: This is the toolbar having the navigation menu, global menu, save option, access to pre-existing stories, and, bookmarks access to sheets option.
B: This section has a set of tools that help you to create a story.
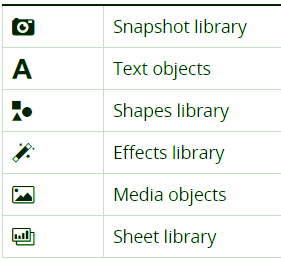
Qlik Sense Story Tool
C: This section is called the Story Timeline which lets you manage the story’s composition and create the story properly by viewing and having control over all of its elements. You can navigate with different pages/slides of the story and create new sheets if required.
D: From the plus sign, you can add more slides to your story.
E: You can preview the story and play it before finalizing from the Play button.
F: This is the main preview section where you can view and manage the elements of the story.
G: In the orange line enclosure, it is the selected item which can be locked, edited or replaced.
H: This bar has the Cut, Copy, Paste and Delete options.
So, this was all in the Qlik Sense desktop tutorial. We hope you liked our explanation.
4. Conclusion
Hence, these were all the important components of the Qlik Sense Desktop you need to know about. All the options and icons show information about them when you keep the cursor on them. Always confirm the action associated with an icon before applying it. Moreover, all of these components will appear repeatedly in the lessons to follow so pay special attention and understand them well.
Still, if any doubt related to Qlik Sense Desktop, feel free to ask in the comment section.
Crack your upcoming Qlik Sense interview from Qlik Sense Interview Questions
We work very hard to provide you quality material
Could you take 15 seconds and share your happy experience on Google


