Aggregation Functions in Qlik Sense – Types of Functions
Placement-ready Courses: Enroll Now, Thank us Later!
1. Objective
In our last Qlik Sense tutorial, we discussed Qlik Sense Geospatial Functions. The aggregation function takes in multiple values and returns an aggregated value as a result. There are two categories of aggregation functions based on its use. We use Qlik Sense Aggregation Functions in data load script and in chart expressions.
Aggregation Functions in Qlik Sense – Types of Functions
So, let’s start Qlik Sense Aggregation Functions Tutorial.
2. Qlik Sense Aggr() Chart Function
The aggr() function is a chart function which performs advanced aggregation i.e. aggregation within a function. It returns an array of values as a result of aggregation.
You must read about Qlik Sense Line Chart
Syntax:
Aggr({SetExpression}[DISTINCT][NODISTINCT]expr,StructuredParameter{, StructuredParameter})Where, expr is the expression having the aggr() function.
The StructuredParameter is the name of the dimension or measure from which the values will be taken and sorted. We mention it in the expression as, (Dimension(Sort-type, Ordering)).
The SetExpression parameter sets the set of records upon which the aggregation should be applied. If you do not mention any such set expression value, then the function applies aggregation on the set of possible records as per the selections made.
DISTINCT will return one result for each value upon which aggregation is applied.
NODISTINCT will return an array of values as a result for each value upon which aggregation is applied.
For example,
ProductData:
LOAD * inline [
Customer|Product|UnitSales|UnitPrice
Arman|AA|4|16
Arman|AA|10|15
Arman|BB|9|9
Himesh|BB|5|10
Himesh|CC|2|20
Himesh|DD|25|25
Parth|AA|8|15
Parth|CC||19
] (delimiter is '|');
The expression, Avg(Aggr(Sum(UnitSales*UnitPrice), Customer)) will return three values each as the sum of sales for each customer (Arman, Himesh, Parth) i.e. 295, 715, and 120 after applying the Aggr() function on the individual values. Upon this result of three values, Avg() function is applied which returns the average of the three values, 376.6667.
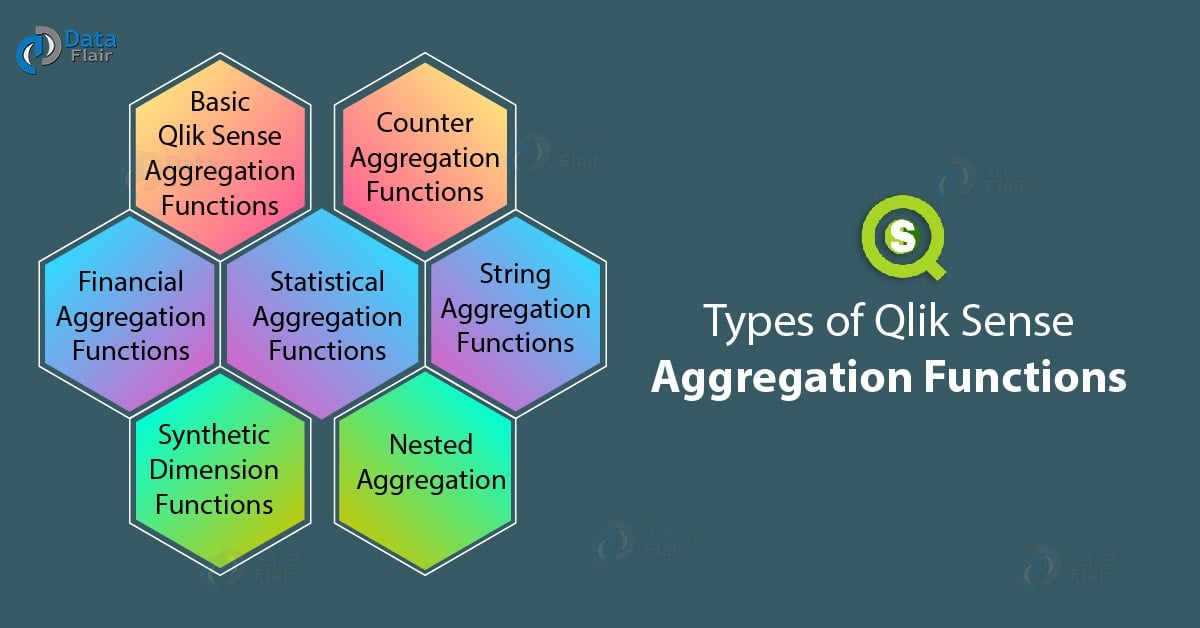
3. Types of Qlik Sense Aggregation Functions
Types of Qlik Sense Aggregation Functions
Have a look at Qlik Sense Formatting Functions
a. Basic Qlik Sense Aggregation Functions
The basic aggregation functions are the most commonly used aggregation functions.
- FirstSortedValue
This function sorts values in a field based on another field loaded in the same script.
Syntax:
FirstSortedValue([ distinct ] value, sort-weight [, rank ])
Where, value is the field or dimension which you want to sort based on the values provided in the sort-weight parameter.
Sort-weight is the field whose values will be sorted from lowest to highest.
Rank sets the nth value from the list of sorted values which you want the function to return.
For example, using the sample data given below we will apply the function and see how it works.
Temp:
LOAD * inline [
Customer|Product|UnitSales
Arman|AA|10
Arman|AA|18
Arman|BB|9
Arman|CC|2
Chandrika|AA|4
Chandrika|BB|5
Chandrika|DD|25
Darsh|AA|8
Darsh|CC|19
Priya|AA|16
Priya|AA|16
Priya|DD|10
] (delimiter is '|');
Now, we will apply the firstsortvalue function on it.
FirstSortedValue:
LOAD
Customer,FirstSortedValue(Product,UnitSales)
as CustomerRank
Resident Temp Group By Customer;
This returns a table named FirstSortedValue with a field named CustomerRank and Customer.
| Customer | CustomerRank |
| Arman | CC |
| Chandrika | AA |
| Darsh | AA |
| Priya | DD |
Here, the firstsortvalue() function sorts the UnitSales values based on Customers from lowest to highest. The smallest value of UnitSales for each customer is taken and returned as smallest to highest. That is, CC=2 is the lowest for Arman, then AA=4 is the second lowest for Chandrika, AA=8 for Darsh and DD=10 is the lowest for Priya but largest of the four customers.
- Max
This function returns the highest value amongst the evaluated values of a field. You can get a specific nth value from the returned values using the rank parameter.
Syntax:
Max(expr [, rank])
Max(expr [, rank])
- Min
This function returns the lowest value amongst the evaluated values of a field. You can get a specific nth value from the returned values using the rank parameter.
Recommend Reading – Qlik Sense Field Functions
Syntax:
Max(expr [, rank])
- Mode
This function returns the most commonly occurring value or the value that occurs the highest number of times in a field. This function evaluates and returns both text and numeric values from a field.
Syntax:
Mode(expr)
- Only
This function returns a value which is the only possible result of a particular evaluation. This function uses both text and numeric values. If there is no such unique value which exists as the only value after the evaluation of data values, then the function returns NULL.
Syntax:
Only(expr)
- Sum
This function calculates the total of the values given in a field and returns the calculated sum.
Syntax:
Sum([distinct]expr)
b. Counter aggregation functions
The counter aggregation functions count the number of values being evaluated in a field and returns that number.
- Count
This function returns the total number of values present in a field in a table.
Syntax:
count([distinct ] expression |* )
- MissingCount
This function returns the number of missing values in a field or expression.
Syntax:
MissingCount([ distinct ] expression)
- NullCount
This function returns the number or count of all the NULLs present in an expression or field of a table.
Syntax:
NullCount([ distinct ] expression)
- NumericCount
This function counts only the numeric values present in an expression or field and returns the count.
Let’s revise Qlik Sense Counter Functions
Syntax:
NumericCount([ distinct ] expression)
- TextCount
This function counts only the text values present in an expression or field and returns the count.
Syntax:
TextCount([ distinct ] expression)
c. Financial aggregation functions
These are the aggregation functions applied to the financial data values and used in the financial operations related to payments and cash flow.
- IRR
This function calculates and returns the Internal Rate of Interest (IRR) value for a series or number of cash flow or the money debited and credited. The IRR is the interest rate which a person receives upon making investments where payments are made (shown by a negative sign) and received (shown by a positive sign). Such payments must occur at regular intervals like monthly or annually.
Syntax:
IRR(value)
For instance, a field named ‘Payments’ contains some values showing cash flow for which IRR must be calculated. Suppose the values are, -1000, 3000, 4200, 6800 and then the function IRR(Payments) will return the interest value as 0.1634.
- XIRR
This function calculates the IRR for a defined period or schedule of a series of cash flow. This means that the time periods for cash flows don’t have to be periodic. In the function, you can specify the payments or cashflow values from the parameter pmt. Also, the schedule of cash flow or payments can be set by date.
Syntax:
XIRR(pmt, date)
- NPV
This function returns the Net Present Value (NPV) for a series of future payments based on a discount rate applied on the payments values over a period.
Syntax:
NPV(discount_rate, value)
Where, discount_rate is the rate of discount applied over the entire period on the payment values.
value is the expression or field which contains the payment values.
- XNPV
This function returns the Net Present Value (NPV) for a series of future payments based on a discount rate applied on the payments values over fixed schedule of time or date i.e. the time intervals might not be periodic.
Syntax:
XNPV(discount_rate,pmt,date)
Where, discount_rate is the rate of discount applied over the entire period on the payment values.
pmt is the expression or field which contains the payment values.
date is the expression gives the dates which specifies the schedule of dates which corresponds to the payments we want to evaluate.
d. Statistical aggregation functions
- Avg
This function returns the average of all the aggregated values from the data fields.
Syntax:
avg([distinct] expression)
- Correl
This function returns the correlation coefficient for the aggregated set of values which exists as a pair of coordinates represented as x and y-values or value1 and value2 in the expression.
We recommend you to read Qlik Sense Integer Functions
Syntax:
Correl(value1, value2)
Where, value1 and value 2 are the series of paired values for which we can calculate the correlation coefficient by the function.
- Fractile
This function evaluates a fractile value for the given values in aggregation. You can set the fraction between 0 and 1 corresponding to the fractile value you wish to calculate for a given set of values.
Syntax:
Fractile(expr, fraction)
- Kurtosis
This function evaluates and returns the kurtosis value for a given set of values. You can use the Distinct parameter to specify that all the duplicate values will be disregarded by the function.
Syntax:
Kurtosis([distinct ] expr)
- Median
This function evaluates and returns the median of an aggregated set of values given in the expression. Through the parameter expr, you can specify the field which contains values for which you want to calculate the median.
Syntax:
Median(expr)
- Skew
This function returns the skewness of the set of values provided for evaluation. You can use the Distinct parameter to specify that all the duplicate values will be disregarded by the function. Also, using the parameter expr, you can specify the field which contains values for which you want to calculate the skewness.
You must read Qlik Sense Pie Chart
Syntax:
Skew([distinct]expr)
- Stdev
This function evaluates and returns the standard deviation for a given set of values. You can use the Distinct parameter to specify that all the duplicate values will be disregarded by the function. Also, the parameter expr, you can specify the field which contains values for which you want to calculate the standard deviation.
Syntax:
Stdev([distinct] expr)
- Sterr
This function evaluates and returns the standard error (stdev/sqrt(n)) value for a given set of values. You can use the Distinct parameter to specify that all the duplicate values will be disregarded by the function. Also, the parameter expr, you can specify the field which contains values for which you want to calculate the standard error.
Syntax:
Sterr([distinct] expr)
- STEYX
This function evaluates and returns the standard error value of the predicted y-value corresponding to each x-value in regression. The values that we take in as input must be in pairs of x and y-values.
Syntax:
STEYX(y_value, x_value)
e. String aggregation functions
- Concat
This function returns a combined string i.e. a string resulting from the concatenation of a few individual strings.
Syntax:
Concat([distinct]string[,delimiter [,sort-weight]])
Where, the string is the number of individual strings which you want to join or combine.
delimiter is the sign which you want to use to separate the individual values in the joined string.
sort-weight sets the sort order for concatenation of strings i.e. the string corresponding to the lowest value will be concatenated first and so on till the highest value.
For example,
TeamData:
LOAD * inline [
SalesZone|Team|Amount
East|Gamma|20000
East|Gamma|20000
West|Zeta|19000
East|Alpha|25000
East|Delta|14000
West|Epsilon|17000
West|Eta|14000
East|Beta|20000
West|Theta|23000
] (delimiter is '|');
LOAD SalesGroup,Concat(distinct Team,’-‘) as TeamConcat
Resident TeamData Group By SalesGroup;
This will return a field having records with concatenated strings of East and West sales zones.
| SalesZone | TeamConcat |
| East | Alpha-Beta-Delta-Gamma |
| West | Epsilon-Eta-Theta-Zeta |
- FirstValue
This function returns the last value from the loading of a table and its fields.
Syntax:
FirstValue(expr)
For example,
TeamData:
LOAD * inline [
SalesZone|Team|Amount
East|Gamma|20000
East|Gamma|20000
West|Zeta|19000
East|Alpha|25000
East|Delta|14000
West|Epsilon|17000
West|Eta|14000
East|Beta|20000
West|Theta|23000
] (delimiter is '|');
The function FirstValue(Team) will return Gamma for the value East and Zeta for the value West as the first loaded value.
- LastValue
This function returns the value which was loaded last during the loading of a table and its fields.
Syntax:
LastValue(expr)
For example,
TeamData:
LOAD * inline [
SalesZone|Team|Amount
East|Gamma|20000
East|Gamma|20000
West|Zeta|19000
East|Alpha|25000
East|Delta|14000
West|Epsilon|17000
West|Eta|14000
East|Beta|20000
West|Theta|23000
] (delimiter is '|');
The function LastValue(Team) will return Beta for the value East and Theta for the value West as the first loaded value.
- MaxString
This function finds and returns the last value loaded in a field of a table.
Have a look at Qlik Sense Time Zone Functions
Syntax:
MaxString(expr)
For example, in the sample script given below, we will get the maximum string or the string loaded last in order.
TeamData:
LOAD * inline [
SalesZone|Team|Date
East|Gamma|01/05/2018
East|Gamma|02/05/2018
West|Zeta|01/06/2018
East|Alpha|01/07/2018
East|Delta|01/08/2018
West|Epsilon|01/09/2018
West|Eta|01/10/2018
East|Beta|01/11/2018
West|Theta|01/12/2018
] (delimiter is '|');
The function, MaxString(Date) will return 01/11/2018 for East SalesZone and 01/12/2018 for the SalesZone West.
- MinString
This function finds and returns the first value loaded in a field of a table as the minimum string.
Syntax:
MinString(expr)
For example, in the sample script given below, we will get the minimum string or the string loaded last in order.
TeamData:
LOAD * inline [
SalesZone|Team|Date
East|Gamma|01/05/2018
East|Gamma|02/05/2018
West|Zeta|01/06/2018
East|Alpha|01/07/2018
East|Delta|01/08/2018
West|Epsilon|01/09/2018
West|Eta|01/10/2018
East|Beta|01/11/2018
West|Theta|01/12/2018
] (delimiter is '|');
The function, MinString(Date) will return 01/05/2018 for East SalesZone and 01/06/2018 for the SalesZone West.
f. Synthetic dimension functions
The synthetic dimension functions create values synthetically which are not a part of the fields that load in the script. The values created by synthetic dimension functions reside in a synthetically created dimension. We can use the values of the synthetic dimension in charts as a calculated dimension and contain values arising from the existing dimension from the tables loaded in the script. We call such dimensions as dynamic synthetic functions. The values in such dimensions does not affect by selections made in other fields.
We can use it only in chart expressions and not in script expressions.
- ValueList
This function creates a set of row labels or strings as the newly formed synthetic dimension which will contain values of calculations made with values of other fields.
Learn more about Qlik Sense Null Functions
Syntax:
ValueList(v1 {,...})Where v1 shows the list of dimension names that separate by comma which you want to create.
,…. Is the added list of more dimensions.
For example,
SalesRecord:
LOAD * INLINE [
SaleID|Amount|Year
1|1|2018
2|1|2018
3|1|2018
4|2|2018
5|2|2018
6|2|2018
7|2|2018
8|1|2017
9|1|2017
10|2|2017
11|2|2017
12|2|2017
] (delimiter is '|');
We will create 3 new synthetic dimensions from the function ValueList()which will use the values given in the table.
IF(ValueList(‘Number of Orders’, ‘Average Order Size’, ‘Total Amount’) = ‘Number of Orders’, count(SaleID),’Average Order Size’, avg(Amount), ‘Total Amount’, sum(Amount) ))
This will give us three new row labels in the resultant table.
| Synthetic Dimensions | Year | Values |
| Number of Orders | 2017 | 5.00 |
| Number of Orders | 2018 | 7.00 |
| Average Order Size | 2017 | 13.20 |
| Average Order Size | 2018 | 15.43 |
| Total Amount | 2017 | 66.00 |
| Total Amount | 2018 | 108.00 |
- ValueLoop
This function returns a set of values created automatically from iterations occurring from the start to end value. These newly created values reside in a synthetic dimension.
Syntax:
ValueLoop(from [, to [, step ]])
Where, from is the start value of the range or set of values this function will generate.
to is the end or last value of the range or set of values this function will generate.
step is the size of increment for calculating each new value in the range or set of values.
For example, ValueLoop(1,50) will create a list of values from 1 to 50.
Or, ValueLoop(2,10,2) will increment each value starting from 2 to two values further and return 2,4,6,8, and 10.
g. Nested aggregation
Nested aggregation is done when the user wants to apply an aggregation on the result of another aggregation function, hence, known as nesting aggregations. In Qlik Sense, you can nest up to 100 aggregation functions one in the other. A very important condition for nesting the aggregation functions, you must use the TOTAL qualifier in the inner expressions every time you nest a function.
Recommended Reading – Qlik Sense Day Numbering Functions
For example, notice the expression given below,
Sum(If(Year(OrderDate)=Max(TOTAL Year(OrderDate)), Sales))
Here, the Max() function nest in another aggregation function i.e. Sum(). We use the TOTAL qualifier in the inner expression to validate the nesting in Qlik Sense, otherwise, we will not accept it.
4. Conclusion
So, we finish our lesson on all the varied types of aggregate functions used Qlik Sense. All the aggregate functions apply the specific operation on a set of values aggregated by a similar criterion, like all the values corresponding to a particular year, like 2018, 2019 etc, or a particular customer. Thus, making sorting and structuring the data and information easy and convenient for the user.
See also –
Did you like this article? If Yes, please give DataFlair 5 Stars on Google


