Qlik Sense Tables – Exploring the Tables in Qlik Sense
Job-ready Online Courses: Click, Learn, Succeed, Start Now!
Earlier, we discussed Qlik Sense KPI. In this tutorial, we will explore the most important element of visualizations i.e. the Qlik Sense Tables. However, in the internal logic of Qlik Sense, data is stored and structured in the form of tables but at the user’s end, you have the freedom to select how you would like the data to be displayed, i.e. as a chart, KPI, map etc. But here, our focus will just be on using tables as the visualization.
So, let’s start Qlik Sense Tables Tutorial.
Qlik Sense Tables – Exploring the Tables in Qlik Sense
1. What are Qlik Sense Tables?
Displaying data in tables is simple yet a detailed way of data representation in Qlik Sense. Usually, while using other kinds of visualizations like charts and maps, we analyze them by looking at the trends and patterns they reveal the data. But a table simply shows the data in detail arranged in columns and rows. Data values in a table is always logically associated with the corresponding values spread across rows and columns. The columns can be both dimensions and measures. Also, drilling down in group dimensions in case of large data sets is very convenient to do. Qlik Sense provides many options to display the data values in different ways like setting background color condition, text color condition, visibility condition etc.
What are Qlik Sense Tables
2. How to create a Table in Qlik Sense?
In order to create a table in Qlik Sense, follow the steps given below.
Step 1: Open the editor of the sheet of the application in which you want to create a table. The editor is opened from the Edit option present on the toolbar of the sheet.
Step 2: Select the option Table (from the Assets Panel) and add it to the editing grid at the center by dragging and dropping.
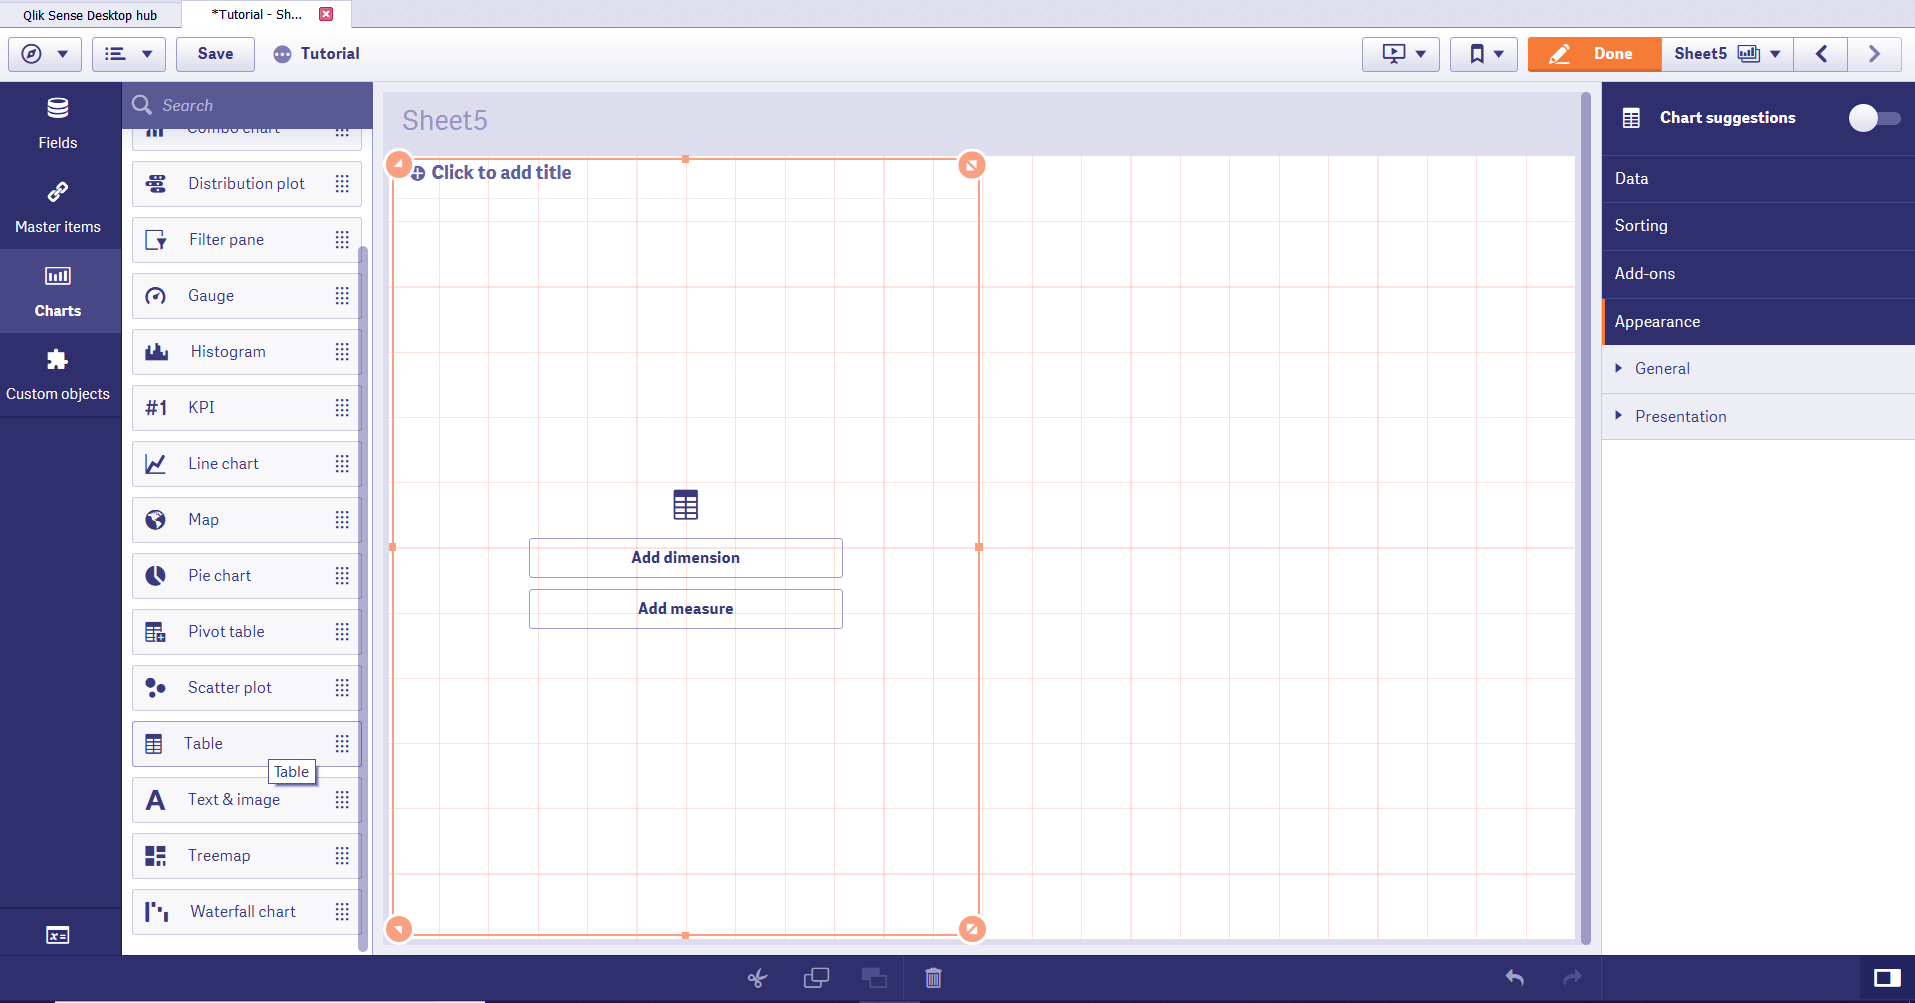
Select Table from Assert Panel
Step 3: Add a measure and dimension to start with creating the table. You add more columns in the table from the properties panel at the right of the editor.
Step 4: Once you are done with selecting and adjusting all the aspects of the table, the table will be displayed on the editor instantly. Click Done to bring it on the sheet.
Recommended Reading – Qlik Sense Table Functions
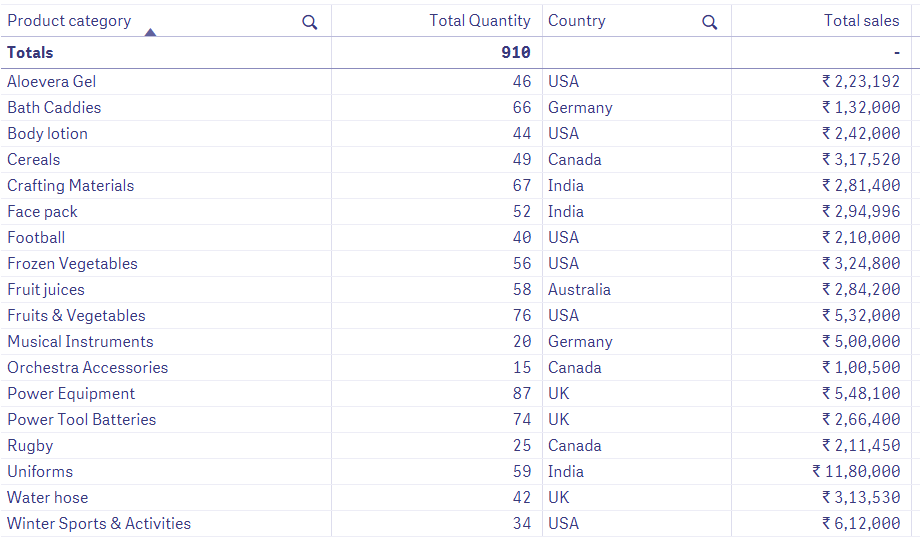
Displaying the Table
We will discuss how to add a column, align the text, format the values, color values, and cells, in the section properties panel given below.
3. Exploring Qlik Sense Tables
In Qlik Sense tables, you can align the text for each column. By default, the text alignment is left for the text values and right for the numeric values. You can change the alignment by changing the setting to Custom option. You can also make selections in tables and search for values through the search lens present in the dimension columns. Search gives quick results.
You can sort a table in four different ways, i.e. row sorting, column sorting, internal sorting, and interactive sorting.
- Column sorting is done usually as per the load order i.e. which column was added first will be the first in the sort order as well. You can change it from the properties panel if you wish.
- Row sorting is the row values based on which other column values are sorted. The column based on whose values sorting is done is indicated by an arrow below the name of that column.
- Internal sorting is the way the values of each column are sorted internally.
- Interactive sorting is the way of sorting values by clicking on the column header. Values are sorted in a certain way upon making the first click and resumes the original state on the second click.
4. Qlik Sense Tables Properties Panel
From the properties panel present at the right of the editor, you can manage different aspects of the table and modify it according to your requirement.
Have a look at Qlik Sense Integer Functions
i. Data
From the data tab, you can add columns for the table. While adding new columns you get to choose whether you want to add a dimension or a measure.
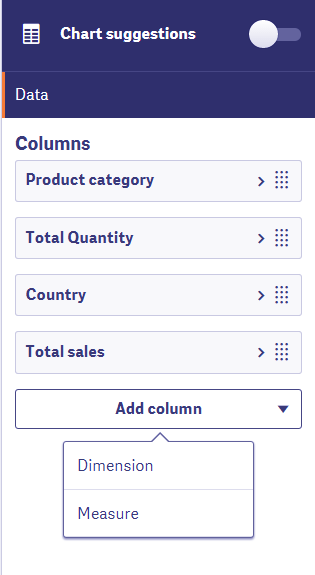
Data Option in Qlik Sense Tables
You can edit each column individually by clicking on the arrow given beside the name of the column. The options include expression, label, number formatting (if it is a measure), column condition, background color expression, text color expression, total function (if you want to add the totals column), text alignment etc.
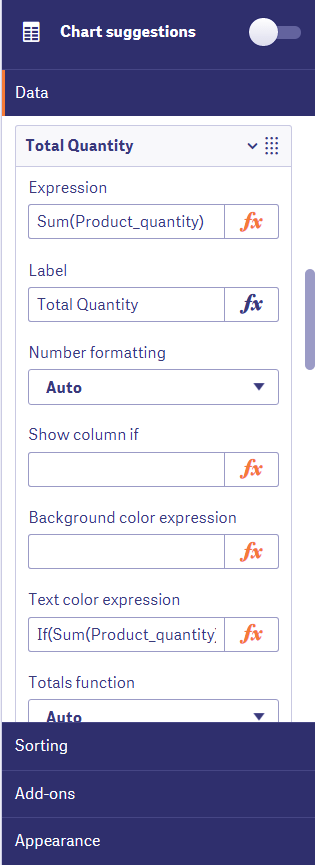
Edit Column in Qlik Sense
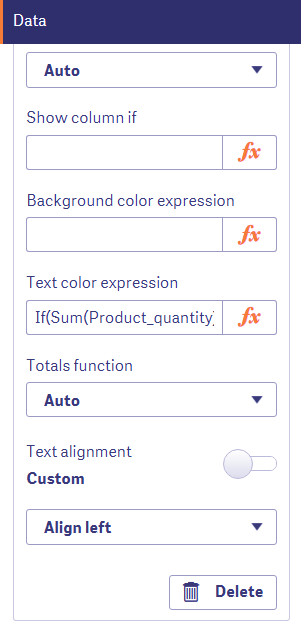
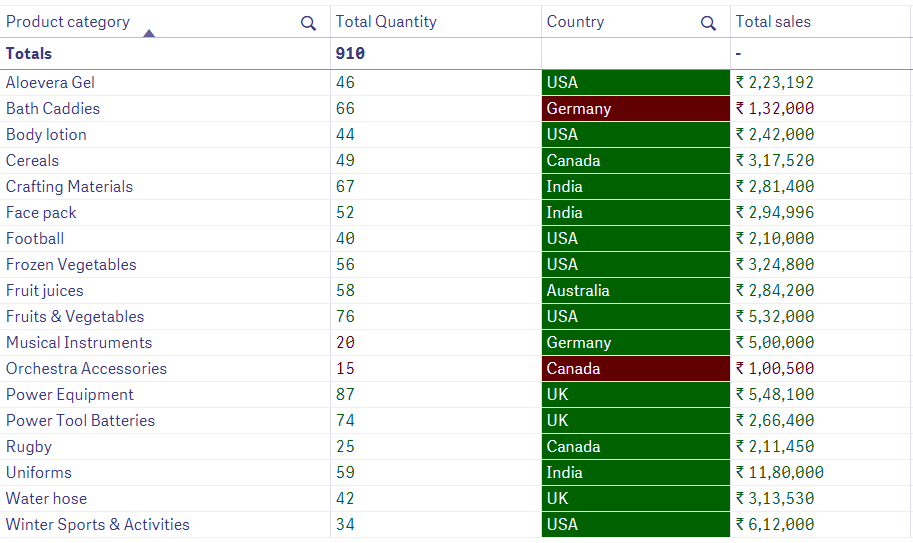
Add the Total column
As you can see in the table that we created earlier, we have put a text color condition on the column labeled Total quantity. The condition is to show the values below 25 in red and all the others in green. Similar conditions have been put on the columns Country and Total sales (values below 1,50,000 in red).
You must read – Qlik Sense System Functions
ii. Sorting
From the sorting tab you can sort the dimensions and measures in different ways, like sort by the expression, sort by load order, sort numerically, sort alphabetically etc.
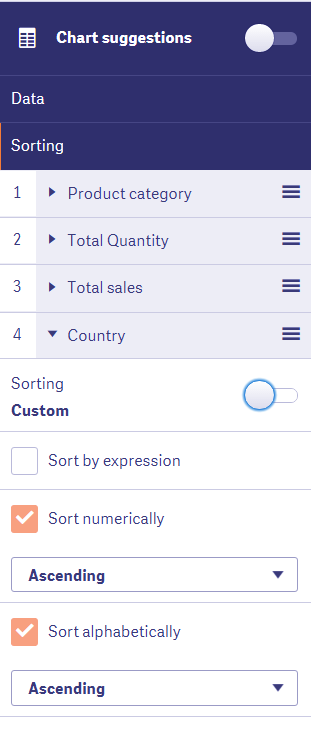
Sorting in Qlik Sense Tables
iii. Add-ons
In this section, you can use the data handling option to apply certain display conditions on the data used in the table. The ‘Include zero values’ option includes all the 0s that are present in a measure field as value and displays them.
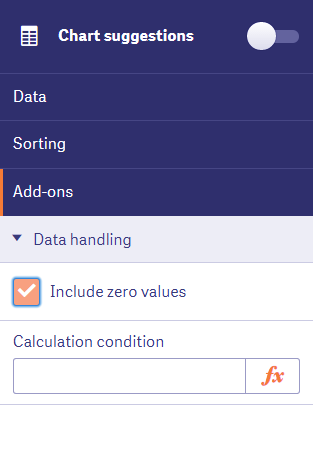
Add-ons in Qlik Sense
iv. Appearance
The appearance section contains all the setting related to the appearance of the table.
The first section is the General section has options for showing or hiding titles or details.
Have a look at Qlik Sense Bookmarking Selections
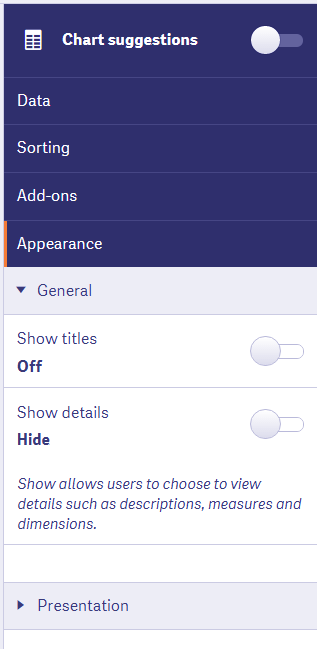
Appearance in Qlik Sense
The Presentation section gives you options to add the totals row at the top of the table. You can also change the position of the totals, edit the label, do text wrapping etc.
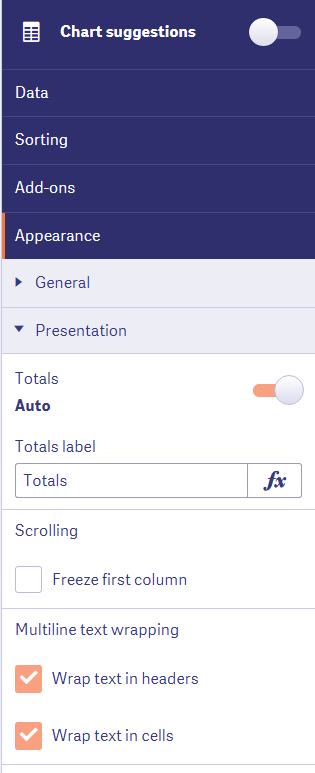
Change the Position in Appearance
So, this was all in Qlik Sense Tables.
5. Summary
We hope this tutorial helped you in understanding tables in Qlik Sense better. So, now you can make a table using your data set in Qlik Sense and apply expressions and conditions on them. However, plan to make tables in such a way that you do not overload it with too many data and rows.
If you have any queries or suggestions related to Qlik Sense Tables, leave a comment in the comment box below.
You may like –
If you are Happy with DataFlair, do not forget to make us happy with your positive feedback on Google


