Qlik Sense Text and Image Visualizations – Create Text & Images
Expert-led Online Courses: Elevate Your Skills, Get ready for Future - Enroll Now!
1. Objective
Earlier we saw Qlik Sense Histogram Visualization. Today, we will see Qlik Sense Text and Image Visualization. Moreover, we will look at how to create and edit Qlik Sense Text and Image. Also, we will see creating and removing a link in Qlik Sense.
Qlik Sense is full of visualizations which represent data graphically in different ways. But, we also need a tool which contains and displays descriptive and informative texts providing context to the data that is been analyzed. In this article, we will take you through the basics of a visualization type, Text & Image in Qlik Sense.
So, let’s start Qlik sense Text and Image visualization tutorial.
Qlik Sense Text and Image Visualizations – Create Text & Images
Have a look at Qlik Sense Gauge Chart
2. Significance of Text & Image in Qlik Sense
Texts and image complement the other types of visualizations like charts, tables, etc used in Qlik Sense as they work as information centers for the visualizations being shown on the sheet giving them meaning and relevance. Using the Text & image option, you can add text, image, hyperlink and dynamic measures aiding to the visuals of graphs and charts. The text and image option are not interactive and so, you cannot make selections in this box. However, you can set expressions in such a way that the value of measures changes with relevant selections made in any other visualization. For instance, if you add a measure in the text box for Total Sales per product category then the text box will show total sales of that product category which you select from other visualization like a bar chart, table, filter pane etc.
The most common use of Text & image visualization is for presentation purposes like displaying the company’s logo on the first sheet of the app, add links to sites to provide customers with additional information, put descriptions and important information about the application on the first sheet in the text box, etc. However, the use of measures and the amount of text being displayed on text & image box is limited by a defined capacity of the object to hold data and measures. If you put too much text information or too many measure values, the text box will be cluttered and incomprehensible.
Let’s discuss Qlik Sense Conditional Functions
3. Creating Qlik Sense Text and Image
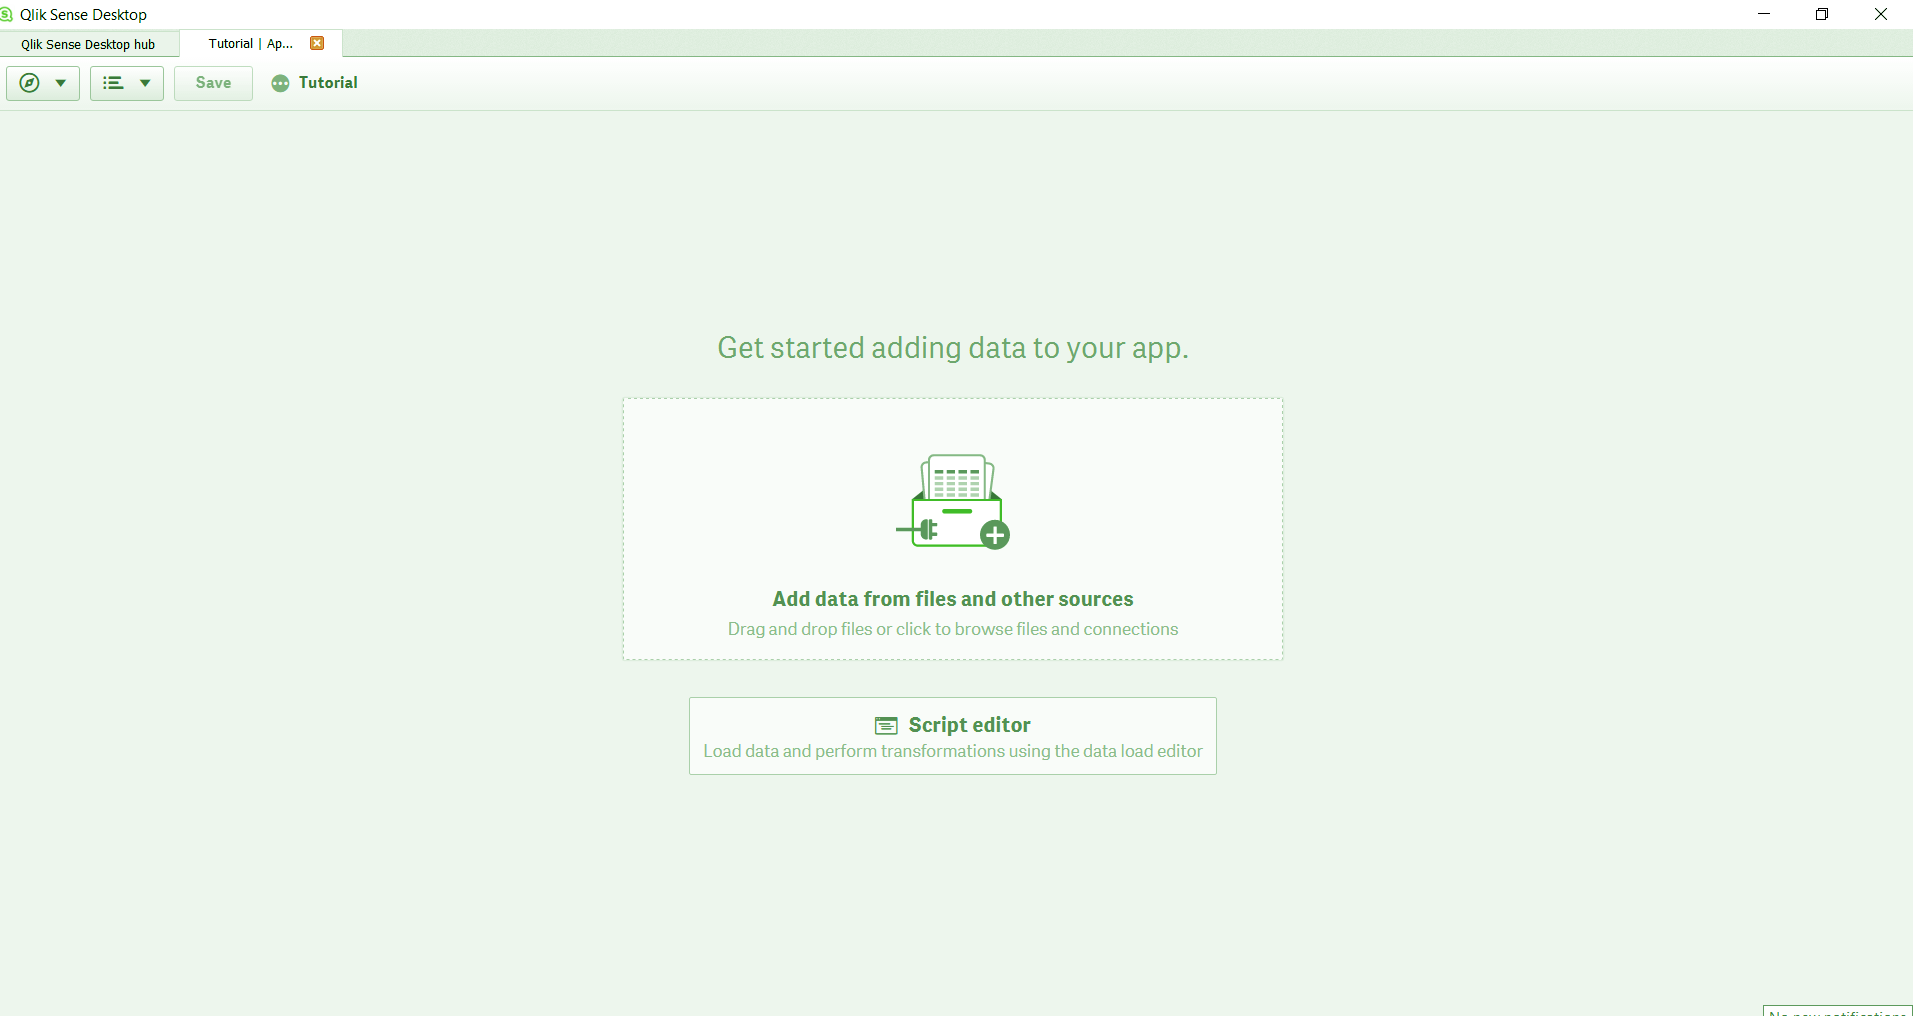
To create a Text & Image visualization, follow the steps given below.
- Open the app in Qlik Sense in which you want to enter this object. Then go to Edit option in the sheet of choice.
- In the editor that opens, go the Assets Panel at the left and select Charts option from there. Then select Text & image option and drag it on the editing grid at the center.
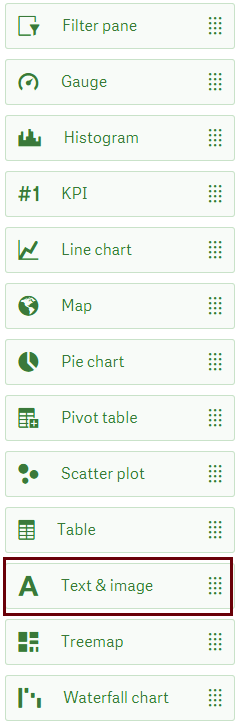
Assets Panel in Qlik Sense Text and Images
Know more about Qlik Sense Pie Chart
- This will put the text and image box in the editing grid in which you can enter and edit the text, add image, hyperlink as well as measures.
Creating Text and Image in Qlik Sense
4. Editing Qlik Sense Text and Image
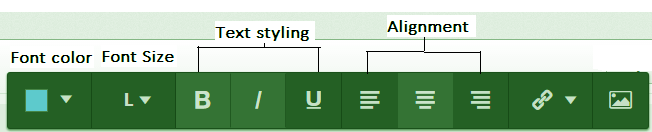
In the Text & image section, you can enter the text manually and edit it from the editing toolbar.
Let’s revise Qlik Sense Counter Functions
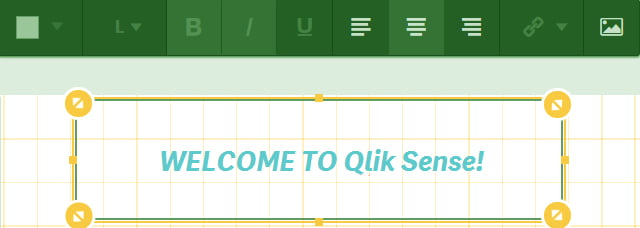
Editing Qlik Sense Text and Image
You can change the color, size, style, and alignment of the text from the toolbar.
Qlik Sense Text and Image – Change Alignment
Let’s take a tour to Qlik Sense Line Chart
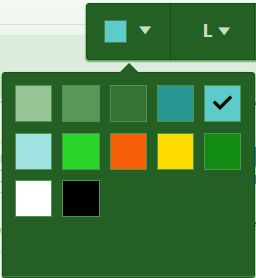
Change the color in Qlik sense Text and Image
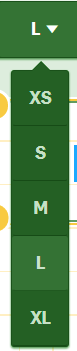
Change the Size
5. Adding an Image in Qlik Sense
You can add images in the Text & image visual through the editing toolbar. Image formats .png, .jpg, .jpeg, and .gif are supported.
To add an image in the text and image box, select the image icon from the editing toolbar.
Read more in Exponential and Logarithmetic Functions

Add an image in Qlik Sense
This will open an image media library which has two ways in which you can select the image. One is In-app and another is the Default folder.
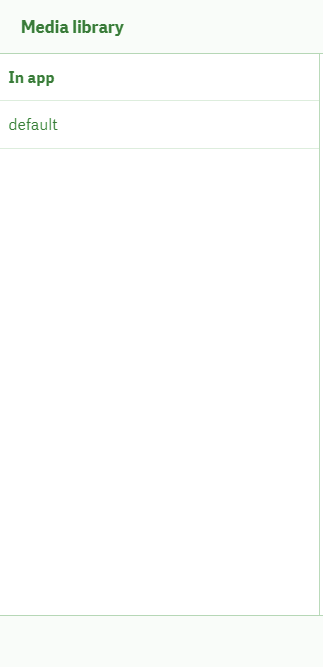
In-app and default folder in Qlik Sense
The In-app folder contains all the images which you have uploaded into the images folder. The path to the folder where you can store in-app images is, C:\Users\<user>\Documents\Qlik\Sense\Content\Default. Another option is to use an image which exists by default in Qlik Sense in the Default folder.
Have a look at Qlik Sense Scatter Plot
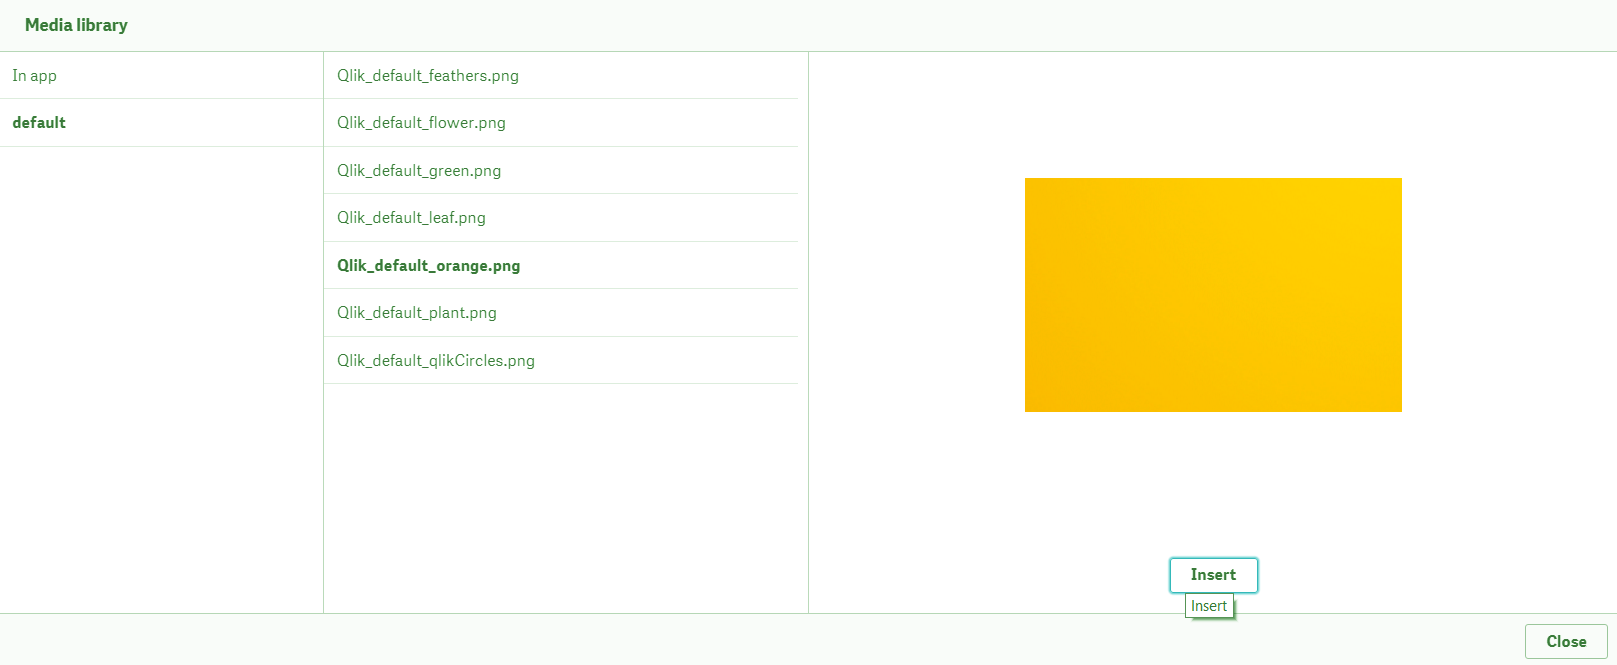
Use an Image in Qlik Sense
Select the image either from In-app or Default folder and click on Insert. This will add the image in the text and image box.
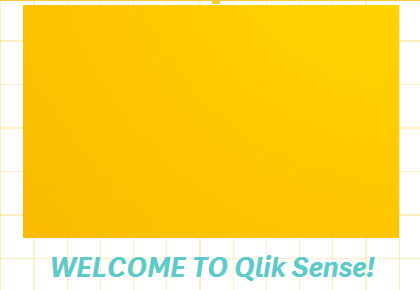
Add image in the text and image box
6. Creating and Removing a Link
You can also create and add a link in the Qlik Sense text and image box from the link icon present in the toolbar. To add a link, you can simply use the starting of text section present in the app which you want to add as a link somewhere else on the app. The software will automatically add https:// in front of the text you enter and make it a link. Click on the link icon again to save the newly created link. The link will appear on the text and image box when you put the cursor on it and can be opened by clicking on it.
You must read Qlik Sense Mapping Functions
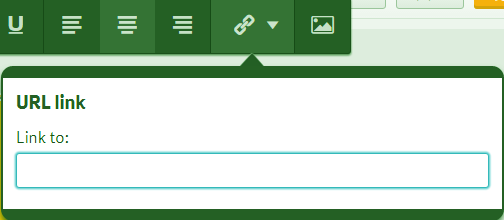
Add a link in Qlik Sense
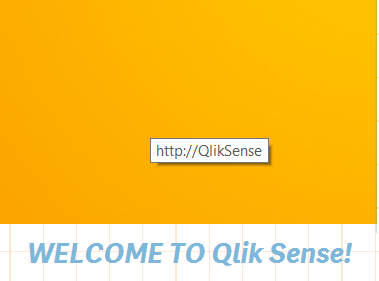
Create a link in Qlik Sense
To delete a link, click on the link icon from the text & image toolbar and click on the Delete icon to remove a link.

Delete a link in Qlik Sense
7. Adding and Deleting a Measure
Measures are added to highlight some statistical facts revealed by data about the situation being analyzed. Measures can be added in the text & image box in three ways,
Do you know about Qlik Sense Null Functions
- From Fields section in the Assets Panel.
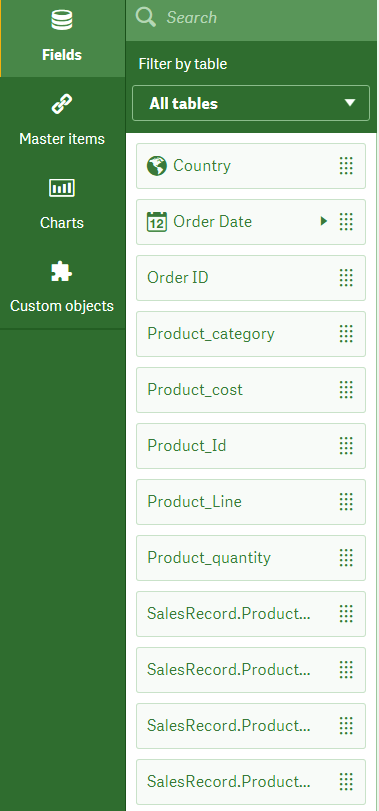
Field Sections in assets panel
- From Master Items in Assets Panel. Drag and drop the measure on the text & image box.
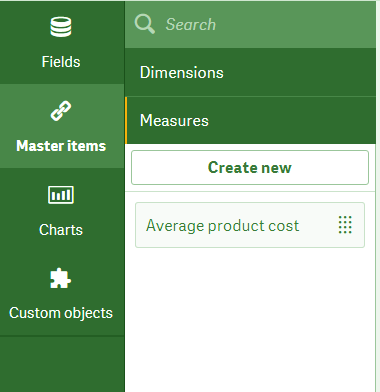
Master Items in Assets Panel
- From the Data section using the Add Measure option in the exploration menu/properties panel.
Read more in Qlik Sense Mathematical Functions
Add Measure in Qlik Sense Text and Image
This will add a measure in a token form. The measure is shown as a token in the image given below.
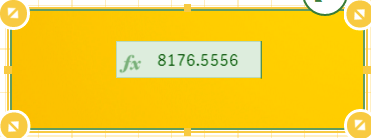
Add Measure in Token Form
The measure value will change as you make selections in any other visualization. Look in the image below, the text and image object shows the measure value (Average Product Cost) corresponding to the selection made in the bar chart on ‘Apparel & Accessories’.
Do you know about Qlik Sense Logical Functions
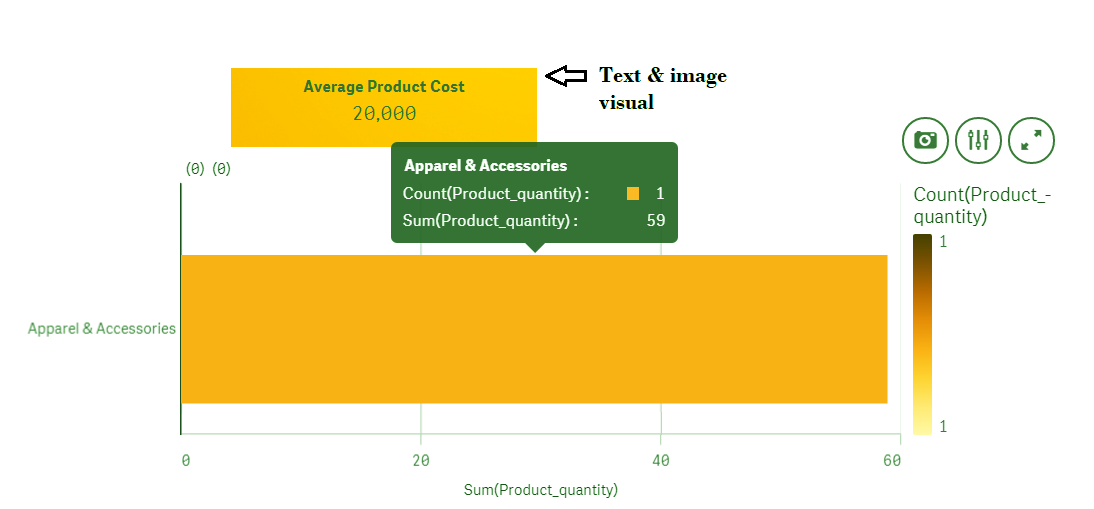
Apparel and Accessories in Qlik Sense
To delete or remove the measures from the text and image box, right click on the measure token and click on Delete from the menu. Or, put the cursor after the token and press Backspace key. You can also do it from the Properties or exploration panel present on the right.
8. Properties Panel in Qlik Sense Text and Image
There are two sections in the properties panel.
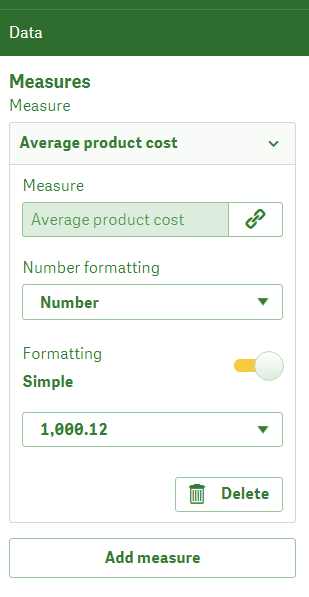
a. Data section
In the data section, you can add as many data measures as you want. Here, you can set the formatting of the measure numbers.
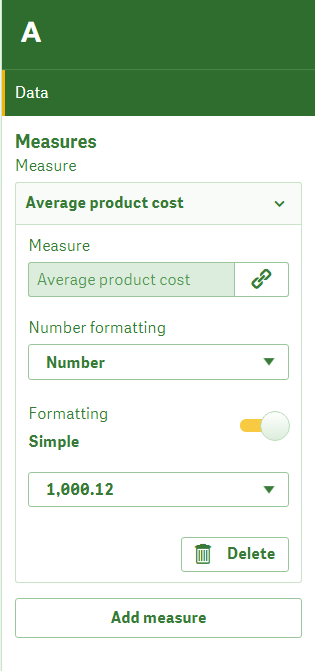
Data Section in Qlik Sense
Let’s take a tour to Qlik Sense Trigonometric and Hyperbolic Functions
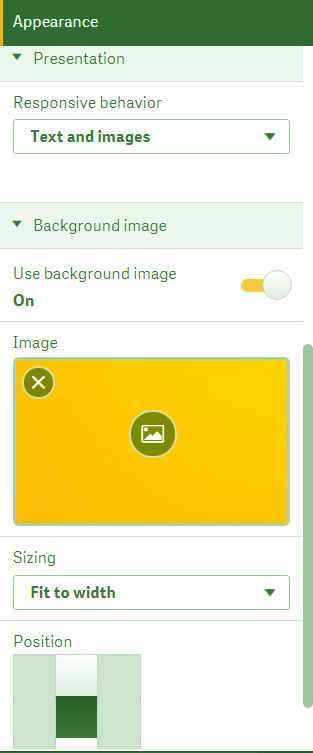
b. Appearance section
From the appearance section, you can edit the layout of the text box. There are three sections under the Appearance section; General, Presentation and Background image from where you can add titles to the text box, set what should hold the responsive nature on the sheet, and set a background image.
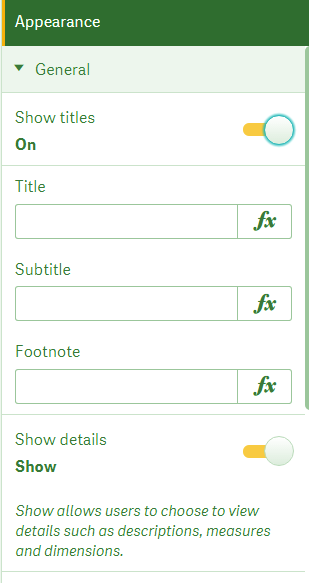
Appearance section in Qlik Sense
Qlik Sense Text and Image Appearance Section
Have a look at Qlik Sense Data Model
So, this was all in Qlik Sense Text and Image. Hope you like our explanation.
9. Conclusion
Hence, this Qlik Sense text and image visualization is a very useful option as it lets you highlight the important points from the entire data set that you use in your application. It provides context to the data and helps in personalizing the app and draw important insights from the data set.
Still, if you any query, ask in the comment tab.
See also –
Qlik Sense Career Opportunities
You give me 15 seconds I promise you best tutorials
Please share your happy experience on Google


