Qlik Sense Visualization Expressions – Aggregation & Modifiers
Placement-ready Courses: Enroll Now, Thank us Later!
1. Objective
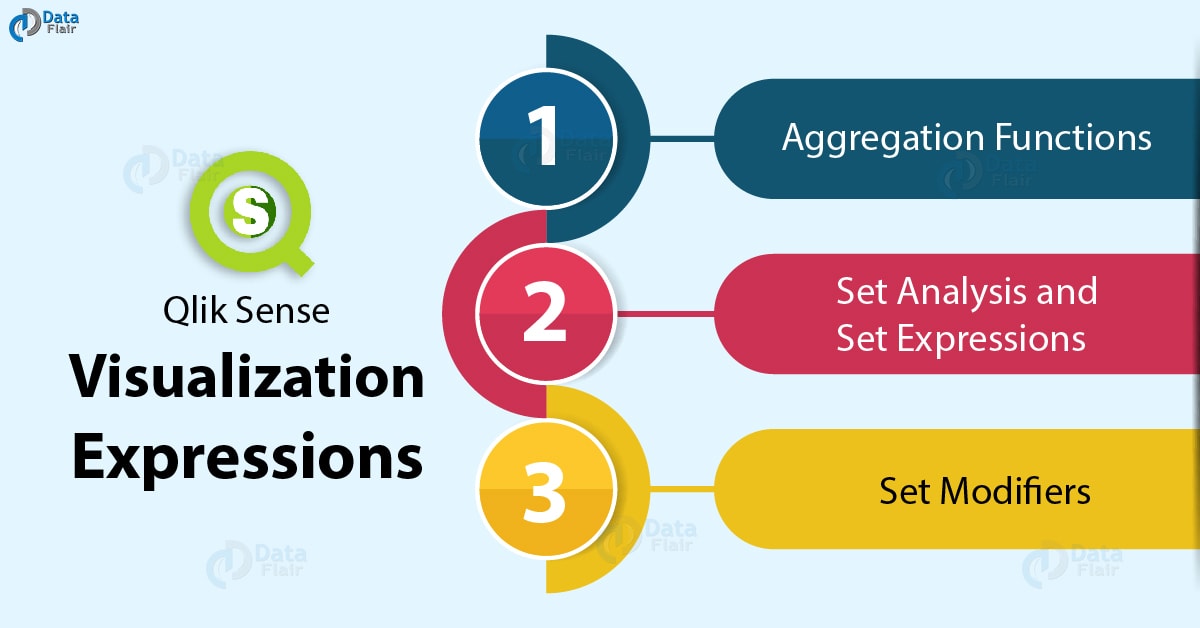
In our last tutorial, we discussed Qlik Sense Selections. In this tutorial, we are going to learn about the Qlik Sense Visualization Expressions. Also, we will see how to use Visualization Expressions in Qlik Sense. Visualization expressions are similar to the chart expressions we learned in QlikView.
So, let’s start with Qlik Sense Visualization Expressions tutorial.
Qlik Sense Visualization Expressions – Aggregation & Modifiers
2. What are Visualization Expressions in Qlik Sense?
An expression used in any coding language is like an instruction that instructs the machine how to process the given data. Similarly, in Qlik Sense the visualization expressions are the instruction which when applied on specific data fields, process the field values in the instructed way and display the result in the visualization. A visualization expression comprises of fieldnames, mathematical or logical functions and operators (*/+-). The expressions can be created to be applied to static as well as dynamic fields. Usually, logical and mathematical functions are used on measures (numerical and calculable fields) only, but the visualization expressions are applicable on dimensions (static text fields like table’s title, field title etc.) as well. By making dimensions dynamic using visualization expressions, such values will change according to the selections made in the visualization or any associated sheet object for that matter.
i. Qlik Sense Visualization Expressions Syntax
Let’s move on to learn the visualization expression’s general syntax. The syntax is created using the concepts and rules of Backus-Naur formalism. Varied types of visualization expression syntax generally used are listed below,
expression ::= (constant | expressionname | operator1 expression | expression operator2 expression | function | aggregation function |(expression))
- This translates to: an expression can be defined as constant string having text or numbers. The text is enclosed in single quotation marks.
- Expressionname is the name or label of an already existing expression in the same visualization.
- Operator1 stands for a unary operator that applies only to the values on the right.
- Operator2 is a binary operator that applies to the values on both sides of the operator.
- A function is applied following the syntax-
function ::= functionname ( parameters )
prameters ::= expression { ,expression }- Aggregation functions can also be defined,
aggregationfunction ::= aggregationfunctionname ( parameters2 )
parameters2 ::= aggrexpression { , aggrexpression }
3. Aggregation Functions in Qlik Sense
Aggregation is a crucial function to be used in any Business Intelligence tool because it covers the data being evaluated as a whole/aggregate and returns result accordingly. This is of great use because generally enterprises use data in bulk and applying functions on individual fields and value could be a next to impossible task. Most commonly used aggregate functions are Sum, Average, Min, Max etc.
i. Defining the Scope of Aggregation
Every time aggregation is applied on a data set, the scope of aggregation must be defined. By scope it is meant that which data values or records are relevant. Aggregation is only applied over the relevant data hence defining scope is necessary. Scope is defined based on two factors, one is Selections and second is Dimensional values. Once these two factors are considered and applied, then after restricting them what remains is only the relevant data values for aggregation.
During defining the scope of Qlik Sense aggregation i.e. setting the limit so that the system takes up only the relevant data is selected by the means of two methods; Total Qualifier and/or Set Analysis. It can also be said that by these methods the scope of aggregation can be re-defined. These methods are used to disregard irrelevant data records so that aggregation function can only be applied to the relevant data values. The method keywords are written within the aggregate function keyword.
The points given below describes the methods in detail.
- TOTAL Qualifier– Using the total qualifier inside your aggregation expression or function disregards the dimensional value. The aggregation will be performed on all possible field values and the calculation is made disregarding all visualization dimension variables except those listed. Such fields that are not currently a dimension in a visualization may be included in the list as well. It is known to be useful in the case of group dimensions, where the dimension fields are not fixed.
- Set Analysis – Using set analysis inside your aggregation expression overrides the selection and the aggregation will be performed on all values split across the dimensions.
- TOTAL qualifier and set analysis – Using the TOTAL qualifier and set analysis inside your aggregation expression overrides or disregards the selection and disregards the dimensions.
- ALL qualifier – Using the ALL qualifier inside your aggregation expression disregards the selection and the dimensions. The same can be done using the {1} set analysis statement and the TOTAL qualifier:
=sum(A11 Sales)
=sum({1} Total Sales)
Let us understand these methods through example. A sample data has been used for the example.
AggregationScope:
LOAD * inline
Year Quarter Amount
2017 Q1 1100
2017 Q2 1700
2017 Q3 1400
2017 Q4 1800
2018 Q1 1000
2018 Q2 1300
2018 Q3 1100
2018 Q4 1400] (delimiter is ‘ ‘);
We will see how the Total Qualifier and Set analysis methods work in restricting irrelevant data values for aggregation. The two methods can be used individually or in combination.
Recommended Reading – Qlik Sense Field Functions
- Total Qualifier is used in the aggregation function when you want the system to disregard the dimensional value i.e. the data values specific to the field ‘Quarter’. The fourth column or field in the table given below uses TOTAL qualifier within a Sum aggregate function ‘Sum(TOTAL Amount)‘ which displays the sum total of all the values in the field ‘Sum(Amount)’. Values from the field in which total qualifier was applied is then used in the expression ‘Sum(Amount)/Sum(TOTAL Amount)’ which gives the percentage ratio of individual dimension values to the total amount.
| Year | Quarter | Sum(Amount) | Sum(TOTAL Amount) | Sum(Amount)/Sum(TOTAL Amount) |
| 3000 | 3000 | 100% | ||
| 2017 | Q2 | 1700 | 3000 | 56.7% |
| 2018 | Q2 | 1300 | 3000 | 43.3% |
- Set Analysis method is used when some selections made in the visualization are to be disregarded. It is different from the total qualifier because it is used when we want to disregard the dimensional values. Whereas in the case of disregarding selections, the system disregards selections made by the user and takes in all the data values from a field.
As done in the sample visualization below. The set analysis is included with Sum aggregation function ‘Sum({1} Amount)’. In this field, all of the values which are not present in the ‘Sum(Amount) column (because Q2 is selected) are present as a result of disregarding the selection made on Q2. The {1} in this expression denotes set definition and instructs the machine to ignore the selections and consider all of the values in the record.
The final expression for calculating the percentage is ‘Sum(Amount)/Sum({1} Amount)’ gives as a result the ratio of the values in Sum(Amount) field that includes selections to the values of the field Sum({1} Amount) where set analysis is applied.
| Year | Quarter | Sum(Amount) | Sum({1} Amount) | Sum(Amount)/Sum({1}Amount) |
| 3000 | 10800 | 27.8% | ||
| 2017 | Q1 | 0 | 1100 | 0% |
| 2017 | Q3 | 0 | 1400 | 0% |
| 2017 | Q4 | 0 | 1800 | 0% |
| 2017 | Q2 | 1700 | 1700 | 100% |
| 2018 | Q1 | 0 | 1000 | 0% |
| 2018 | Q3 | 0 | 1100 | 0% |
| 2018 | Q4 | 0 | 1400 | 0% |
| 2018 | Q2 | 1300 | 1300 | 100% |
- You can also use TOTAL qualifier and set analysis together. As you can see we have applied the two methods together in the column ‘Sum({1}TOTAL Amount)’. This will disregard both the dimensional value and active selections to only present the relevant data.
You must read Qlik Sense Inter Record Functions
| Year | Quarter | Sum(Amount) | Sum({1}TOTAL Amount) | Sum(Amount)/Sum({1}TOTAL Amount) |
| 3000 | 10800 | 27.8% | ||
| 2017 | Q2 | 1700 | 10800 | 15.7% |
| 2018 | Q2 | 1300 | 10800 | 12% |
General Aggregation syntax
The general syntax used when defining an aggregate function/expression is,
Aggrexpression ::= ( fieldref | operator1 aggrexpression | aggrexpression operator2 aggrexpression | functioninaggr |(aggrexpression) )
Where fieldref is a field name and functionaggr stands for functionname (parameters2).
4. Set Analysis and Set Expressions
Set Analysis is a very useful feature given in Qlik Sense that enables users to compare sets of data within a document. In set analysis, you can select a set of data values (selections applied or not applied) and make it static. That means a particular data set chosen for set analysis will not be associated with other sheet objects and not change with any selections made. Thus, it becomes static. Although, before making a visualization dataset static, there must be a set expression applied to the values in the data set. All the values will be evaluated as instructed by the set expression and the result of that calculation is displayed on the static set analysis box.
Thus, the set expression defines the set of field values and when these defined field values are evaluated according to the set expression, then it is called set analysis. We have a separate tutorial explaining set analysis you can go and check to understand this concept better.
i. Set Expression syntax
The syntax of the set expression is explained here in the backus-naur form.
set_expression ::= {set_entity { set_operator set_entity }}
set_entity ::= set_identifier [ set_modifier ]
set_identifier ::= 1 | $ | $N | $_N | bookmark_id |bookmark_name
set_operator ::= + | - | * | /
set_modifier ::= < field_selection {, field_selection } >
field_selection ::= field_name [ = | += | –= | *= | /= ] element_set_expression
element_set_expression ::= element_set { set_operator element_set }
element_set ::= [ field_name ] | { element_list } | element_function
element_list ::= element { , element }
element_function ::= ( P | E ) ( [ set_expression ] [ field_name ] )
element ::= field_value | " search_mask "
There are two syntax rules while writing a set expression are the set expression must always be an aggregation function (Sum, Max, Min , Count, Avg etc.). And the second rule is that a set expression must be enclosed in curved brackets {}. For example, the expression Sum({$<Year={2017}>} Sales ), the expression {$<Year={2017}>} is the set expression. A set expression is made up of three parts; Identifier, Operator and Modifier.
5. Set modifiers
Set modifiers are used when you want to change or modify an existing state of selections in a set. You can write such modifications in the set expressions in different ways. While writing a modification in a set expression, the field name is given in <> brackets and the selections which must be made on that field is given in {} brackets. For example, Year={2017,2018},Region={US}> or <[Sales Region]={’West coast’, ’South America’}>.
Recommend Reading – Qlik Sense Histogram Visualizations
Set modifiers are written in different ways, such as some based on the values of another field, based on element sets, or forced exclusion.
So, this was all in Qlik Sense Visualization Expressions Tutorial. Hope you like our explanation
6. Conclusion
Hence, in this Qlik Sense Visualization Expressions tutorial, we learned about how Qlik Sense Visualization Expressions are written. Also, we saw how is the scope of Qlik Sense aggregation defined, what are set expressions and how are these expressions modified. Learning about how to use visualization expressions in Qlik Sense visualization helps the user to interact and manage the data fields and values properly.
Still, if you want to ask any query related to Qlik Sense Visualization Expressions, you can freely ask in comments.
See also –
Did you like our efforts? If Yes, please give DataFlair 5 Stars on Google


