Qlik Sense Capabilities – Individuals, Groups, & Organizations
Job-ready Online Courses: Click, Learn, Succeed, Start Now!
1. Objective
In our last Qlik Sense tutorial, we discussed Qlik Sense advantages and limitations. Today, we will see Qlik Sense Capabilities. As we know, Qlik Sense serves a wide spectrum of customers. Customers can fit into categories like Individuals, Groups, and Organizations. So, in this lesson, we are going to explore the key capabilities of Qlik Sense based on each category of user. Qlik Sense provides special features for each type of user. Let us see what are these features?
So, let’s start the Qlik Sense Capabilities Tutorial.
Qlik Sense Capabilities – Individuals, Groups, & Organizations
2. Qlik Sense Capabilities
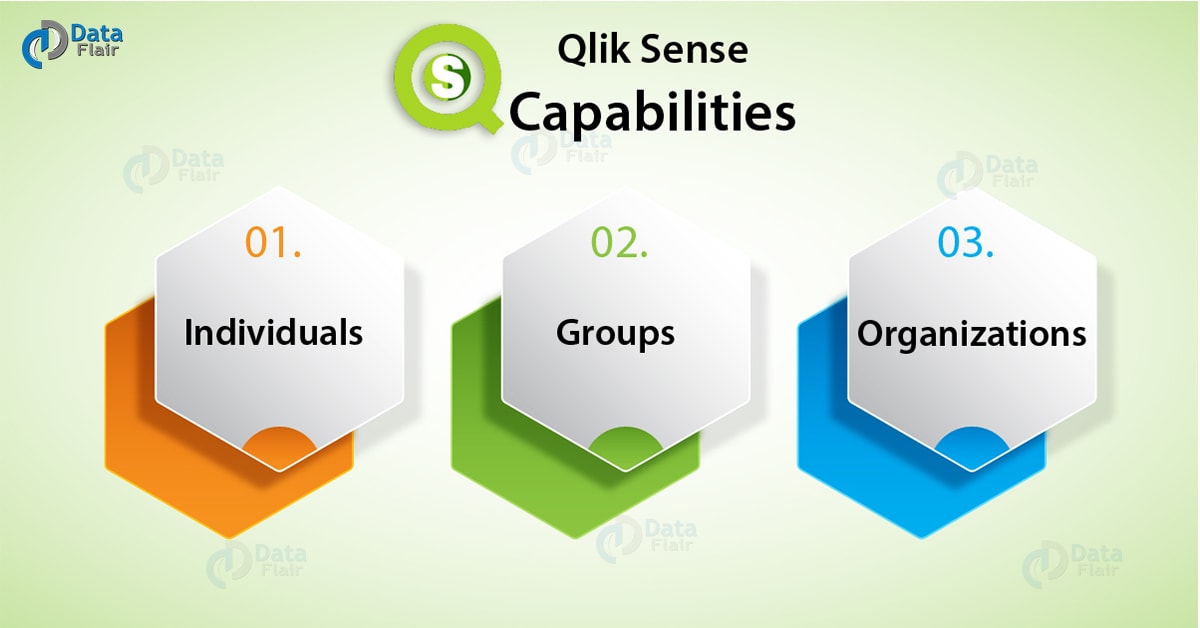
Classification of Qlik Sense Capabilities into 3 parts –
Have a look at Qlik Sense Data Model
- Qlik Sense Capabilities for Individuals
- Capabilities of Qlik Sense for Groups
- Qlik Sense Capabilities for Organizations
So, the functionalities to aid individuals to help such customers who use Qlik Sense as a stand-alone service to do self-service creation and analysis. The functionalities specific to a group, target users who work as a team. In such cases, the focus is to provide centralized collaborative, integrative and reporting facilities. Lastly, another set of functionalities focuses the organizations. Now, in this case, the scope of capabilities widens and tries to include every area like application development, extensions, advanced data preparation, scalability, security and performance which ensures smooth functioning of an organization or an enterprise.
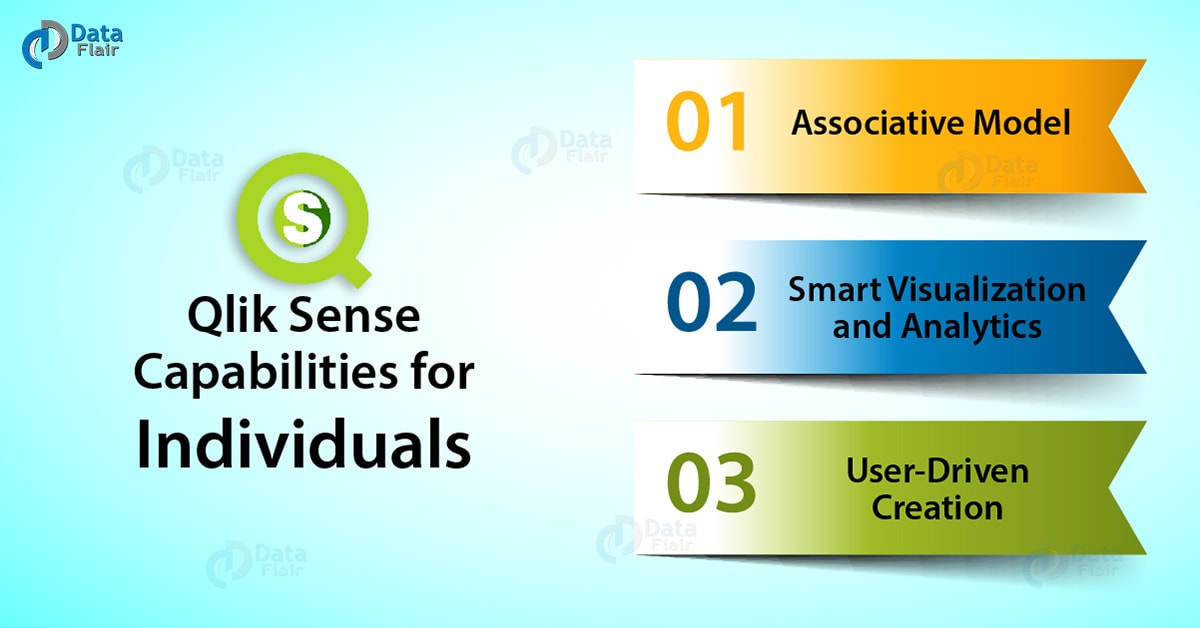
3. Qlik Sense Capabilities for Individuals
So, in this section, we are going to see the Qlik Sense Capabilities provided by the software for the individual users.
Do you know about Qlik Sense Filter Pane
Qlik Sense Capabilities for Individuals
a. Associative Model
The associative model creates a relationship in the data which you can comprehend and use to draw better insights. The associations formed in the data answers a lot of questions regarding the hidden messages and patterns in the data.
i. Associative exploration
Exploring the data in any direction you want without the constraints of a hierarchical or query-based model. The fundamentals of associative models are similar to that of QlikView. It might be quicker in response than QlikView however.
You must read Qlik Sense Selections
ii. Smart Search
The smart search option provides a global search available for the users where you can search for anything and everything. We can search for data with multiple keywords, visual searching, searching within fields and selections. The search returns results as thumbnails of sheet objects if searched for.
iii. Streamlined layout and modern user experience
We use new age graphics and designs for layout, making data analysis more convenient and intuitive. Also, we use HTML5, the latest markup language that supports by all the device platforms.
iv. Advanced navigation
You can navigate easily in the Qlik Sense dashboard using options like global selection pane, responsive table, selection preview, selection excluded view, etc.
v. Visual exploration
Every sheet object that you create in Qlik Sense application, you can make changes instantly using the exploration menu. We can change the properties of visualizations like measures, dimensions, presentation styles, color schemes etc.
b. Smart Visualization and Analytics
The visualizations are very helpful as they are dynamic and smart.
i. Rich Charting
Qlik Sense is loaded with varied types of charting options like pie, column/bar, line/area, scatter, plot, treemap, gauge, and combination charts. Also, geographic mapping options like Choropleths and point layer overlay is available.
Have a look at Qlik Sense Histogram Visualization
ii. Visual Interactivity
All the visualization tools are interactive in nature i.e. they respond quickly to a selection being made. Also, there are informative texts on every option of the sheet objects guiding the user properly.
iii. Intelligent Summarization
It intelligently does the data displays as a visual as the visualization tools adjust their size according to the space available on the dashboard. The color scheme and logarithmic scaling also exist in such a manner so that users find it easier to grasp the information in front of them.
iv. Smart Data Compression
Huge amounts of data can be compressed using advanced compression logarithms which compresses and displays the entire data as scatter points, hotspots, density patches. You can probe deeper into the compressed data progressively to get all the relevant information.
v. Time-Aware Charting
We can display the data having information of a time series in a chart where we sense it by the Qlik Sense’s logic. That the data is a time series and creates a continuous time period chart visualizations.
vi. Qlik GeoAnalytics
This feature is a value-added service which can be used both in Qlik Sense and QlikView. The geo-analytics feature includes a geospatial analysis of location-based data by performing advanced geographic calculations on location and non-location data.
c. User-Driven Creation
There are many features which help the individual users to create their own application without essentially needing a technical hand.
Let’s discuss Qlik Sense Box Plot
i. Drag and Drop Feature
You can load data files or create sheet objects by easily dragging the source item from the destination window and dropping in on the Qlik Sense application dashboard.
ii. Shared Libraries
We create a list of all the objects in Qlik Sense apps that list in a centralized library or repository from which any user can extract the sheet objects, dimensions, measures or visualizations as per their use.
iii. Progressive Creation
By progressive creation, it is meant that you can go only as much deeper as you want in the exploration and manipulation of data. The settings and properties tab unveil their options in layers i.e opens only when selected. By doing so, users get the convenience of keeping the operations as complex or as simple as they want.
iv. Variables
We can easily create variables through a unique user interface.
v. Calendar Measures
You can create a calendar and link it with your data giving it the context of time as well.
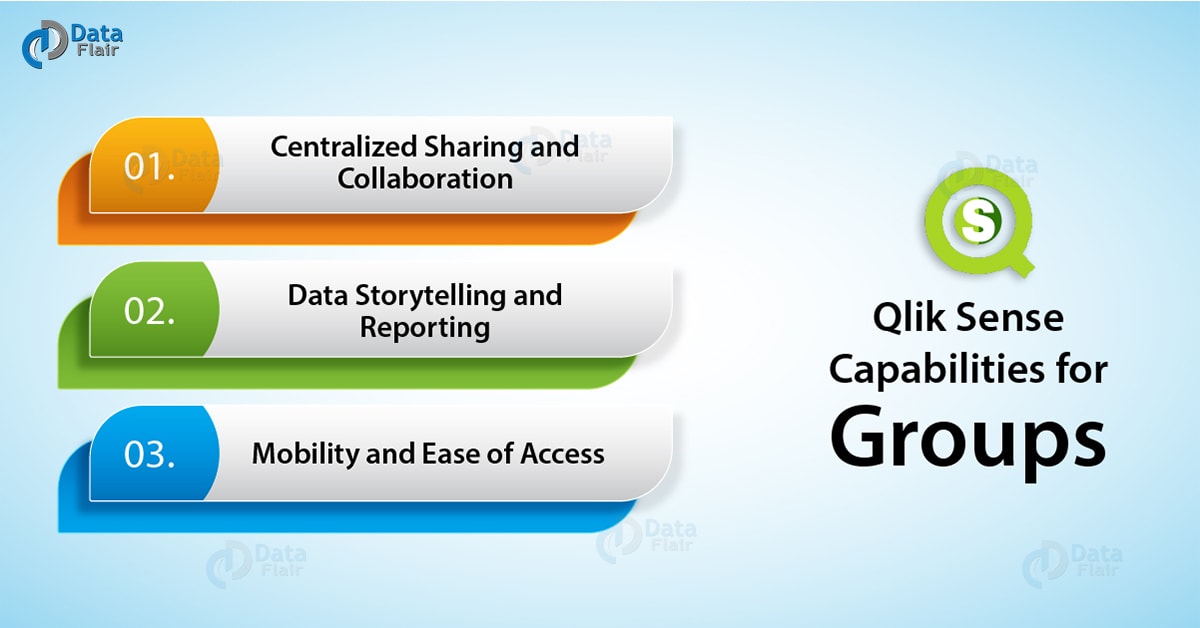
4. Qlik Sense Capabilities for Groups
In this section, we will cover the Qlik Sense Capabilities for Groups –
Qlik Sense Capabilities for Groups
Do you know about Qlik Sense Treemap Visualization
a. Centralized sharing and collaboration
The important operation in a situation where a team or group of users are involved in data analysis is sharing and collaboration.
i. Unified Hub
Sharing and collaboration with other users are facilitated through a unified hub. You can organize the applications and reports based on categories in the hub, search for content using tags and searches, as well as access data from varied sources like Qlik Sense hub, Qlik Sense apps, QlikView apps, Qlik NPrinting reports etc.
ii. Collaborative Creation
Multiple users can work together on common data sets and gain valuable insights through the generated visualizations.
iii. Qlik Sense Cloud
The Qlik Sense Cloud lets the users upload the applications and reports on the cloud from where we can download them and use in any device like a tablet, mobile, another PC, etc.
b. Data Storytelling and Reporting
i. Data storytelling
Qlik Sense’s logic is capable of creating a story on its own from a given set of data which explains the key points revealed by the data. It is done by first capturing the important parts of the application as snapshots, then the snapshots are arranged so that they follow a logical flow. Then informative texts and visual effects are added to the story with the intent of drawing the viewer’s attention to important things.
Let’s learn how to create Applications
ii. Printing and exporting
The sheet objects with or without selections can be exported or printed in various file formats like. PDF, Excel, PowerPoint. Stories, data from charts and graphs can be exported to PowerPoint presentations or as PDFs.
iii. Qlik Nprinting
This is also a value-added appendage which is used for generating graphically sound reports for sharing and printing. It has many features to make a report generated by Qlik Sense or QlikView, the best there can be.
c. Mobility and Ease of Access
i. Unrestricted mobile analysis
Qlik Sense is compatible with platforms like iOS and Android. Thus, Qlik Sense can be used across all the mobile devices in its full capacity, loaded with all the features.
ii. Create anywhere
Qlik Sense gives you the liberty to create and work on applications anywhere because the development platform is entirely web-based and does not require the user to operate from only one fixed device. You can update your information on any device, anywhere through the web and develop applications.
iii. Gesture-based touch UI
For devices having touch screens like tablets and mobile phones, gesture-based touch UI mode is available in Qlik Sense. There is also a redesigned model for making selections by touch gestures. The common gestures used are, tap, swipe, hold-tap, and lasso.
iv. Responsive design
The design of Qlik Sense applications and the objects within it is flexible and responsive. Flexible in the sense that the sheet items automatically adjust themselves according to the screen size that we use. Also, the information on the objects decreases or increases according to the device or screen size. And, responsive in the sense that all this size-specific adjustments and transitions not done by the user but as an automatic response through Qlik Sense.
Know more about Qlik Sense Color Functions
v. Small devices mode
The small device mode is made especially for using Qlik Sense on devices with small screen sizes, typically cell phones. This mode is essentially is a single object mode where you can view and interact with objects. It is compatible with all Android, Windows and iOS devices.
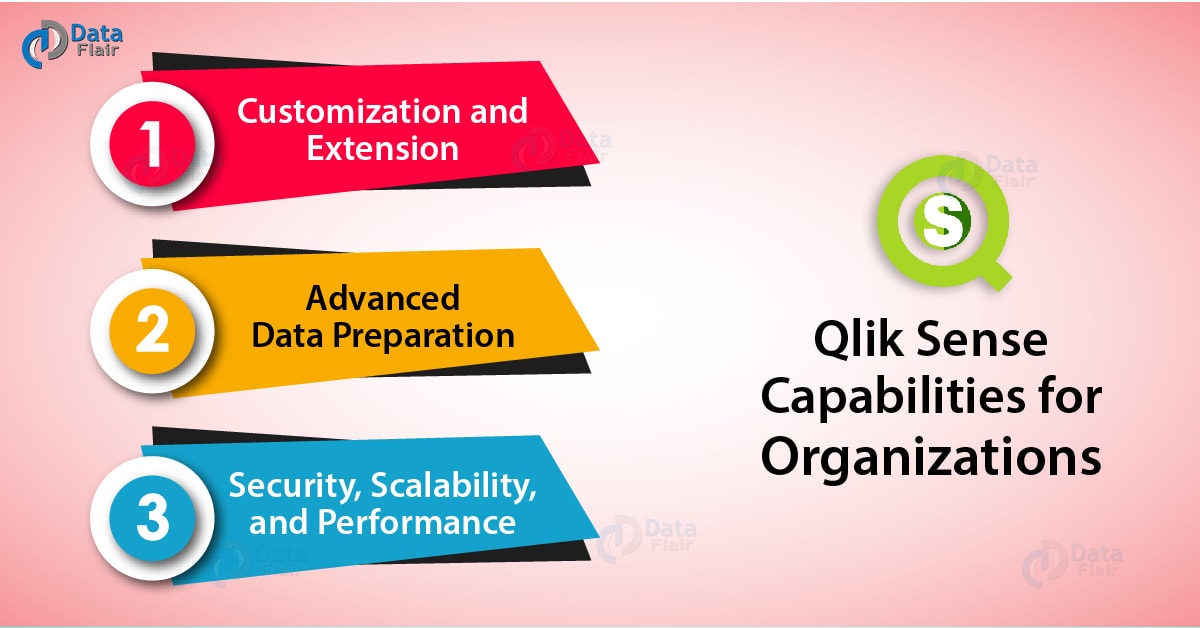
5. Qlik Sense Capabilities for Organizations
Here, we will see Qlik Sense Capabilities for Organizations –
Qlik Sense Capabilities for Organizations
a. Customization and Extension
Qlik Sense’s functionality can be developed, extended and embedded through an open API platform.
Let’s discuss Qlik Sense Pie Chart
i. Custom App Development
Custom web applications can be developed, supported by the Qlik Engine. Web technologies like HTML5, JavaScript, and CSS3 are used, also, libraries like D3 and other JavaScript libraries are supported. While developing applications using JavaScript API, you can incorporate pre-build charts through code commands in the script and the associations between charts and other sheet objects occur automatically by the associative model of the Qlik Engine.
ii. Embedded Analytics
You can embed the Qlik Sense visualizations or objects into a regular web page. These objects like a chart or a table function on the Qlik Engine and manages by Qlik Sense Management Console. Such an integration of Qlik Sense objects into web applications is possible due to JavaScript and Microsoft .NET APIs.
iii. Advanced Development Environment
A suitable work environment for developers is provided by the Qlik Developer’s Hub. In this hub, you can use analytical APIs to develop applications and create BI solutions.
iv. Widgets
The customized applications or objects of the applications can be saved as widgets for later use. A minimal HTML and CSS code is required for creating and storing the objects as widgets. App developers can quickly use these widgets to make a new object from the basics of existing ones.
b. Advanced data preparation
i. Powerful ETL Scripting
We can handle the Extract, Transform and Load (ETL) processes from the script editor. No need of separate ETL tools for data in Qlik Sense.
ii. Visual Data Preparation
We can create Data models easily by visually making an associative model by dragging and dropping the data sets and creating associations between them manually.
iii. Intelligent Data Profiling
Intelligent data profiling is done in which the best ways to handle the data types and files loaded into Qlik Sense from different sources is suggested by the software. It is a very useful feature for the users with a non-technical background.
iv. Data Manager
All the data that is loaded and used in Qlik Sense objects can be managed from the central hub called Data Manager. In the data manager, you can view the data model to see how your data has been structured from the table or data model viewer.
v. Direct Discovery
The Direct Discovery feature allows integration of big data from suitable sources in the main data model of the application. In direct discovery, the data fetched from big data sources do not need to reside in the in-memory of the software, but we establish a direct connection to big data sources.
Have a look at Qlik Sense Counter Functions
vi. On-Demand App Generation
Users can get applications that generate automatically if/when required on a select set of big data. Such auto-generated on-demand applications help in providing a context for analyzing big data. Such apps give the user full freedom to analyze, make selections and explore the big data.
c. Security, Scalability, and Performance
Security, scalability, and performance are the three important pillars of the efficient functioning of Qlik Sense.
i. Centralized, Rules-Based Security
A pre-defined standard set of rule, that all the Qlik Sense components equally follows. The rules for granting access to an authorized user are to read the script codes to authenticate the user and decide what level of access we must grant to the user.
ii. Multiple Security Layers
There are multiple layers of security in Qlik Sense, namely, Network security, Server security, Process security, Application security, Content security. The layered security designed ensures the full security of the components external to the Qlik Sense Desktop that work for Qlik Sense as well as the desktop.
iii. Authentication Security
Before grant access to the user, the authentication security identifies and validates an authorized Qlik Sense user. It uses many authentication models for this.
So, this was all in Qlik Sense capabilities. Hope you like our explanation.
6. Conclusion – Qlik Sense Capabilities
Hence, in this Qlik Sense Capabilities Tutorial, we saw the complete account of the capabilities of Qlik Sense based on the type of user. Moreover, we discussed the Qlik Sense capabilities for individuals, groups, and organization. So, this knowledge will help you in understanding the reason behind all the practical tasks and operations which we will learn in the lessons to come.
Still, if want to add or ask something related to Qlik Sense Capabilities, ask in the comment tab.
See also –
Did we exceed your expectations?
If Yes, share your valuable feedback on Google


