QliK Sense Collaboration – How To Share Data in Qlik Sense?
Placement-ready Online Courses: Your Passport to Excellence - Start Now
Earlier, we have discussed Qlik Sense Managing Data. Today, we will see Qlik Sense Collaboration. Moreover, we will discuss how to collaborate and share data through various practices in Qlik Sense. There are three ways by which you can collaborate with other Qlik Sense users and share your apps with them, i.e. data storytelling, publishing, exporting and printing.
So, let’s start Qlik Sense Collaboration Tutorial.
QliK Sense Collaboration – Data Storytelling
1. Ways of Qlik Sense Collaboration
So, following are the 3 ways for Qlik Sense Collaboration –
i. Qlik Sense Data Storytelling
The data storytelling in Qlik Sense provides a way to present data insights as a form of a compelling story through which users understand the purpose of analysis, the insights are drawn from the analysis using the given data, and what conclusion must be derived from the analysis done. Qlik Sense provides a very interactive dashboard to create the story easily. Every Visualization in Qlik Sense that you use is linked to the original analysis sheet, where you can redirect from the story view to the full analysis view providing all the intricate details.
Qlik Sense Data Storytelling manifests the concept of Qlik Sense Collaboration very well, as in a story collective efforts and insights of all those who are a part of the analysis are put and the story is created to be shared with others. In Qlik Sense, the main elements of a story are the insights that you collect in the form of snapshots of the visualizations present on a sheet. You can access the snapshots from a collection of them and edit them accordingly to use them in the story. Also, in the stories, you can insert live or real-time data sheets into the slides in which the users can make selections and interact with the data outcomes.
Every story is comprised of two main elements, snapshots, and live data sheets.
- The snapshots are like the screenshots that you take of the visualization when they are in a particular state. The snapshots store a visualization in a particular state which does not change with the selections made in the sheet. Although, each snapshot is linked to its actual real-time visualization or chart residing in the sheet which you can access from the story.
- You can use the live data sheets in the story which lets you interact with the charts and make selections in them. Upon making selections on the live data sheets, the data information on the charts change as per the selections made within the story view. You do not have to go to the sheet view from the story view to make selections in the charts.
To create a story, go to the story icon in the toolbar of the sheet view.

Qlik Sense Collaboration – Story Icon
To take snapshots of visualizations and charts, put the cursor on the visualization that you want to take the snapshot of. You will see a camera icon on the top right corner of the visualization, click on that and add an annotation if you wish to. The annotations are not shown in the story but are just to give the screenshot a description.
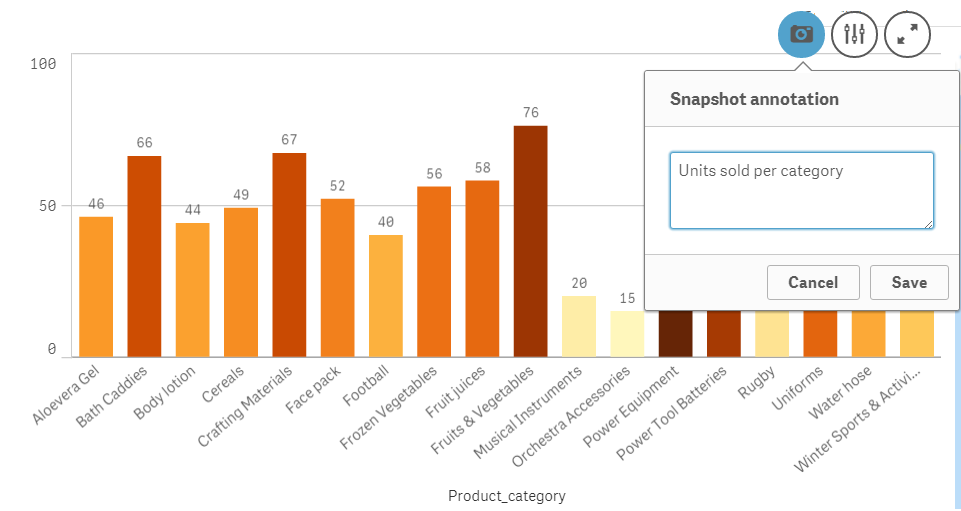
Visualizations and Charts
In the story view, you can add snapshots, text, shapes, effects, active sheets etc from the panel given at the right. You can drag and drop items from this panel and adjust them on the central grid. Also, you can mark the highest or lowest in a chart. You can preview or play the story from the green play button present at the top left corner of the story editor. To add more slides to the story, use the plus icon present at the bottom left corner.
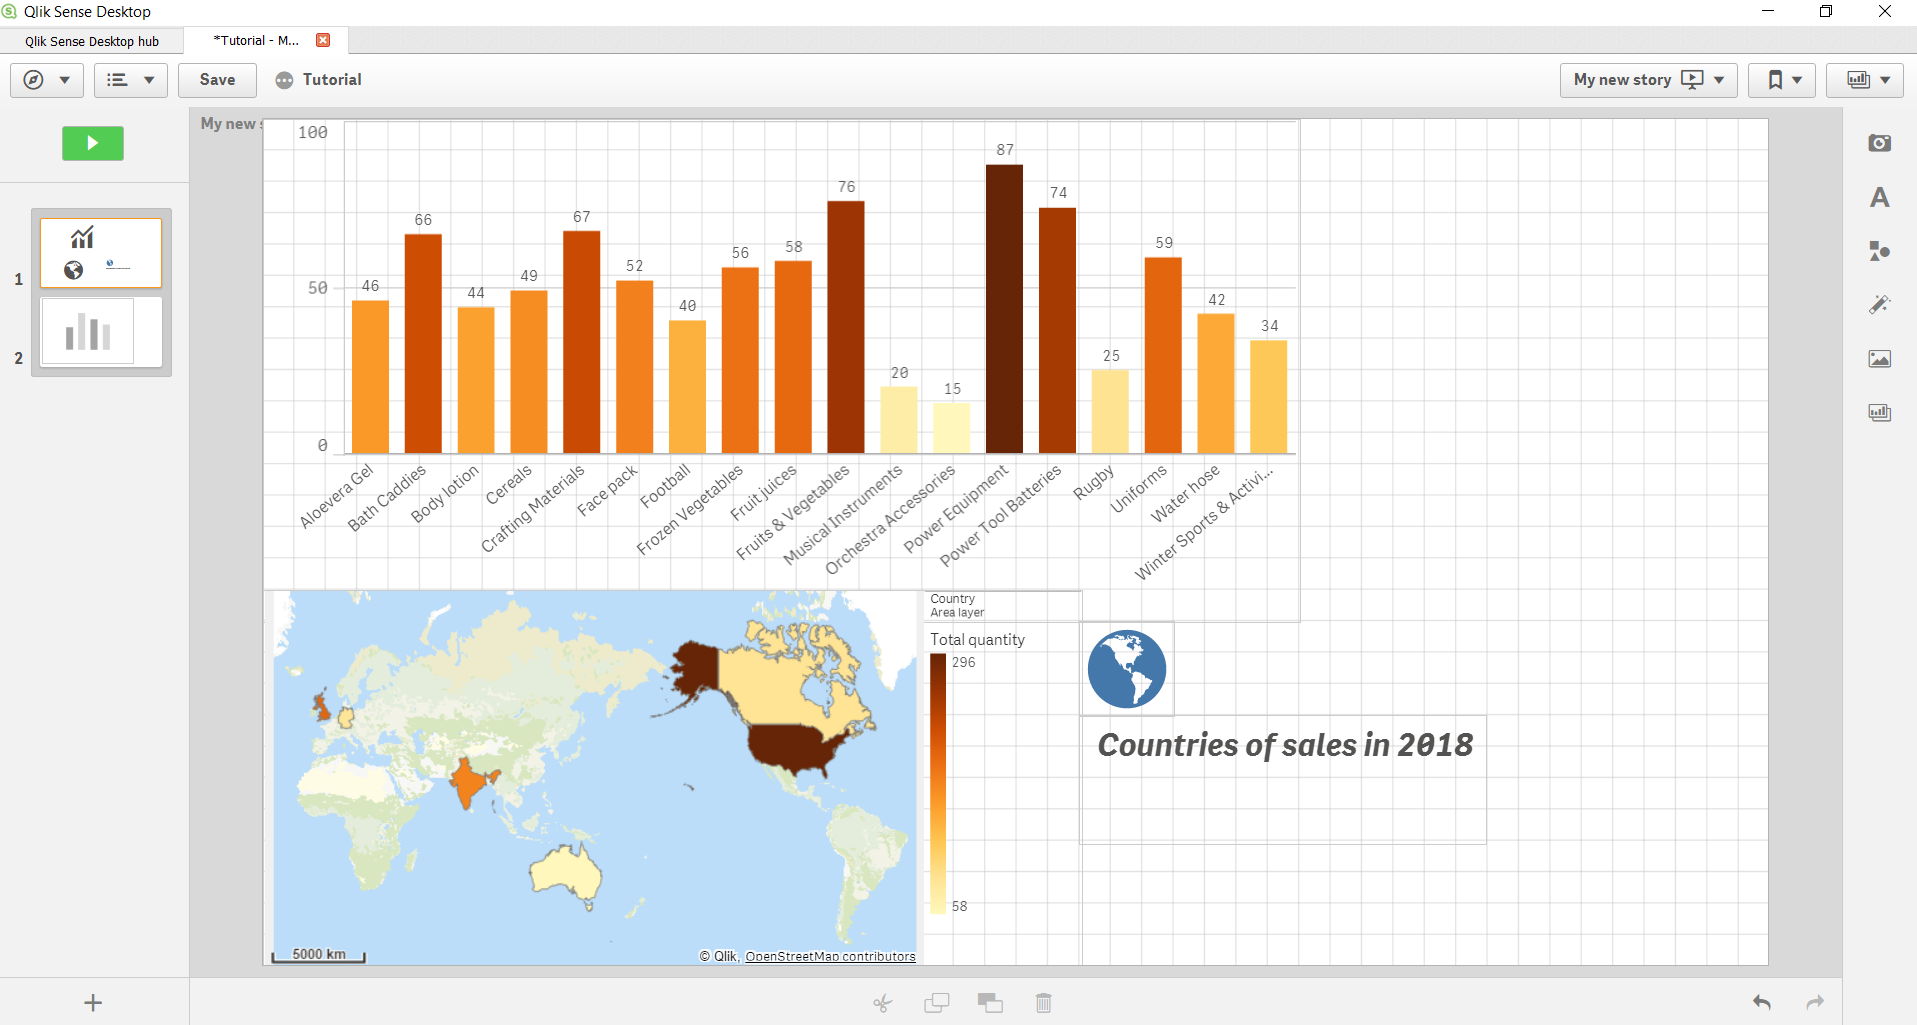
Add More Slides in the Story
The final story looks like this.
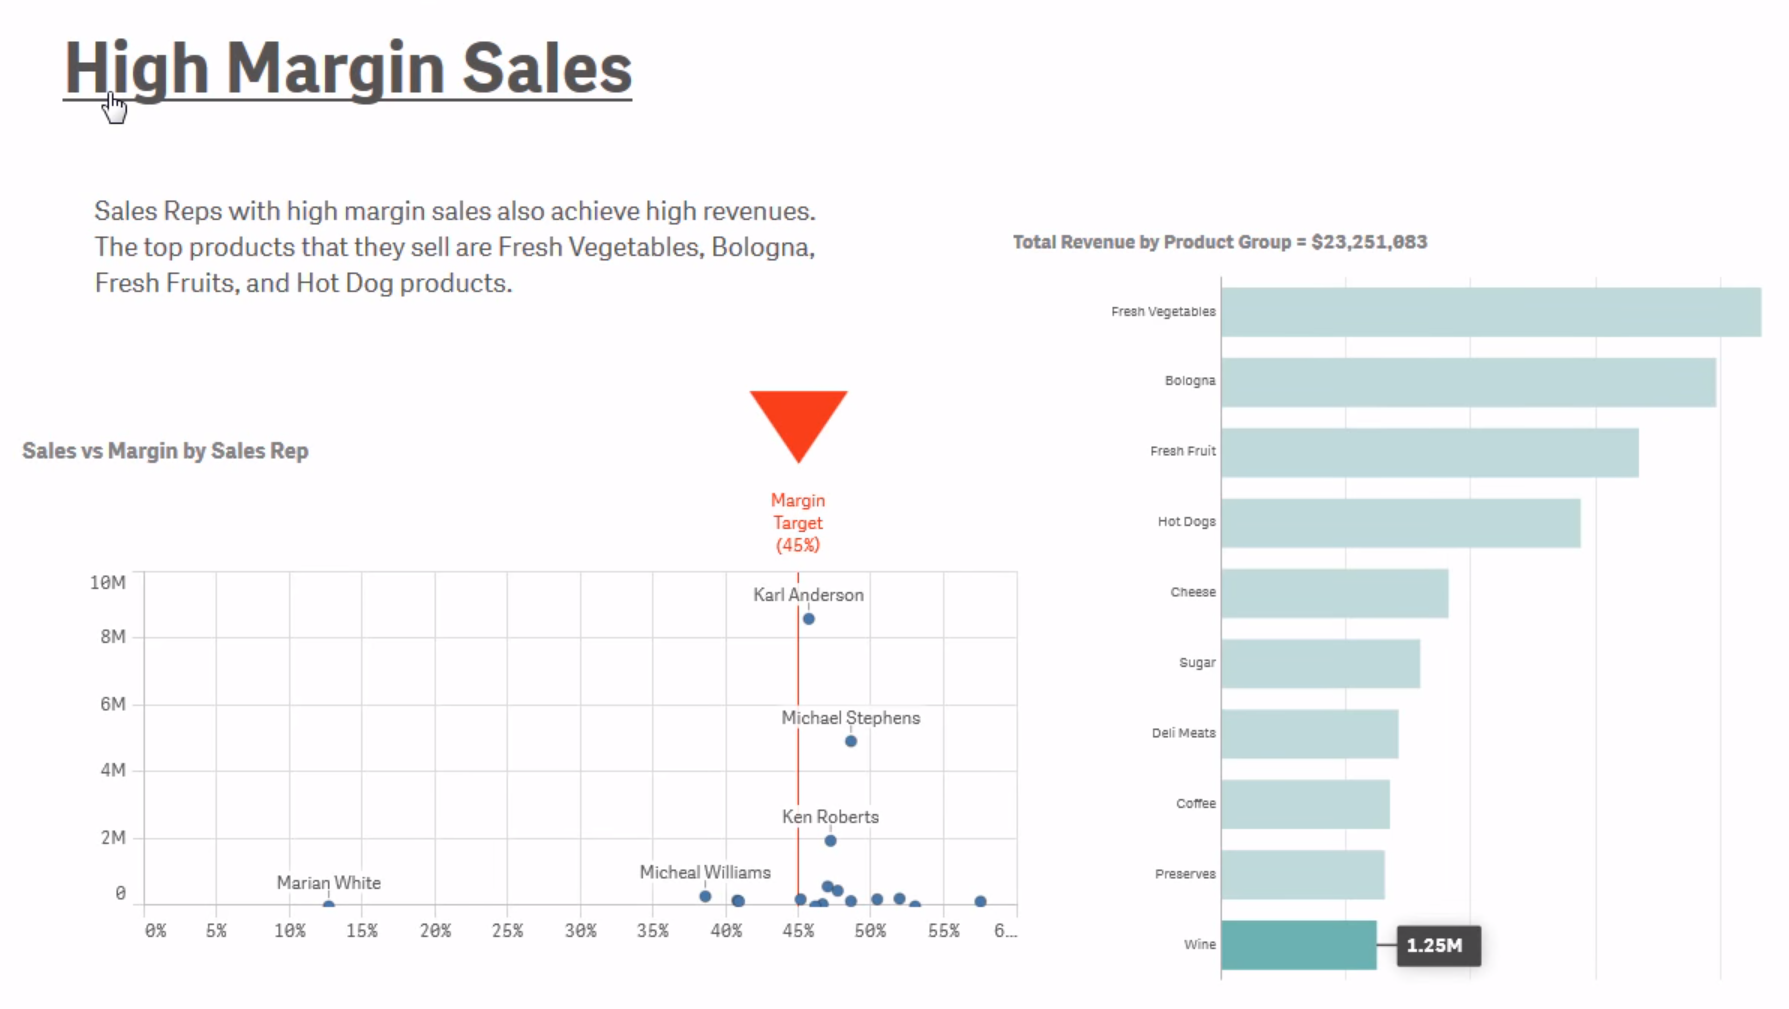
Final Story – High Margin Sales
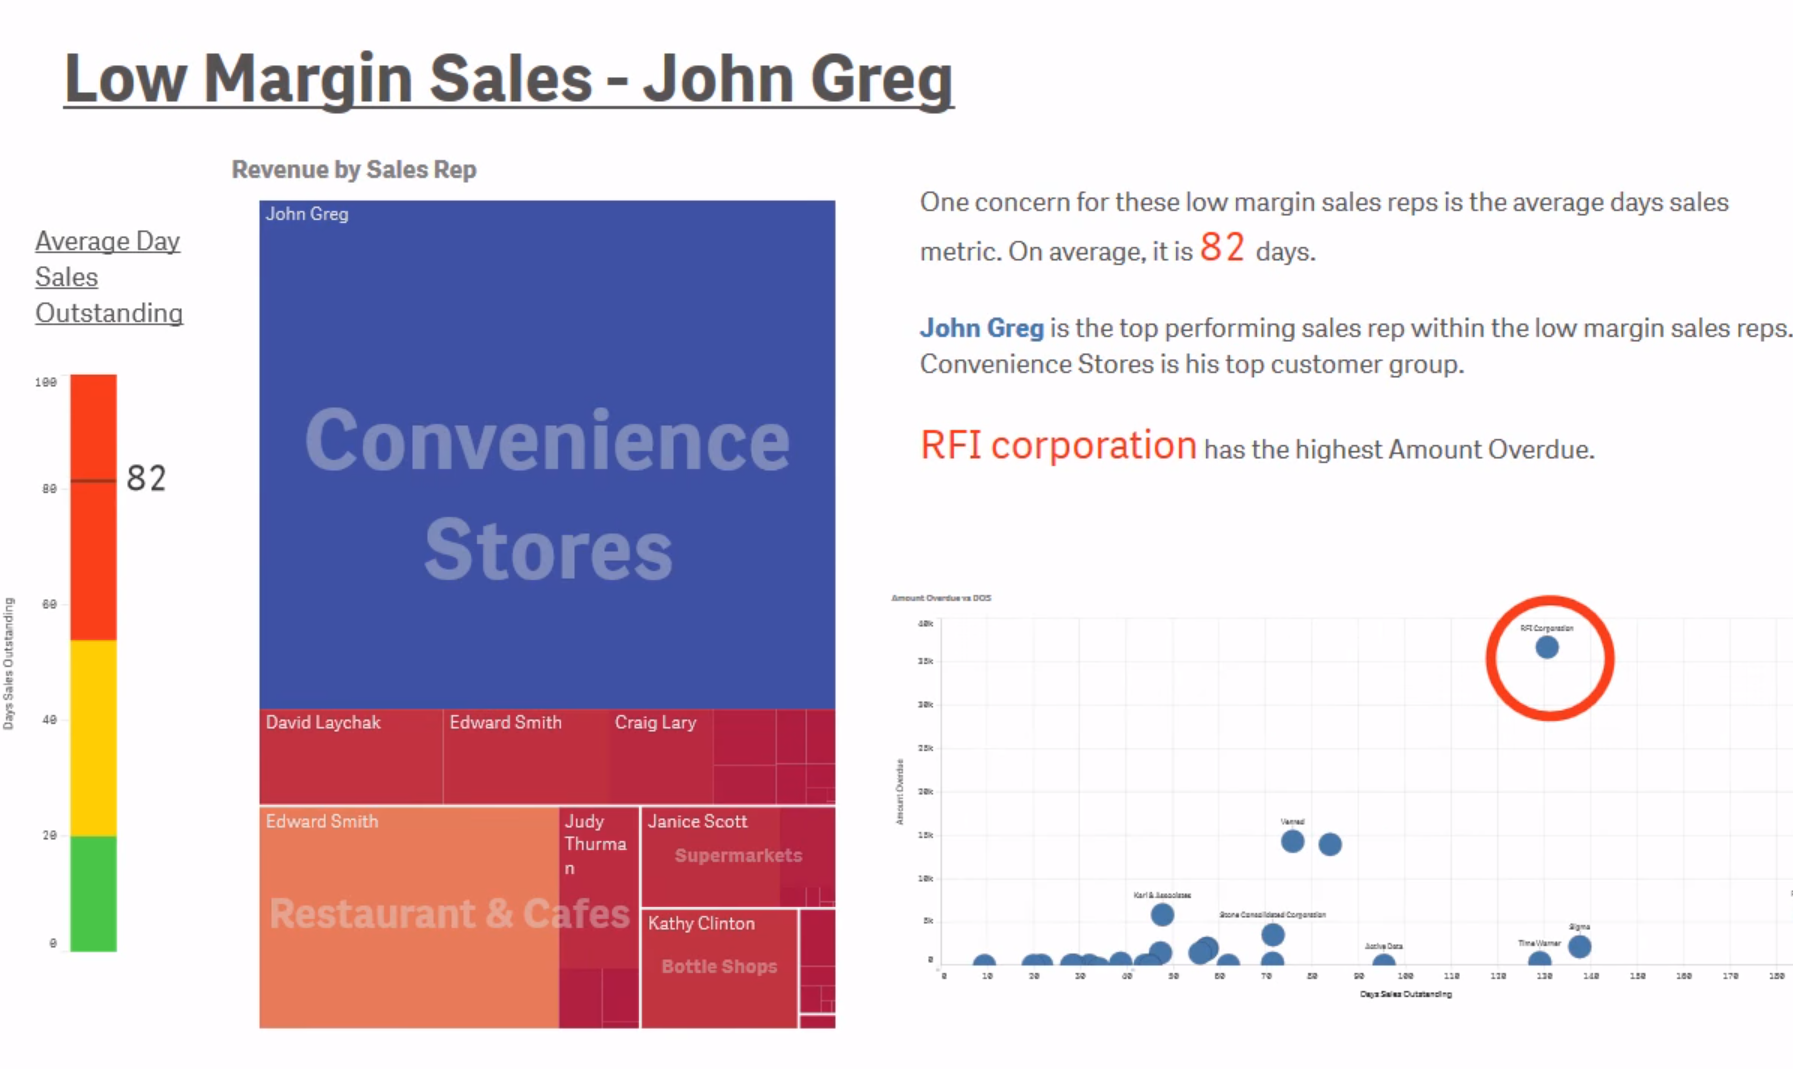
Qlik Sense Collaboration – Final Story
ii. Publishing
Another way of data collaboration is sharing your Qlik Sense apps with other through publishing them in streams. A data stream is a collection of all the published apps that all the authorized users have access to. Ideally, a user publishes an app into a stream when the app is ready and designed. Although, a user can always edit the published app and republish it if they want to.
When an app is published, it is locked for everyone else except for the user who published it. No one else can edit the sheets and stories of the published app, however, they can interact with the charts by making selections and drawing insights into data according to them.
Publishing apps are done a little differently in Qlik Sense Enterprise version. There, the administrator has the rights to publish an app via the Qlik Management Console. Also, the users who have created the apps, can publish them on the hub and share them between different streams. However, publishing apps are within the bounds of Qlik Sense and the sharing of apps happens only between the Qlik Sense platforms.
Recommended Reading – Qlik Sense Versions
iii. Exporting and Printing
You can export Qlik Sense apps, sheets, stories or visualizations as pdf or excel files and printed for uses external to Qlik Sense. You can export the visualizations or sheets individually then print them from your device.
If you want to export a visualization or chart, then right-click on the visualization, go to the Export option.
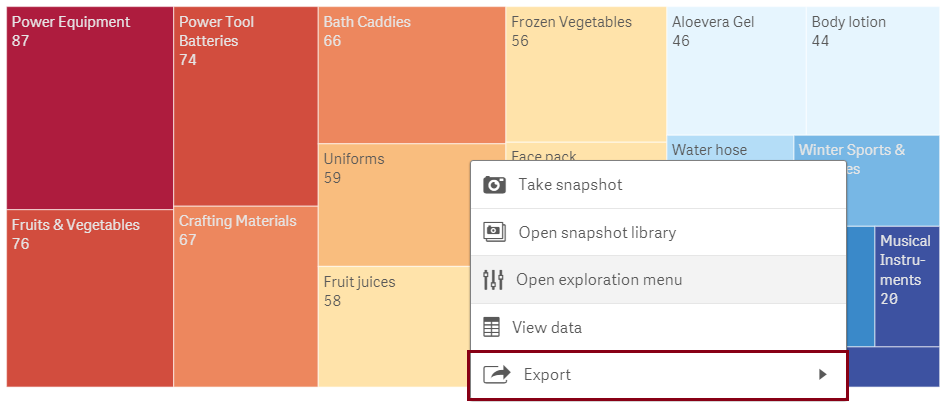
Exporting & Printing in Qlik Sense Collaboration
You will get three options for exporting, as an image, as a PDF, or as data in Qlik Sense.
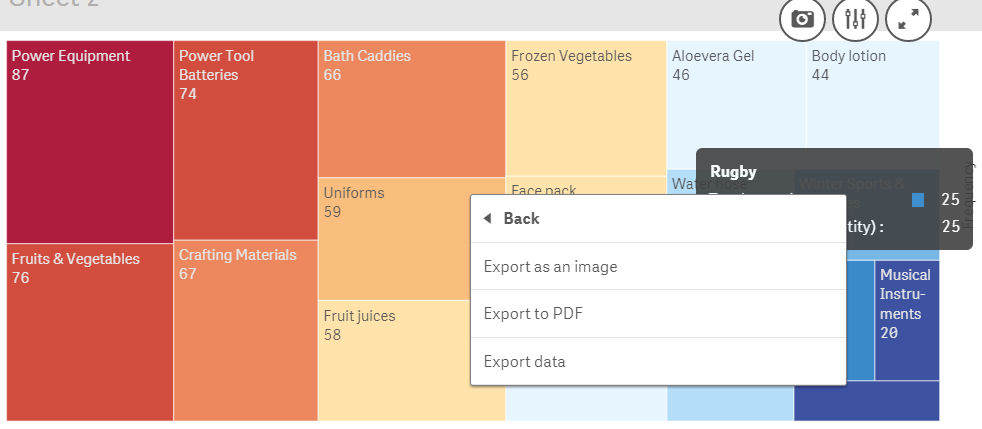
Export as Image, PDF, or Data
If you export data as image, then you will get to adjust some image settings like image dimensions, type of image file etc. Then click on Export and wait until you get a link from where you can download your image.
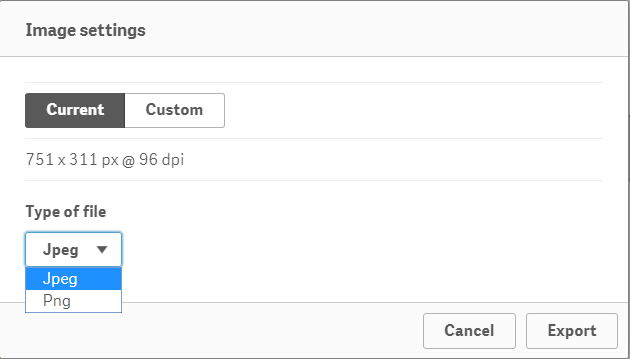
Qlik Sense Collaboration – Export Data as Image
Download The Image
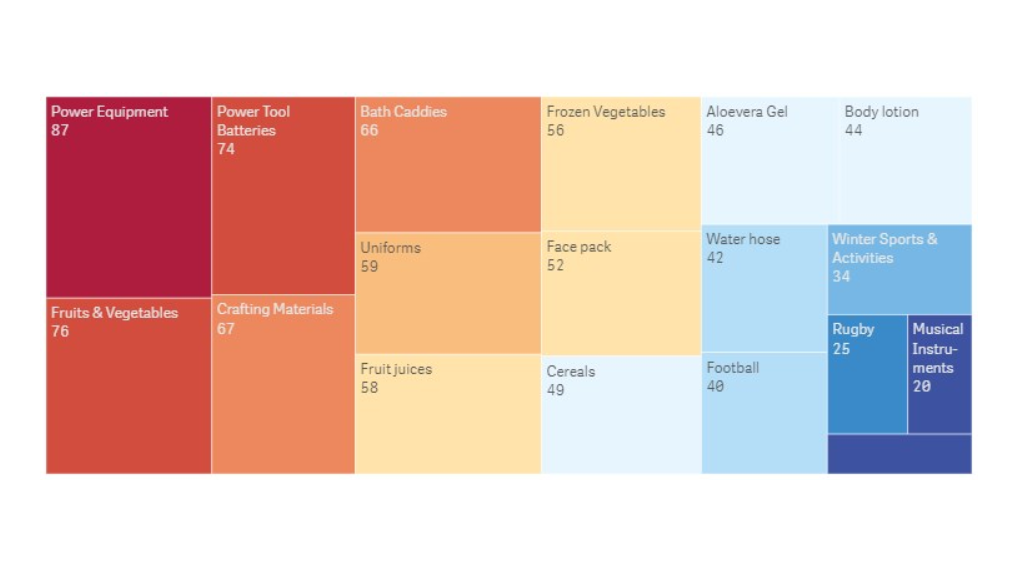
If you want to export your visualization as a PDF file. Then select the Export to PDF option, make required adjustments and click on Export.
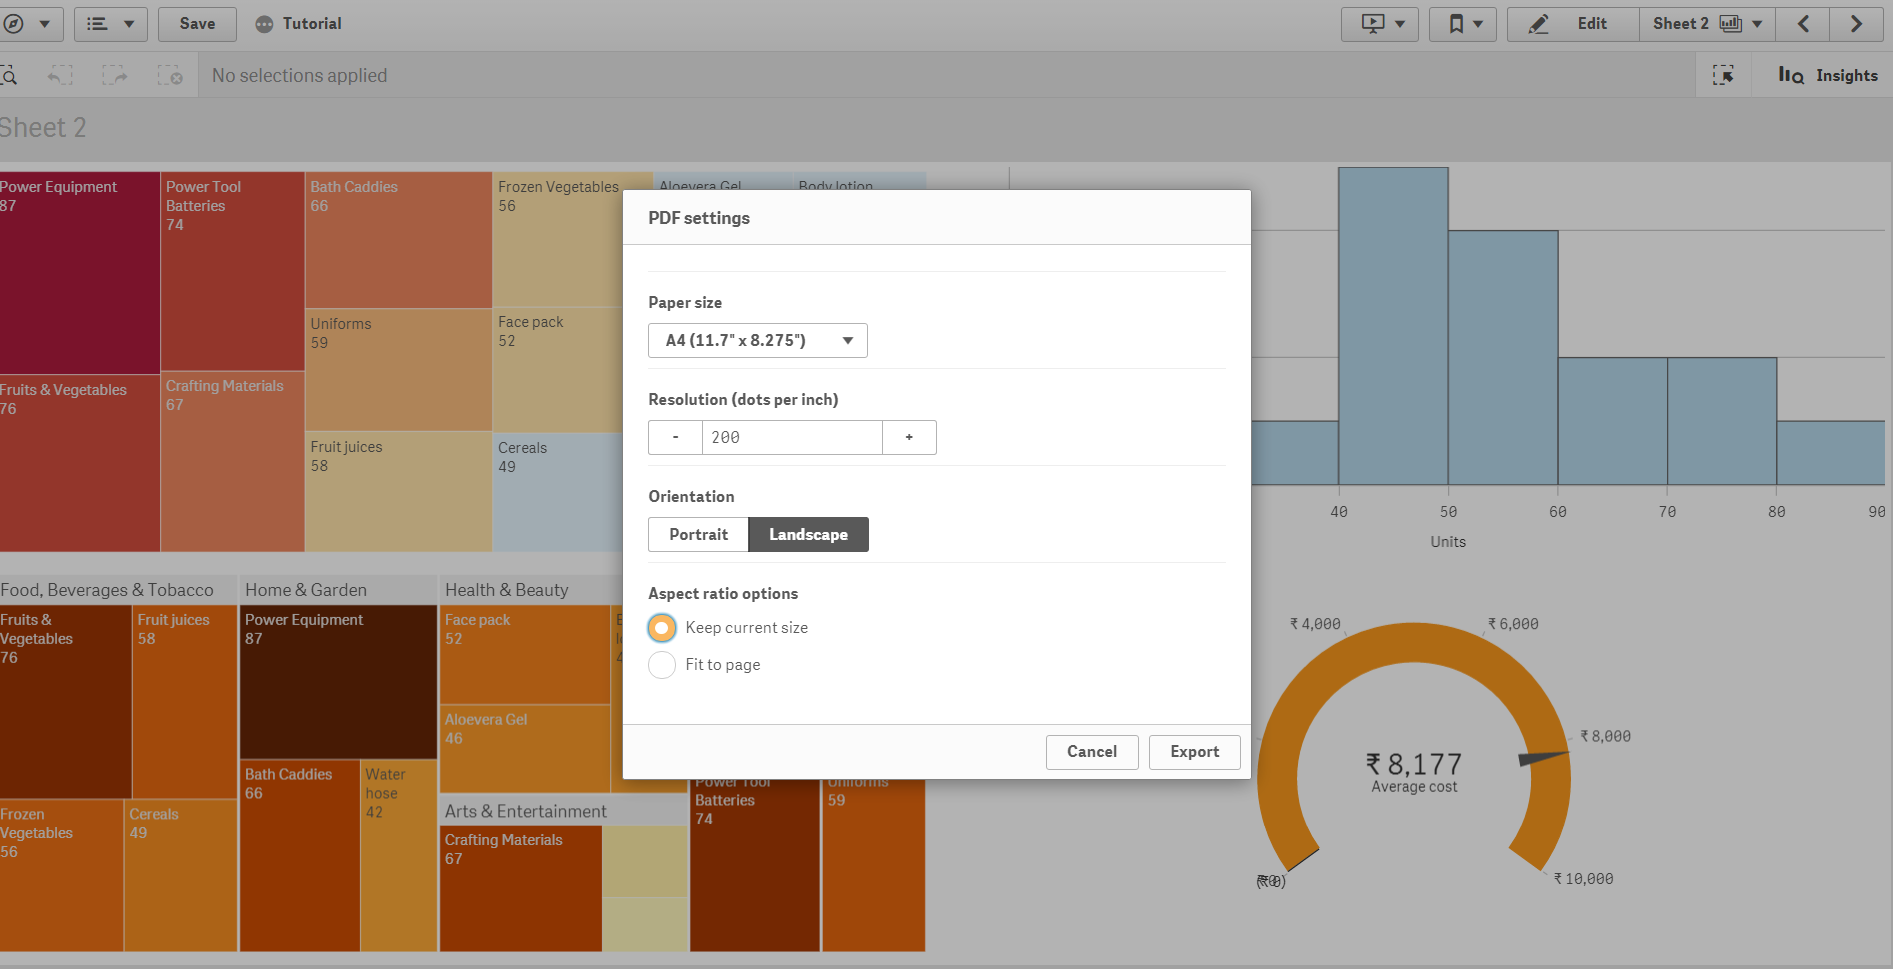
Export as PDF
You must look at Qlik Sense Text and Image Visualization
Download the file by clicking on the link.
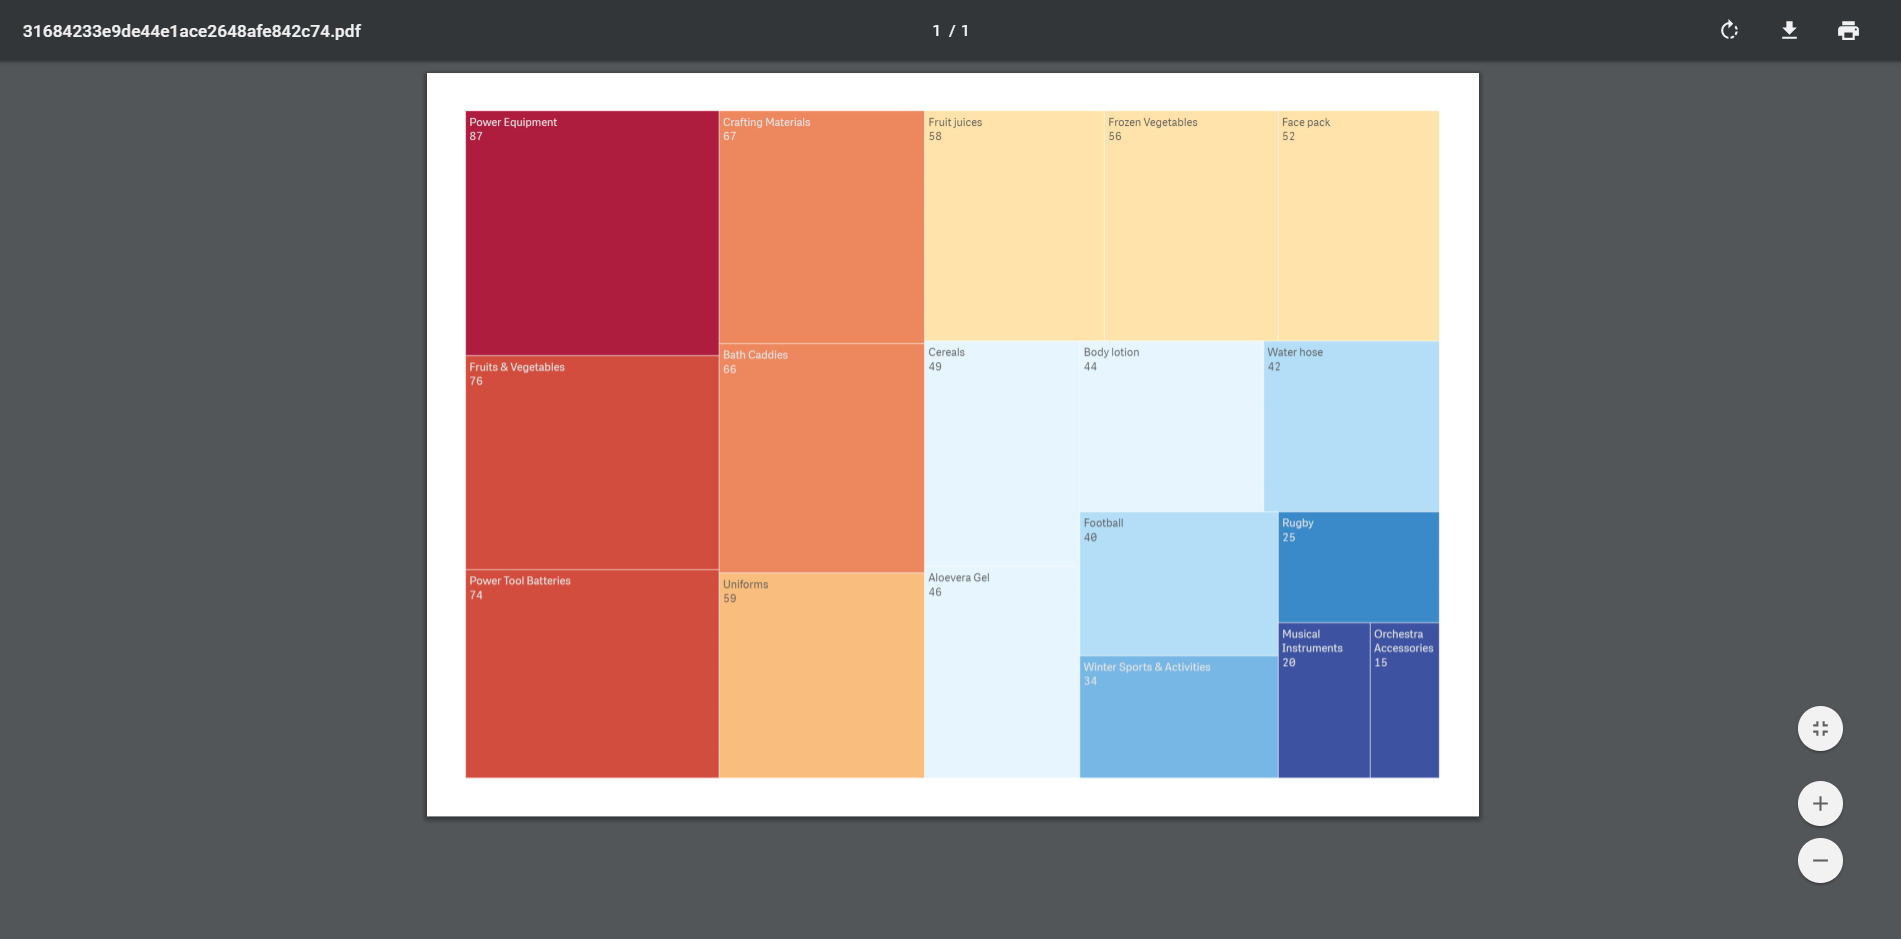
Qlik Sense Collaboration – Download the File
You can also export an entire sheet as a PDF file from the menu given on the sheet.
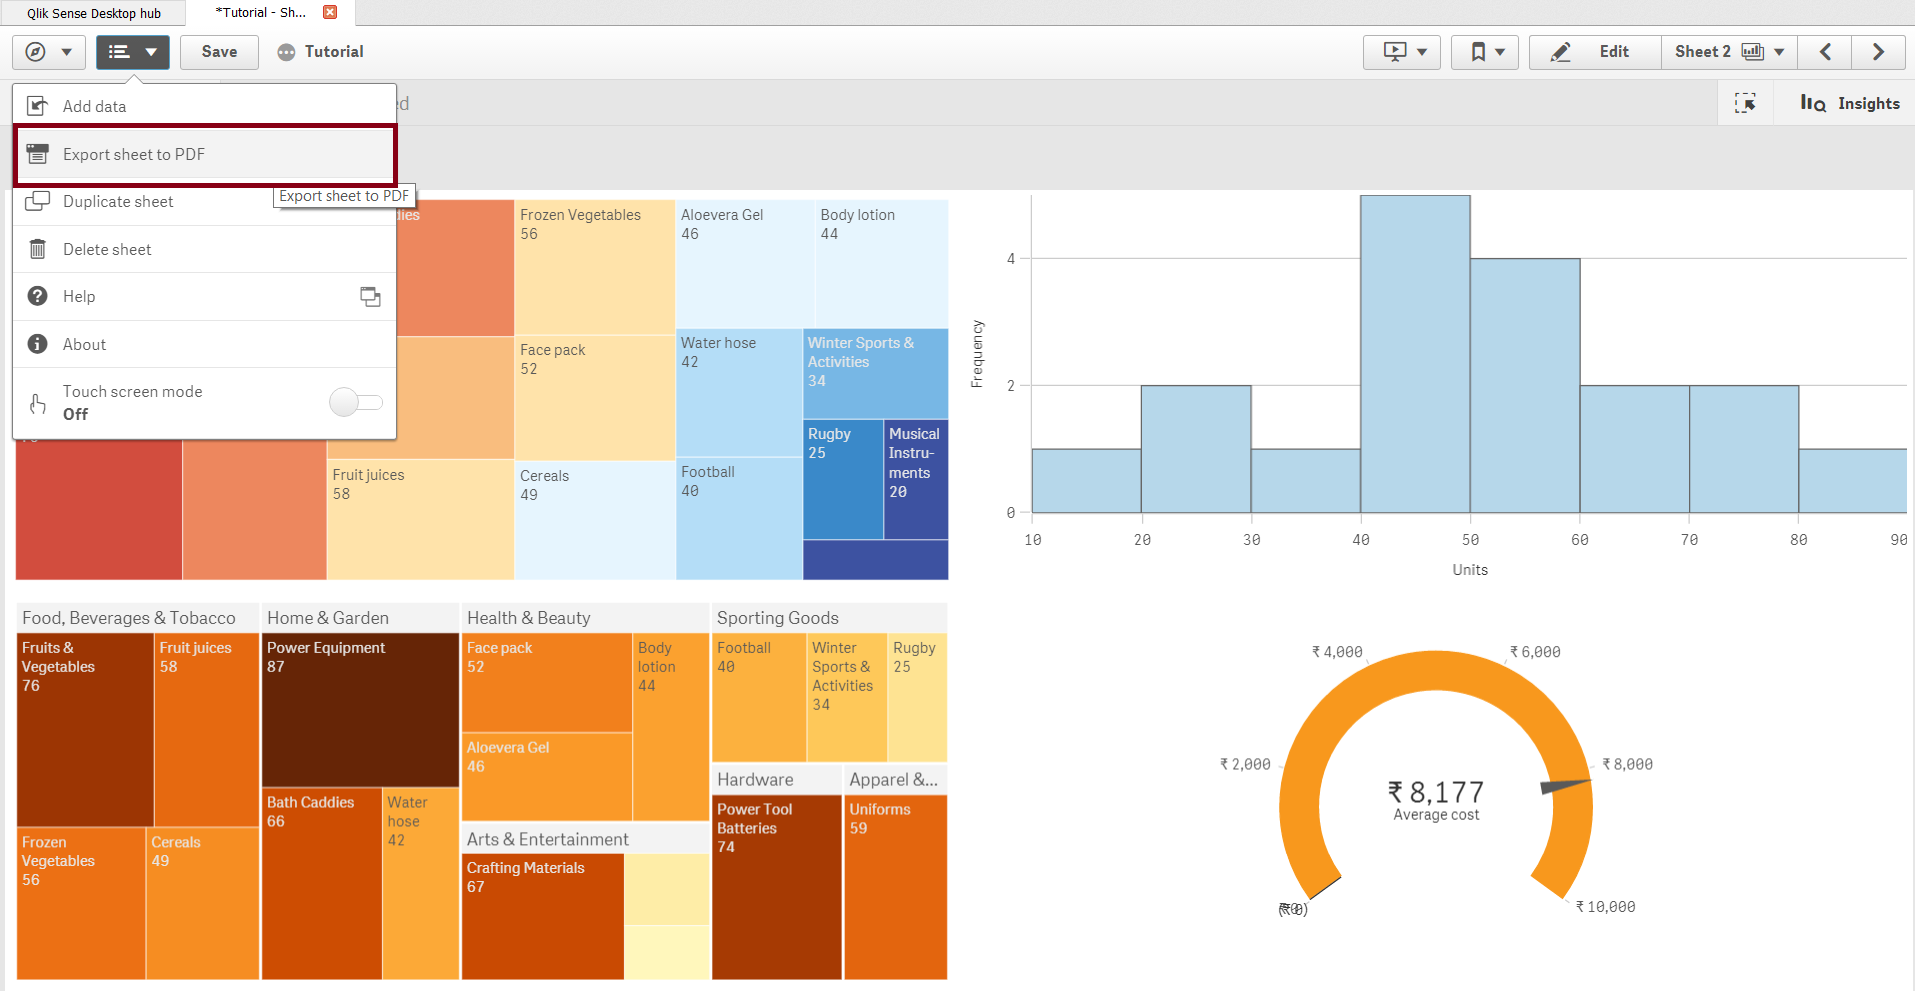
Export the Entire Sheet as PDF
So, this was all in Qlik Sense Collaboration. Hope you like our explanation.
2. Summary
This completes our learnings on the topic of Data Collaboration in Qlik Sense. Collaboration opens up opportunities for multiple users to put in their insights and discoveries into making one application that is more insightful and comprehensive than the app made by only one user. You can tell us your experience of learning Qlik Sense Collaboration through comments.
You must check our latest Qlik Sense article – Script Syntax
If you are Happy with DataFlair, do not forget to make us happy with your positive feedback on Google


