Python Statistics – Python p-Value, Correlation, T-test, KS Test
Python course with 57 real-time projects - Learn Python
1. Python Statistics
In this Python Statistics tutorial, we will learn how to calculate the p-value and Correlation in Python. Moreover, we will discuss T-test and KS Test with example and code in Python Statistics.
So, let’s start the Python Statistics Tutorial.
2. p-value in Python Statistics
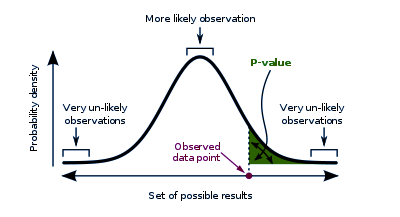
When talking statistics, a p-value for a statistical model is the probability that when the null hypothesis is true, the statistical summary is equal to or greater than the actual observed results. This is also termed ‘probability value’ or ‘asymptotic significance’.
Do you know about Python Decorators
The null hypothesis states that two measured phenomena experience no relationship to each other. We denote this as H or H0. One such null hypothesis can be that the number of hours spent in the office affects the amount of salary paid. For a significance level of 5%, if the p-value falls lower than 5%, the null hypothesis is invalidated. Then it is discovered that the number of hours you spend in your office will not affect the amount of salary you will take home. Note that p-values can range from 0% to 100% and we write them in decimals. A p-value for 5% will be 0.05.
A smaller p-value bears more significance as it can tell you that the hypothesis may not explain the observation fairly. If one or more of these probabilities turn out to be less than or equal to α, the level of significance, we reject the null hypothesis. For a true null hypothesis, p can take on any value between 0 and 1 with equal likeliness. For a true alternative hypothesis, p-values likely fall closer to 0.
3. T-test in Python Statistics
Let’s talk about T-tests. Such a test tells us whether a sample of numeric data strays or differs significantly from the population. It also talks about two samples- whether they’re different. In other words, it gives us the probability of difference between populations. The test involves a t-statistic. For small samples, we can use a T-test with two samples.
Let’s discuss Python Generators
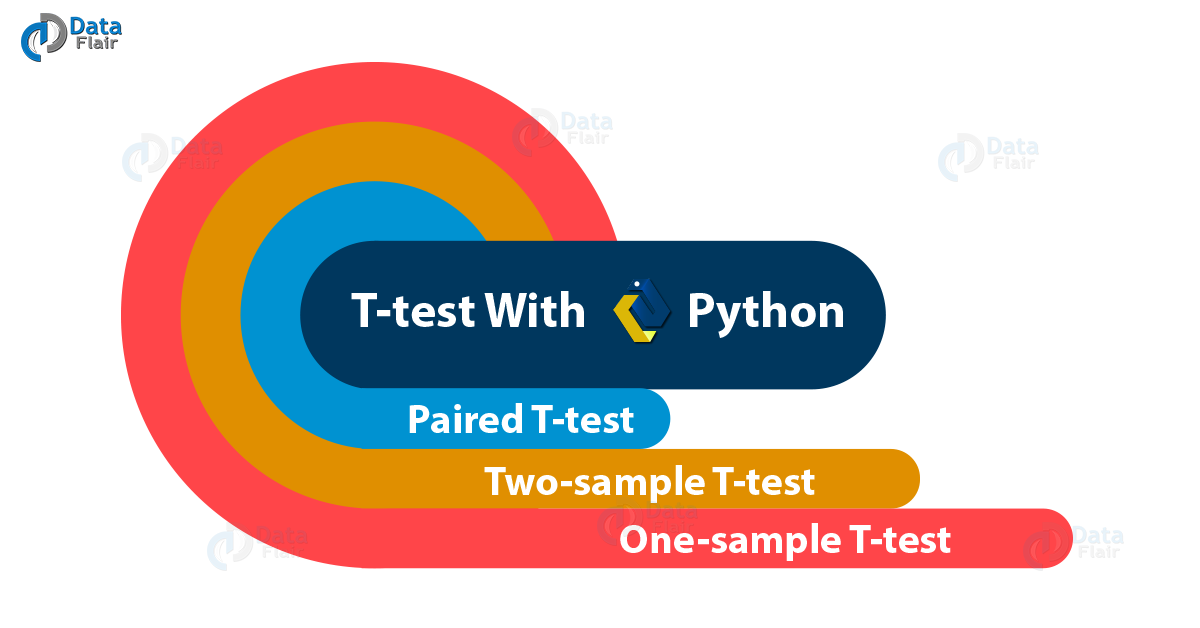
a. One-sample T-test with Python
Let’s try this on a single sample. The test will tell us whether means of the sample and the population are different. Consider the voting populace in India and in Gujarat. Does the average age of Gujarati voters differ from that of the population? Let’s find out.
>>> import numpy as np
>>> import pandas as pd
>>> import scipy.stats as stats
>>> import matplotlib.pyplot as plt
>>> import math
>>> np.random.seed(6)
>>> population_ages1=stats.poisson.rvs(loc=18,mu=35,size=150000)
>>> population_ages2=stats.poisson.rvs(loc=18,mu=10,size=100000)
>>> population_ages=np.concatenate((population_ages1,population_ages2))
>>> gujarat_ages1=stats.poisson.rvs(loc=18,mu=30,size=30)
>>> gujarat_ages2=stats.poisson.rvs(loc=18,mu=10,size=20)
>>> gujarat_ages=np.concatenate((gujarat_ages1,gujarat_ages2))
>>> population_ages.mean()
43.000112
>>> gujarat_ages.mean()
39.26
>>> stats.ttest_1samp(a=gujarat_ages,popmean=population_ages.mean())
Ttest_1sampResult(statistic=-2.5742714883655027, pvalue=0.013118685425061678)
Now this value of -2.574 tells us how aberrant the sample mean is from the null hypothesis.
b. Two-sample T-test With Python
Such a test tells us whether two data samples have different means. Here, we take the null hypothesis that both groups have equal means. We don’t need a known population parameter for this.
Let’s revise Recursion in Python
>>> np.random.seed(12)
>>> maharashtra_ages1=stats.poisson.rvs(loc=18,mu=33,size=30)
>>> maharashtra_ages2=stats.poisson.rvs(loc=18,mu=13,size=20)
>>> maharashtra_ages=np.concatenate((maharashtra_ages1,maharashtra_ages2))
>>> maharashtra_ages.mean()
42.26
>>> stats.ttest_ind(a=gujarat_ages,b=maharashtra_ages,equal_var=False)
Ttest_indResult(statistic=-1.4415218453964938, pvalue=0.1526272389714945)
The value of 0.152 tells us there’s a 15.2% chance that the sample data is such far apart for two identical groups. This is greater than the 5% confidence level.
c. Paired T-test With Python
When you want to check how different samples from the same group are, you can go for a paired T-test. Let’s take an example.
>>> np.random.seed(11)
>>> before=stats.norm.rvs(scale=30,loc=250,size=100)
>>> after=before+stats.norm.rvs(scale=5,loc=-1.25,size=100)
>>> weight_df=pd.DataFrame({"weight_before":before,
                         "weight_after":after,
                         "weight_change":after-before})
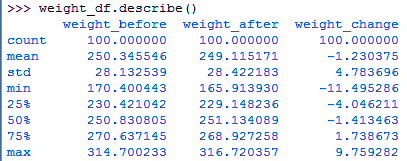
>>> weight_df.describe()>>> stats.ttest_rel(a=before,b=after)
Ttest_relResult(statistic=2.5720175998568284, pvalue=0.011596444318439857)
So, we see we have just 1% chances to find such huge differences between samples.
Do you know about Python Errors
4. KS Test in Python Statistics
This is the Kolmogorov-Smirnov test. It lets us test the hypothesis that the sample is a part of the standard t-distribution. Let’s take an example.
>>> stats.kstest(x,'t',(10,))
KstestResult(statistic=0.023682909426459897, pvalue=0.6289865281325614)
>>> stats.kstest(x,'norm')
KstestResult(statistic=0.019334747291889, pvalue=0.8488119233062457)
Pay attention to the p-values in both cases.
a. Two samples
What we saw above was the KS test for one sample. Let’s try two.
>>> stats.ks_2samp(gujarat_ages,maharashtra_ages)
Ks_2sampResult(statistic=0.26, pvalue=0.056045859714424606)
5. Correlation in Python Statistics
This is a statistical relationship between two random variables (or bivariate data). This can be causal. It is a measure of how close two variables are to holding a linear relationship to each other. One such example will be the correlation between demand and supply for a product whose supply is limited.
Have a look at Exception Handling in Python
Correlation can denote a predictive relationship that we can exploit. To measure the degree of correlation, we can use constants like ρ or r. Benefits of correlation-
- Predicting one quantity from another
- Discovering the existence of a causal relationship
- Foundation for other modeling techniques
a. Example of Correlation In Python
Let’s take an example.
>>> df=pd.read_csv('furniture.csv',index_col='Serial',parse_dates=True)
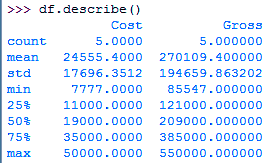
>>> df['Gross']=df.Cost+df.Cost*10
>>> df.describe()>>> df.corr()
This gives us how each column correlates to another. You can also calculate the covariance in the following way-
>>> df.cov()
Cost Gross
Cost 3.131608e+08 3.444769e+09
Gross 3.444769e+09 3.789246e+10
b. Plotting Correlation in Python
Let’s use seaborn to plot the correlation between columns of the ‘iris’ dataset.
Let’s revise Python Iterator
>>> import seaborn as sn
>>> df1=sn.load_dataset('iris')
>>> sn.pairplot(df,kind='scatter')
<seaborn.axisgrid.PairGrid object at 0x06294090>
>>> plt.show()
c. Saving the Results
We can export the result of a correlation as a CSV file.
>>> d=df1.corr()
>>> d.to_csv('iriscorrelation.csv')
This gives us the following CSV file-
So, this was all in Python Statistics. Hope you like our explanation.
6. Conclusion: Python Statistics
Hence, in this Python Statistics tutorial, we discussed the p-value, T-test, correlation, and KS test with Python. To conclude, we’ll say that a p-value is a numerical measure that tells you whether the sample data falls consistently with the null hypothesis. Correlation is an interdependence of variable quantities. Still, if any doubt regarding Python Statistics, ask in the comment tab.
See also –
Python Directory and Files
For reference
Did you know we work 24x7 to provide you best tutorials
Please encourage us - write a review on Google


This tutorial seems good but ‘minnesota_ages1’ and ‘minnesota_ages2’ are inexistent, so the code doesn’t work!
Hi Alkis,
Thanks for connecting us through this Python Statistics tutorial.
Good catch, it should be gujarat_ages1 and gujarat_ages2. We have made the correction.
Regards,
DataFlair
>>> sn.pairplot(df,kind=’scatter’)
seems it should be df1
Hey Vimal Prakash,
Update the code. Change df to df1 in this single line.
Nice blog. I wanti to ask question. For example, we have code like this. I have 4 method to increase plant height.
Now, we want to check method’s significancy that affect height of plant
pair_t = dataframe.t_test_pairwise(‘C(Method)’)
pair_t.result_frame
I got p>|t| and pvalue-hs. Please tell me the different
Hi, thanks for sharing it’s great learning material! Wonder if you can share the sample data you used as example for t-test?
Hi,
It’s good learning material . Thanks for sharing.
I am Studying Data Science. It would be really helpful if you can share the datafiles also.